Most Requested Symbols

As market leadership rotated away from growth-driven areas, one defensive area showing meaningful improvement has been dividend‑oriented equities
This week’s action has seen continued upside and near-term leadership out of energy funds and stocks.
Weekly Rundown Video – Feb 18, 2026
Weekly rundown with NDW analyst team covering all major asset classes.
Weekly rundown with NDW analyst team covering all major asset classes.
Beginners Series Webinar: Join us on Monday, February 9th at 2 PM (ET) for our NDW Beginners Series Webinar. This week's topic is: Idea Generation with Stocks and Funds Register Here
The new year opened with several of the largest indices extending the strong performance trends seen in recent years. Yet as market leadership rotated away from growth-driven areas toward more defensive segments, many of the prior “risk-on” leaders have lost some momentum. This shift is evident in domestic equities dropping to second place within our DALI asset class rankings and the technology sector transitioning into equal-weight territory in our sector rankings. In contrast, one defensive area showing meaningful improvement early in 2026 has been dividend‑oriented equities.
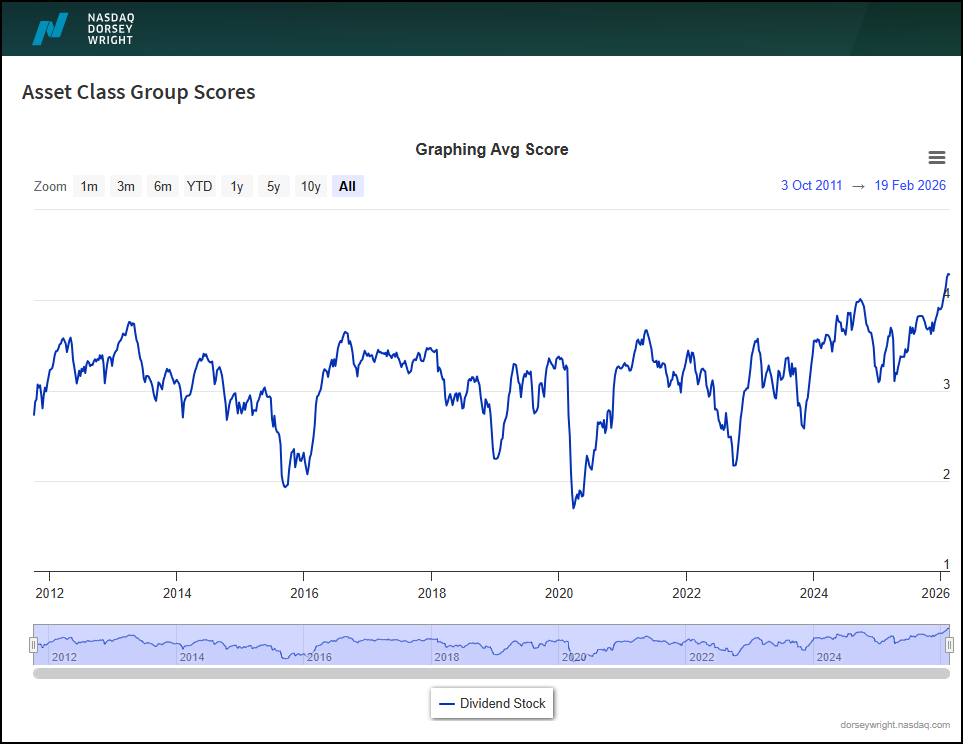
For context, dividend-paying stocks are generally characterized as mature companies, with a consistent history of proven earnings ability and strong cash flows. On a factor-basis, these typically fall under “low-volatility” and “value-oriented” factors, given the nature of their business. The Asset Class Group Scores (ACGS) page offers a great tool to gauge the performance of several groups, along with a historical time-series of how that group has performed over time. On the ACGS page, the “Dividend Stock” has been on quite the run in recent months. The group currently maintains an average score of 4.27, placing it above the 75th percentile in terms of ranking on that page. As shown in the image below, the dividend stock group crossed above 4.0 for the second time since 2011 (when the group was added on the ACGS page). Since crossing above 4.0, the group’s average score has continued to climb higher, as it now maintains readings in all-time high territory.
There are several approaches that can be used to gain exposure into dividend-paying areas. One approach includes using the NDW Yield Portfolio (SPX500YLD) model found in our “Model Lists” page. The portfolio is created by using the highest dividend yielding stocks in the S&P 500 and utilizes our NDW relative strength matrix methodology. As per the rules, the model buys stocks that:
For a position to be sold, the stock must
Year-to-date, the model has outperformed the S&P 500 (SPX) benchmark by over 8%. Additionally, when looking at the 5-year performance, the model has outperformed by north of 1.5% year-over-year. As a nuance, this performance figure does not include the “total return” of the model. Which, if accounted for, would yield a higher performance figure by several hundred basis points (current yield on model= 3.88%). Altogether, this makes the model a practical tool for investors seeking to incorporate high-yield equities into their asset-allocation strategy.

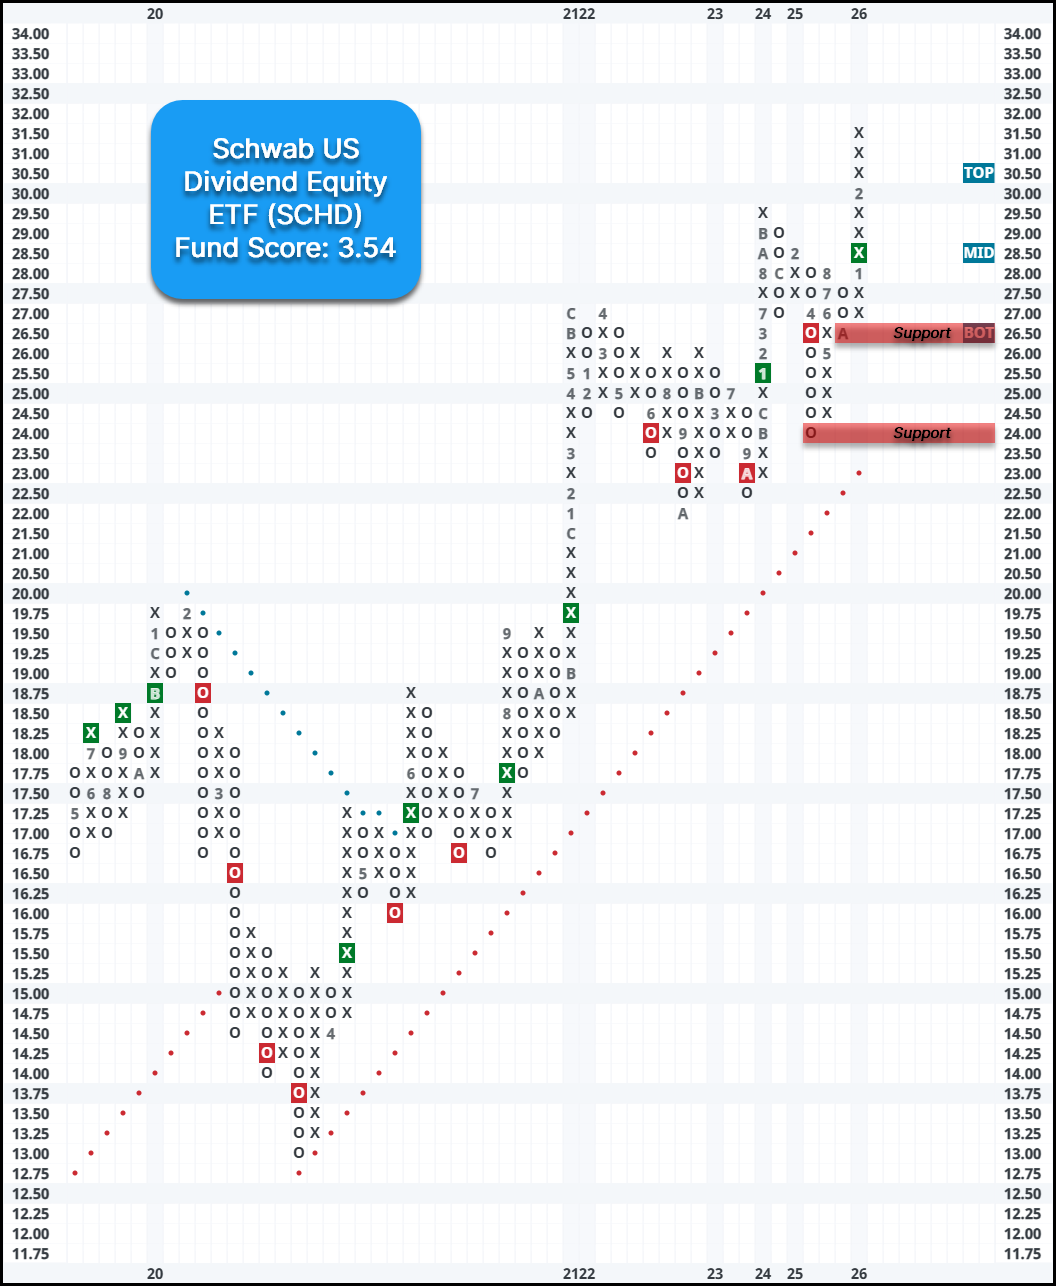
For those who are more interested in simply using an ETF to gain exposure, you could consider using the Schwab US Dividend Equity ETF (SCHD), which provides exposure to high-yielding U.S. dividend-paying stocks with a minimum of 10 consecutive years of dividend payments. The fund reversed back to a buy signal after completing a double top break at $28.50 last month. SCHD maintains a technically acceptable fund score of 3.54 with a notable score direction of 1.70, highlighting its improvement in recent months. Year-to-date (YTD), the fund is up over 15% and ~5.9% in February alone. Additionally, the fund offers an impressive yield of 3.5%. The weekly OBOS indicates that the fund is in overbought territory, so wait for the 10-week trading band to normalize before considering. Initial support is at $26.50, with additional support at $24 dating back to mid-2025.

This week’s action has seen continued upside and near-term leadership out of energy funds and stocks. A little over a week ago, the sector moved to the third position within the NDW DALI Sector Rankings, and this week’s action has brought energy within one signal of basic materials in second. The broader State Street Energy Select Sector SPDR Fund (XLE) continues to trade near last week’s all-time chart highs, while the Invesco S&P Equal Weight Energy ETF (RSPG) improved on recent highs during Thursday’s trading (2/19), rallying above $99.
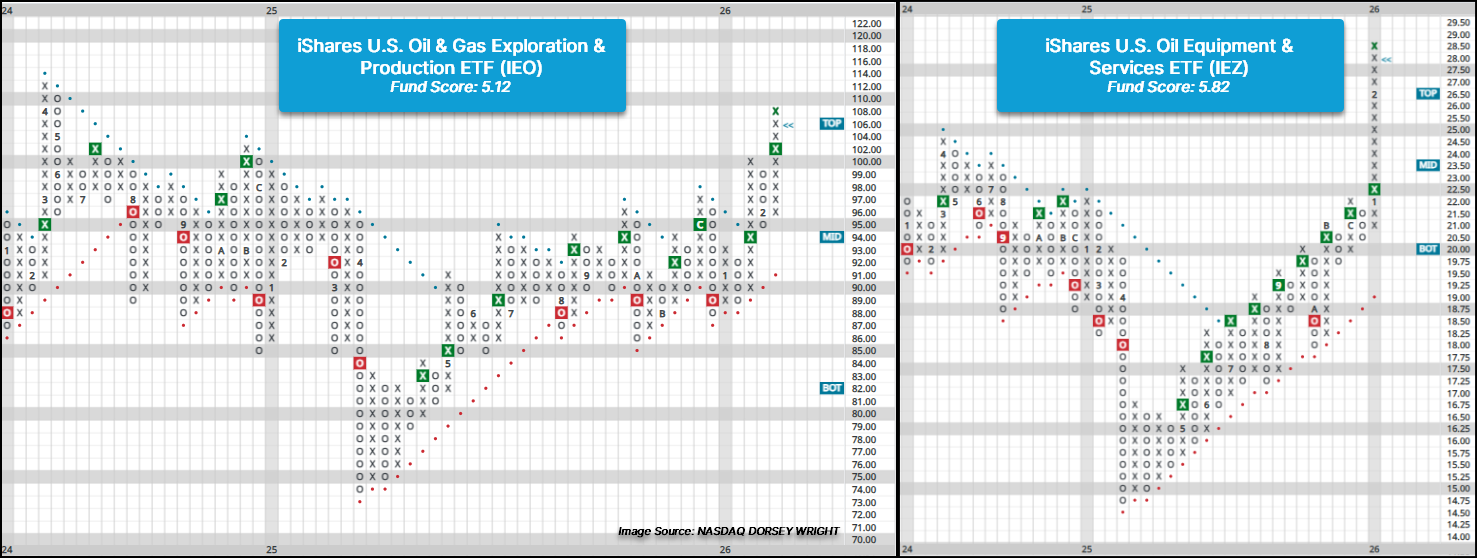
Under the hood of the broader energy sector, the iShares U.S. Oil & Gas Exploration ETF (IEO) and iShares U.S. Oil Equipment & Services (IEZ) has shown notable technical improvement with both rallying to multi-year highs. Thursday’s (2/19) action brought the trend chart of IEO within a couple boxes of its all-time chart high at $112, and the market RS chart returned to a buy signal after having been on an RS sell signal since February 2023. IEO now joins IEZ with a fund score above 5 (out of 6) with IEZ having maintained a market RS buy signal and score above 5 since mid-January. Both ETFs are trading in overbought territory with weekly OBOS readings north of 100%, so those seeking long energy exposure are best to look for a pullback from recent highs down to prior resistance levels before considering. IEO is actionable at $102, while IEZ is action in the $25 range.
Most energy-related ETFs show extended and/or overbought positions on their point and figure trend charts. Energy stocks present a variety of different chart characteristics, but two provide notable examples of the rally witnessed within most.
Like energy funds, Exxon Mobil Corporation (XOM) rallied notably to kick off 2026. After giving a second buy signal in November last year, XOM cleared resistance in the $120s in January before improving to an all-time high in February at $156. Thursday’s action brought the trend chart back into a column of Xs after briefly pulling back last week, indicating price consolidation has begun. With the stock maintaining a 4 technical attribute rating and ranking within the top quintile of the oil sector matrix, XOM is likely one within or potentially being considered for client portfolios. While we look for chart and price consolidation, a normalization of the 10-week trading band is also needed before adding new or additional exposure.
BP has rallied along within the broader sector, giving a second buy signal in January as it has rallied to $39. Unlike Exxon though, BP didn’t rally to new highs and has notable resistance in the $40 to $41 range. BP maintains a 4 technical attribute rating due to superior market RS and a positive trend and ranks within the top half of the oil sector matrix while yielding north of 5%. While short-term holders may look to lock in a profit with the rally, resistance in play likely warrants patience for long-term holders. A move above resistance signals potential for further upside and would develop long-term support.
Stocks with similar chart action to XOM and BP could have similar approaches, but should there be any questions, feel free to reach out to the analyst team.

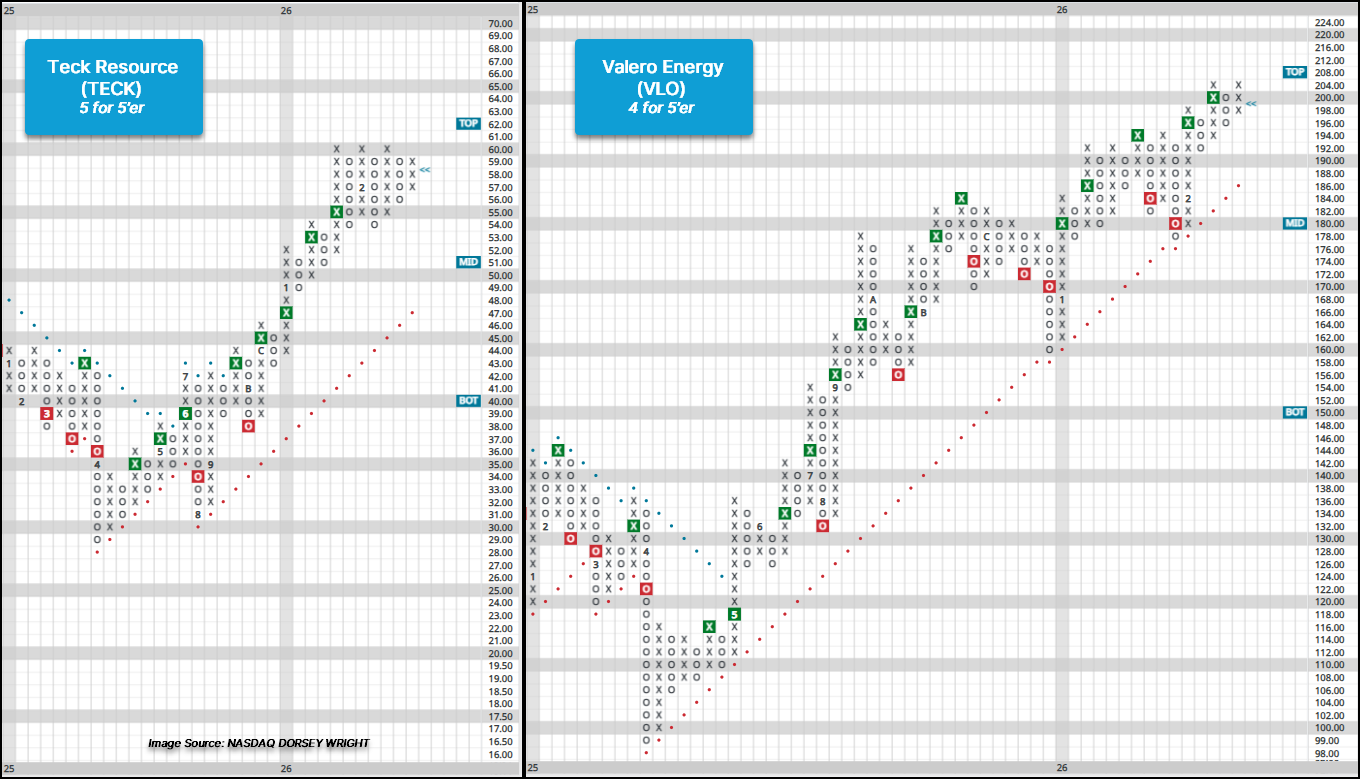
Though it may seem there is a lack of actionable energy ideas, they’re out there. Two potential options are Teck Resources (TECK) and Valero Energy (VLO), both of which rank within the top half of the oil services sector matrix. TECK has been a 5 for 5’er since seeing its peer RS chart give an RS buy signal in the latter part of January, while VLO has maintained a 4 TA rating since July last year. TECK has consolidated during February’s trading and is currently actionable in the mid $50 to $60 range, while VLO broke out of a brief consolidation to kick off February and is actionable at current prices.
To cull out other potential ideas within the energy sector, NDW users can utilize the screener tool to search for 4 and 5 technical attribute names that maintain a positive long-term trend and reside within actionable territory (Weekly OBOS ~ 70% or less) on their 10-week trading band.

| Symbol | Name | Price | Yield | PnF Trend | RS Signal | RS Col. | Fund Score | 200 Day MA | Weekly Mom |
|---|---|---|---|---|---|---|---|---|---|
| DIA | SPDR Dow Jones Industrial Average ETF Trust | 494.38 | 1.41 | Positive | Sell | X | 4.08 | 459.67 | - 2W |
| EEM | iShares MSCI Emerging Markets ETF | 61.04 | 2.05 | Positive | Buy | X | 5.55 | 52.28 | + 8W |
| EFA | iShares MSCI EAFE ETF | 104.05 | 3.22 | Positive | Sell | X | 4.52 | 93.25 | + 9W |
| IJH | iShares S&P MidCap 400 Index Fund | 71.66 | 1.30 | Positive | Buy | O | 4.33 | 64.86 | - 1W |
| IJR | iShares S&P SmallCap 600 Index Fund | 130.93 | 1.36 | Positive | Sell | O | 3.25 | 117.00 | - 1W |
| QQQ | Invesco QQQ Trust | 603.47 | 0.45 | Positive | Buy | O | 3.93 | 583.08 | - 8W |
| RSP | Invesco S&P 500 Equal Weight ETF | 203.14 | 1.58 | Positive | Sell | O | 3.21 | 187.81 | + 12W |
| SPY | State Street SPDR S&P 500 ETF Trust | 684.48 | 1.05 | Positive | Buy | X | 4.69 | 650.52 | - 8W |
| XLG | Invesco S&P 500 Top 50 ETF | 57.17 | 0.64 | Positive | Buy | O | 3.66 | 55.61 | - 8W |

Average Level
36.30
| < - -100 | -100 - -80 | -80 - -60 | -60 - -40 | -40 - -20 | -20 - 0 | 0 - 20 | 20 - 40 | 40 - 60 | 60 - 80 | 80 - 100 | 100 - > |
|---|---|---|---|---|---|---|---|---|---|---|---|
|
Buy signalijr
|
|||||||||||
|
Sell signallqd
|
|||||||||||
|
Buy signalVOOV
|
Buy signalgsg
|
||||||||||
|
Sell signalONEQ
|
Buy signalSPY
|
Buy signalgcc
|
Sell signalief
|
Buy signalIJH
|
Buy signalicf
|
||||||
|
Sell signalVOOG
|
Sell signaldx/y
|
Buy signalhyg
|
Buy signaliwm
|
Buy signaltlt
|
Buy signalagg
|
Buy signaluso
|
Buy signaldvy
|
||||
|
Buy signalXLG
|
Buy signalQQQ
|
Buy signalfxe
|
Buy signaldia
|
Buy signalshy
|
Buy signalGLD
|
Buy signalrsp
|
Buy signalEEM
|
Buy signalefa
|
|||
| < - -100 | -100 - -80 | -80 - -60 | -60 - -40 | -40 - -20 | -20 - 0 | 0 - 20 | 20 - 40 | 40 - 60 | 60 - 80 | 80 - 100 | 100 - > |
| AGG | iShares US Core Bond ETF |
| USO | United States Oil Fund |
| DIA | SPDR Dow Jones Industrial Average ETF |
| DVY | iShares Dow Jones Select Dividend Index ETF |
| DX/Y | NYCE U.S.Dollar Index Spot |
| EFA | iShares MSCI EAFE ETF |
| FXE | Invesco CurrencyShares Euro Trust |
| GLD | SPDR Gold Trust |
| GSG | iShares S&P GSCI Commodity-Indexed Trust |
| HYG | iShares iBoxx $ High Yield Corporate Bond ETF |
| ICF | iShares Cohen & Steers Realty ETF |
| IEF | iShares Barclays 7-10 Yr. Tres. Bond ETF |
| LQD | iShares iBoxx $ Investment Grade Corp. Bond ETF |
| IJH | iShares S&P 400 MidCap Index Fund |
| ONEQ | Fidelity Nasdaq Composite Index Track |
| QQQ | Invesco QQQ Trust |
| RSP | Invesco S&P 500 Equal Weight ETF |
| IWM | iShares Russell 2000 Index ETF |
| SHY | iShares Barclays 1-3 Year Tres. Bond ETF |
| IJR | iShares S&P 600 SmallCap Index Fund |
| SPY | SPDR S&P 500 Index ETF Trust |
| TLT | iShares Barclays 20+ Year Treasury Bond ETF |
| GCC | WisdomTree Continuous Commodity Index Fund |
| VOOG | Vanguard S&P 500 Growth ETF |
| VOOV | Vanguard S&P 500 Value ETF |
| EEM | iShares MSCI Emerging Markets ETF |
| XLG | Invesco S&P 500 Top 50 ETF |
| Symbol | Company | Sector | Current Price | Action Price | Target | Stop | Notes |
|---|---|---|---|---|---|---|---|
| JPM | J.P. Morgan Chase & Co. | Banks | $308.05 | lo 300s - mid 320s | 380 | 256 | 5 TA rating, top 25% of favored BANK sector matrix, LT RS buy, LT pos trend, buy-on-pullback |
| EWBC | East West Bancorp, Inc. | Banks | $119.85 | mid 100s - mid 110s | 157 | 92 | 4 for 5'er, top third of favored BANK sector matrix, LT pos peer RS, one box from mkt RS buy, spread quad top |
| GS | Goldman Sachs Group, Inc. | Wall Street | $916.65 | mid-800s - mid-900s | 1416 | 736 | 5 TA rating, top 10% of WALL sector matrix, LT RS buy, LT pos trend, buy-on-pullback |
| PHM | PulteGroup, Inc. | Building | $139.61 | hi 120s - mid 130s | 168 | 110 | 4 for 5'er, top half of BUIL sector matrix, LT pos peer & mkt RS, bullish catapult |
| CBOE | CBOE Global Markets Inc. | Wall Street | $286.17 | lo 260s - mid 280s | 332 | 228 | 5 TA rating, top 25% of WALL sector matrix, LT RS buy, LT pos trend, buy-on-pullback |
| DAL | Delta Air Lines Inc. | Aerospace Airline | $67.44 | mid-to-hi 60s | 99 | 55 | 4 for 5'er, top half of AERO sector matrix, LT pos mkt RS, triple top, buy on pullback |
| JBL | Jabil Circuit, Inc. | Electronics | $262.44 | mid 240s- lo 270s | 352 | 204 | 4 TA rating, top 50% of ELEC sector matrix, LT RS buy, buy-on-pullback |
| ABBV | AbbVie Inc. | Drugs | $224.35 | 210s - low 230s | 284 | 188 | 5 for 5'er, favored DRUG sector, LT pos peer & mkt RS, breakout from consec sell signals, 2.9% yield |
| AB | AllianceBernstein Holding LP | Wall Street | $40.84 | low 40s | 64 | 32 | 4 TA rating, LT mkt RS buy, LT pos trend, top 50% of WALL sector matrix, consec buy signals, buy-on-pullback, yield > 8% |
| SN | SharkNinja, Inc. | Household Goods | $127.32 | 120s - low 130s | 183 | 108 | 4 for 5'er, 3rd of 28 in HOUS sector matrix, multiple buy signals, buy on pullback, R-R>2.0 |
| Symbol | Company | Sector | Current Price | Action Price | Target | Stop | Notes |
|---|
| Symbol | Company | Sector | Current Price | Action Price | Target | Stop | Notes |
|---|---|---|---|---|---|---|---|
| APTV | Aptiv PLC | Autos and Parts | $80.46 | hi 70s - low 80s | 100 | 69 | APTV has fallen to a sell signal. OK to hold here. Maintain $69 stop. |
| Comment | |||||||
|---|---|---|---|---|---|---|---|
|
|
|||||||
SN SharkNinja, Inc. R ($130.27) - Household Goods - SN is a 4 for 5'er that ranks third out of 28 names in the household goods sector matrix. On its default chart, SN has completed three consecutive buy signals and reached a new all-time high in last week's trading. The stock has subsequently pulled back slightly, offering an entry opportunity for long exposure. Positions may be added in the $120s to low $130s and we will set our initial stop at $108, which would take out two levels of support on SN's default chart. We will use the bullish price objective, $183, as our target price, giving us a reward-to-risk ratio north of 2.0.
| 26 | |||||||||||||||||||||||||||||
| 132.00 | X | 132.00 | |||||||||||||||||||||||||||
| 130.00 | X | O | 130.00 | ||||||||||||||||||||||||||
| 128.00 | X | X | O | 128.00 | |||||||||||||||||||||||||
| 126.00 | X | O | X | O | 126.00 | ||||||||||||||||||||||||
| 124.00 | • | X | O | X | 124.00 | ||||||||||||||||||||||||
| 122.00 | X | • | X | O | X | 122.00 | |||||||||||||||||||||||
| 120.00 | X | 9 | O | • | X | O | X | 120.00 | |||||||||||||||||||||
| 118.00 | X | O | X | O | • | X | X | O | X | Mid | 118.00 | ||||||||||||||||||
| 116.00 | X | O | X | O | • | X | O | X | 2 | X | 116.00 | ||||||||||||||||||
| 114.00 | O | O | • | X | O | X | O | 114.00 | |||||||||||||||||||||
| 112.00 | O | • | X | O | X | 112.00 | |||||||||||||||||||||||
| 110.00 | O | • | X | 1 | 110.00 | ||||||||||||||||||||||||
| 108.00 | O | • | X | 108.00 | |||||||||||||||||||||||||
| 106.00 | O | • | X | 106.00 | |||||||||||||||||||||||||
| 104.00 | O | • | X | 104.00 | |||||||||||||||||||||||||
| 102.00 | O | A | • | X | 102.00 | ||||||||||||||||||||||||
| 100.00 | O | X | O | X | • | X | 100.00 | ||||||||||||||||||||||
| 99.00 | O | X | O | X | O | • | X | 99.00 | |||||||||||||||||||||
| 98.00 | O | O | X | X | O | • | C | 98.00 | |||||||||||||||||||||
| 97.00 | O | X | O | X | O | X | • | X | 97.00 | ||||||||||||||||||||
| 96.00 | O | X | X | O | X | O | X | O | • | X | Bot | 96.00 | |||||||||||||||||
| 95.00 | O | X | O | X | O | X | O | X | O | X | • | X | 95.00 | ||||||||||||||||
| 94.00 | O | X | O | X | O | X | O | X | O | X | O | X | 94.00 | ||||||||||||||||
| 93.00 | O | X | O | X | O | X | O | X | O | X | O | X | 93.00 | ||||||||||||||||
| 92.00 | O | X | X | O | X | O | X | O | X | O | O | X | 92.00 | ||||||||||||||||
| 91.00 | • | O | X | O | X | O | X | O | X | O | X | O | X | • | 91.00 | ||||||||||||||
| 90.00 | • | O | X | O | X | O | O | X | O | X | O | X | X | • | 90.00 | ||||||||||||||
| 89.00 | • | O | O | X | O | X | O | O | X | O | X | • | 89.00 | ||||||||||||||||
| 88.00 | • | O | O | X | O | X | O | X | • | 88.00 | |||||||||||||||||||
| 87.00 | • | O | X | O | X | O | X | • | 87.00 | ||||||||||||||||||||
| 86.00 | O | X | O | X | O | • | 86.00 | ||||||||||||||||||||||
| 85.00 | O | X | O | X | • | 85.00 | |||||||||||||||||||||||
| 84.00 | B | O | • | 84.00 | |||||||||||||||||||||||||
| 26 |

| CCJ Cameco Corporation ($121.35) - Metals Non Ferrous - After giving three consecutive sell signals, CCJ returned to a buy signal Friday when it broke a double top at $122. Friday's move adds to a modestly positive technical picture as CCJ is a 3 for 5'er and ranks in the top half of the non-ferrous metals sector matrix. From here, support now sits at $108 while the next level of overhead resistance can be found at $128. |
| CI CIGNA Group/The ($280.31) - Healthcare - CI reversed back into a sell signal after completing a double bottom break at $280. The 1 for 5'er has shown some improvement in 2026, but still sits firmly below technically acceptable territory. Additionally, the stock ranks in the bottom half of the healthcare sector matrix. If invested, consider selling here, given the weight of the evidence. Initial strong resistance can be seen at $296, with additional strong resistance between $308-$312. Next level support can be seen at $268, along with the bullish support line. |
| CW Curtiss Wright Corporation ($707.45) - Aerospace Airline - Now up roughly 28% this year, CW remains a high attribute name as it continues to attack all-time highs on its default chart. After posting a bullish triangle earlier in February, this perfect 5/5'er has put in localized support nearby around $672. While technically overbought, the path of least resistance is higher. Add to/open positions here, but keep some dry powder in the event of a slight pullback. |
| DECK Deckers Outdoor Corporation ($117.50) - Textiles/Apparel - DECK broke a double top at $120 for a second buy signal as shares rallied to $122. The move penetrates the bearish resistance line, which will increase the stock to a 4 for 5'er trading in a positive trend. The stock is action in the mid $110s. Resistance lies in the mid $120s, while support lies at $112 and $97. |
| NRG NRG Energy, Inc. ($179.08) - Utilities/Electricity - NRG reversed into Xs and broke a double top at $178 for a second buy signal as shares rallied to $180, matching the stock's all-time chart high. After seeing the stock move back into a positive trend during last week's trading, the stock increased to a 3 for 5'er. Okay to consider here on the breakout or on a pullback to the mid to lower $170s. Initial support lies at $170, while the bullish support line resides at $146. |
| OLED Universal Display Corporation ($105.63) - Computers - OLED fell Friday to break a quadruple bottom at $112 before falling over 9% intraday down to $106. This also moved the stock to a negative trend, demoting it to a 0 for 5 TA rating. The weight of the technical evidence is weak and deteriorating. Long exposure should be avoided. Those with current exposure should note the stock is entering oversold territory and has further support just below at $104, setting up a potential sell-on-rally candidate. Overhead resistance may be seen initially at $134. |
| ORCL Oracle Corporation ($148.51) - Software - ORCL dropped Friday to break a double bottom at $150 before falling to $148. This marks a fourth consecutive sell signal for the 1 for 5 TA stock that has been in a negative trend since December. The weight of the technical evidence is weak and deteriorating. Further support may be seen at $136 with overhead resistance seen initially at $160. |
| SCCO Southern Copper Corporation ($201.01) - Metals Non Ferrous - SCCO returned to a buy signal Friday with a double top break at $198. The move adds to an already positive outlook as SCCO is a 5 for 5'er and ranks in the top quartile of the non-ferrous metals sector matrix. From here, support sits at $188 while overhead resistance can be found at $208. |
| VSCO Victoria's Secret & Company ($64.02) - Retailing - VSCO broke a triple top at $63 to return to a buy signal as shares rallied to $64. The stock is a 5 for 5'er that ranks within the top decile of the Retailing sector matrix. Okay to consider here on the breakout. Note the recent rally highs in the mid $60s. Initial support lies at $56, while additional resides in the $53 to $54 range. |
| Name | Option Symbol | Action | Stop Loss |
|---|---|---|---|
| Align Technology, Inc. - $190.02 | O: 26D190.00D17 | Buy the April 190.00 calls at 12.10 | 180.00 |
| Name | Option | Action |
|---|---|---|
| AFLAC Incorporated ( AFL) | Feb. 120.00 Calls | Expired at 0 |
| AFLAC Incorporated ( AFL) | Feb. 115.00 Calls | Expired at 0 |
| Name | Option Symbol | Action | Stop Loss |
|---|---|---|---|
| Airbnb, Inc. Class A - $127.28 | O: 26P130.00D17 | Buy the April 130.00 puts at 6.95 | 138.00 |
| Name | Option | Action |
|---|---|---|
| NIKE, Inc. ( NKE) | May. 62.50 Puts | Stopped at 68.00 (CP: 65.08) |
| Datadog Inc Class A ( DDOG) | Apr. 125.00 Puts | Raise the option stop loss to 13.00 (CP: 15.00) |
| Dutch Bros Inc. Class A ( BROS) | Apr. 55.00 Puts | Initiate an option stop loss of 5.20 (CP: 7.20) |
| Name | Option Sym. | Call to Sell | Call Price | Investment for 500 Shares | Annual Called Rtn. | Annual Static Rtn. | Downside Protection |
|---|---|---|---|---|---|---|---|
| Carnival Corporation $ 31.55 | O: 26D33.00D17 | Apr. 33.00 | 2.02 | $ 15,180.30 | 49.78% | 36.05% | 5.24% |
| Name | Action |
|---|---|
| Alcoa Inc. ( AA) - 59.69 | Sell the March 60.00 Calls. |
| Intel Corporation ( INTC) - 44.62 | Sell the May 49.00 Calls. |
| The Gap, Inc. ( GAP) - 28.22 | Sell the March 29.00 Calls. |
| Enphase Energy Inc ( ENPH) - 44.25 | Sell the April 50.00 Calls. |
| Target Corporation ( TGT) - 115.66 | Sell the May 115.00 Calls. |
| Delta Air Lines Inc. ( DAL) - 67.44 | Sell the April 70.00 Calls. |
| nVent Electric plc ( NVT) - 116.88 | Sell the April 115.00 Calls. |
| Freeport-McMoRan Inc. ( FCX) - 62.57 | Sell the June 65.00 Calls. |
| Name | Covered Write |
|---|---|
|
|
|
Daily Equity & Market Analysis
NDW MORNING UPDATE
Feb 20, 2026
Loading, Please Wait...
