
Most Requested Symbols


There are no changes to the ALPS Target Income Model this week. Please note that as of October 25th, this model and report will be discontinued. Over the last couple of weeks, both US and International Equities have come under some selling pressure. This is evident by the fact that much of the market has moved into oversold territory. We track the overbought and oversold characteristics of a security by calculating a security's weekly distribution using a 10-week trading band. When a security is above the middle of the band, then it's considered to be in overbought territory, and when it's below the middle, it's in oversold territory. When you aggregate this data and plot the securities on a curve, the Weekly Distribution Curve provides broader context and perspective about the overbought and oversold nature of the market. On the curve, the middle of the bell curve represents areas of the market that are "normally" distributed, with the far right being 100% overbought on a weekly distribution and the far left being 100% oversold on a weekly distribution.
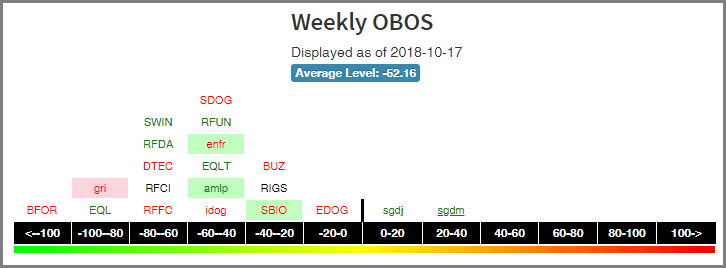
With the exception of the Sprott Junior Minors Gold ETF SGDJ and the Sprott Gold Miners ETF SGDM, all of the Alps ETFs are in oversold territory with the average level being 52.16%. Most of the Alps Funds occupy the -60 to -40% area. The most oversold fund at this time is the Barron’s 400 ETF BFOR extreme reading of -118%. The least oversold fund at this time is the SGDM with an OBOS% reading of +34%. That said, investors can use this time to work into positions, especially those that are oversold yet still possess strength and are holding up on a technical basis.

The ETFs with the most relative strength buy signals (suggesting outperformance) versus the others in the group are listed at the top. These ETFs should be overweighted in the portfolio. Those ETFs with the least amount of relative strength buy signals versus the others in the group are listed at the bottom. These ETFs should be underweighted in the portfolio.
ALPS Target Income Matrix
| Ticker | Name | Buys | Xs | Tech Attribute/ Score |
|---|---|---|---|---|
| SBIO | ALPS Medical Breakthroughs ETF | 14 | 5 | 3.97 |
| DTEC | ALPS Disruptive Technologies ETF | 13 | 6 | 4.62 |
| BFOR | Barron's 400 ETF | 11 | 8 | 4.42 |
| SWIN | ALPS-Dorsey Wright Sector Momentum ETF | 11 | 6 | 4.78 |
| BUZ | Buzz US Sentiment Leaders ETF | 9 | 12 | 5.31 |
| ENFR | Alerian Energy Infrastructure ETF | 9 | 10 | 3.02 |
| EQL | Alps Equal Sector Weight ETF | 9 | 8 | 3.03 |
| SDOG | ALPS Sector Dividend Dogs | 9 | 5 | 2.75 |
| IDOG | ALPS International Sector Dividend Dogs ETF | 6 | 2 | 1.57 |
| AMLP | Alerian MLP ETF | 5 | 11 | 2.31 |
| USCI | United States Commodity Index Fund | 5 | 9 | 2.93 |
| RIGS | Riverfront Strategic Income Fund | 3 | 7 | 0.73 |
| GRI | Cohen & Steers Global Realty Majors | 3 | 4 | 2.31 |
| EDOG | ALPS Emerging Sector Dogs ETF | 3 | 1 | 1.57 |
| SGDM | Sprott Gold Miners ETF | 2 | 14 | 1.34 |
| SGDJ | Sprott Junior Gold Miners ETF | 0 | 12 | 1.31 |
The table below is a review of important technical data on a select group of ALPS ETFs. Significant changes within the past week are highlighted in Green if positive or Red if negative. This portfolio is designed to be used as a "radar" screen to bring your attention to potentially important technical changes that may require your attention and potential action. When evaluating the Fund Score, the strongest issues have scores of 4 or higher while those ETFs with scores below a 3 are no longer considered solid citizens.
| Symbol | Name | Price | Yield (%) | Trend | RS Signal | RS Col. | 200 Day MA | Weekly Mom | OBOS (Weekly) | ||
| AMLP | Alerian MLP ETF | 10.55 | 7.82 | Positive | Sell | O | 10.55 | -7W |
|
||
| BFOR | Barron's 400 ETF | 42.33 | 0.59 | Positive | X | 43.37 | -5W |
|
|||
| BUZ | Buzz US Sentiment Leaders ETF | 36.81 | 0.39 | Positive | X | 35.62 | -3W |
|
|||
| DTEC | ALPS Disruptive Technologies ETF | 27.30 | 0.00 | Positive | X | 27.75 | -4W |
|
|||
| EDOG | ALPS Emerging Sector Dogs ETF | 20.98 | 4.05 | Positive | O | 23.34 | +2W |
|
|||
| ENFR | Alerian Energy Infrastructure ETF | 21.81 | 2.68 | Positive | Sell | O | 21.98 | -8W |
|
||
| EQL | Alps Equal Sector Weight ETF | 70.21 | 2.07 | Positive | X | 70.35 | -4W |
|
|||
| GRI | Cohen & Steers Global Realty Majors | 42.11 | 4.35 | Negative | Sell | O | 43.47 | -5W |
|
||
| IDOG | ALPS International Sector Dividend Dogs ETF | 25.90 | 4.21 | Positive | Sell | O | 27.82 | -2W |
|
||
| RIGS | Riverfront Strategic Income Fund | 24.41 | 4.45 | O | 24.61 | -5W |
|
||||
| SBIO | ALPS Medical Breakthroughs ETF | 36.46 | 1.59 | Negative | Buy | X | 36.44 | -3W |
|
||
| SDOG | ALPS Sector Dividend Dogs | 44.75 | 3.54 | Positive | O | 45.41 | -5W |
|
|||
| SGDJ | Sprott Junior Gold Miners ETF | 25.64 | 0.18 | Negative | Sell | O | 28.91 | +5W |
|
||
| SGDM | Sprott Gold Miners ETF | 16.98 | 0.70 | Negative | Sell | O | 18.76 | +5W |
|
||
| SWIN | ALPS-Dorsey Wright Sector Momentum ETF | 30.91 | 0.48 | Positive | Buy | X | 30.84 | -3W |
|
||
| USCI | United States Commodity Index Fund | 42.22 | 0.00 | Negative | O | 42.83 | +9W |
|
| Links to Additional Summaries |

The distribution curve places each ETF on a bell curve according to their respective degrees of overbought or oversold status using a 10-week distribution. ETFs that are statistically oversold will appear on the left-hand side of the bell curve, while those that have become statistically overbought will appear on the right-hand side of the bell curve. Perhaps the most useful attribute of this feature is that it displays the entire universe on the curve at one time to give us a general picture of whether the ALPS ETF universe is generally overbought on a near-term basis, or generally oversold. Our best opportunities are to buy strong relative strength ETFs that have regressed back toward mean conditions based on market weakness, or have become oversold based upon extreme market weakness. Weekly Distribution is a short-term gauge that is most helpful in timing entry and exit points, while the longer-term information of trend and relative strength is a more controlling factor in the decision of whether to buy or sell.
Legend:
The ALPS ETF Portfolio is designed to identify major themes in the market place through the use of the Point & Figure relative strength tools. For more information on the portfolio construction and back testing, see the model info file on the models page.
The average yield of the ALPS Target Income Model is (as of mm/dd/yyyy).
ALPS (Thurs.)
Loading, Please Wait...
