
Most Requested Symbols


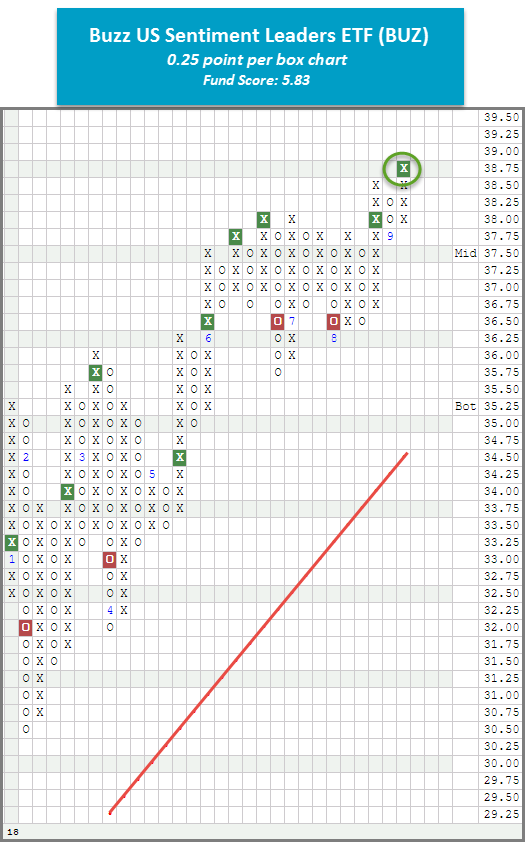
There are no changes to the ALPS ETF Model this week. The next evaluation will be Thursday, October 4th. With action last week, the more sensitive 0.25 point per box chart of the Buzz US Sentiment Leaders ETF BUZ completed a bullish catapult pattern with a move to $38.75. This is a new all-time high for the fund, as well as the second consecutive buy signal, confirming that demand is in control. BUZ has a near-perfect fund score of 5.83 with a positive score direction of 1.26, speaking to the fund’s improvement over the past six months. Additionally, monthly momentum has been positive for two months and has a price target of $42.75, both suggesting the potential for higher prices. Year-to-date, BUZ has posted an impressive gain of 21.35%, outpacing the return for the S&P 500 SPX by just over 12.50%. Overall, the weight of the evidence is positive for BUZ however, at this time, the fund is 59% overbought so those looking to initiate new positions may look to wait for a potential pullback. From here, the first sell signal comes with a move to $37.50. The bullish support line, which has been intact for over two years, lies at $34.75.

The ETFs with the most relative strength buy signals (suggesting outperformance) versus the others in the group are listed at the top. These ETFs should be overweighted in the portfolio. Those ETFs with the least amount of relative strength buy signals versus the others in the group are listed at the bottom. These ETFs should be underweighted in the portfolio.
ALPS Target Income Matrix
| Ticker | Name | Buys | Xs | Tech Attribute/ Score |
|---|---|---|---|---|
| SBIO | ALPS Medical Breakthroughs ETF | 15 | 11 | 4.66 |
| DTEC | ALPS Disruptive Technologies ETF | 13 | 14 | 5.74 |
| BFOR | Barron's 400 ETF | 11 | 11 | 4.99 |
| SWIN | ALPS/Dorsey Wright Sector Momentum ETF | 11 | 9 | 5.45 |
| BUZ | Buzz US Sentiment Leaders ETF | 9 | 14 | 5.83 |
| ENFR | Alerian Energy Infrastructure ETF | 9 | 12 | 2.94 |
| EQL | Alps Equal Sector Weight ETF | 9 | 8 | 3.36 |
| SDOG | ALPS Sector Dividend Dogs | 9 | 6 | 2.79 |
| IDOG | ALPS International Sector Dividend Dogs ETF | 6 | 3 | 1.64 |
| USCI | United States Commodity Index Fund | 5 | 4 | 2.29 |
| AMLP | Alerian MLP ETF | 4 | 13 | 1.98 |
| GRI | Cohen & Steers Global Realty Majors | 3 | 6 | 2.65 |
| RIGS | Riverfront Strategic Income Fund | 3 | 6 | 0.82 |
| EDOG | ALPS Emerging Sector Dogs ETF | 3 | 2 | 1.45 |
| SGDM | Sprott Gold Miners ETF | 2 | 1 | 0.08 |
| SGDJ | Sprott Junior Gold Miners ETF | 0 | 0 | 0.95 |
The table below is a review of important technical data on a select group of ALPS ETFs. Significant changes within the past week are highlighted in Green if positive or Red if negative. This portfolio is designed to be used as a "radar" screen to bring your attention to potentially important technical changes that may require your attention and potential action. When evaluating the Fund Score, the strongest issues have scores of 4 or higher while those ETFs with scores below a 3 are no longer considered solid citizens.
| Symbol | Name | Price | Yield (%) | Trend | RS Signal | RS Col. | 200 Day MA | Weekly Mom | OBOS (Weekly) | ||
| AMLP | Alerian MLP ETF | 10.53 | 7.83 | Positive | Sell | O | 10.55 | -4W |
|
||
| BFOR | Barron's 400 ETF | 45.02 | 0.55 | Positive | X | 43.23 | -2W |
|
|||
| BUZ | Buzz US Sentiment Leaders ETF | 38.87 | 0.37 | Positive | X | 35.22 | +5W |
|
|||
| DTEC | ALPS Disruptive Technologies ETF | 29.79 | 0.00 | Positive | X | 27.54 | -1W |
|
|||
| EDOG | ALPS Emerging Sector Dogs ETF | 21.18 | 4.01 | Positive | O | 23.65 | +2W |
|
|||
| ENFR | Alerian Energy Infrastructure ETF | 21.86 | 2.68 | Positive | Sell | O | 22.04 | -5W |
|
||
| EQL | Alps Equal Sector Weight ETF | 72.70 | 2.00 | Positive | X | 70.19 | -1W |
|
|||
| GRI | Cohen & Steers Global Realty Majors | 43.82 | 4.18 | Negative | Sell | O | 43.66 | -2W |
|
||
| IDOG | ALPS International Sector Dividend Dogs ETF | 27.01 | 4.03 | Positive | Sell | O | 27.99 | +2W |
|
||
| RIGS | Riverfront Strategic Income Fund | 24.60 | 4.42 | O | 24.66 | -2W |
|
||||
| SBIO | ALPS Medical Breakthroughs ETF | 38.67 | 1.50 | Positive | Buy | X | 36.13 | +2W |
|
||
| SDOG | ALPS Sector Dividend Dogs | 45.68 | 3.47 | Positive | O | 45.45 | -2W |
|
|||
| SGDJ | Sprott Junior Gold Miners ETF | 24.18 | 0.19 | Negative | Sell | O | 29.51 | +2W |
|
||
| SGDM | Sprott Gold Miners ETF | 15.59 | 0.77 | Negative | Sell | O | 19.06 | +2W |
|
||
| SWIN | ALPS/Dorsey Wright Sector Momentum ETF | 32.91 | 0.45 | Positive | Buy | X | 30.64 | +5W |
|
||
| USCI | United States Commodity Index Fund | 42.42 | 0.00 | Negative | O | 42.73 | +6W |
|
| Links to Additional Summaries |

The distribution curve places each ETF on a bell curve according to their respective degrees of overbought or oversold status using a 10-week distribution. ETFs that are statistically oversold will appear on the left-hand side of the bell curve, while those that have become statistically overbought will appear on the right-hand side of the bell curve. Perhaps the most useful attribute of this feature is that it displays the entire universe on the curve at one time to give us a general picture of whether the ALPS ETF universe is generally overbought on a near-term basis, or generally oversold. Our best opportunities are to buy strong relative strength ETFs that have regressed back toward mean conditions based on market weakness, or have become oversold based upon extreme market weakness. Weekly Distribution is a short-term gauge that is most helpful in timing entry and exit points, while the longer-term information of trend and relative strength is a more controlling factor in the decision of whether to buy or sell.
Legend:
The ALPS ETF Portfolio is designed to identify major themes in the market place through the use of the Point & Figure relative strength tools. For more information on the portfolio construction and back testing, see the model info file on the models page.
The average yield of the ALPS Target Income Model is (as of mm/dd/yyyy).
ALPS (Thurs.)
Loading, Please Wait...
