
Most Requested Symbols


There are no changes to be made in the ALPS Target Income Model ALPSINCOME.TR.
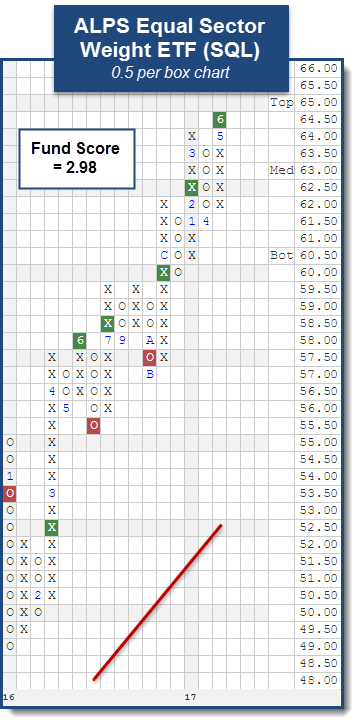
This week the ALPS Equal Sector Weight ETF EQL caught our attention. This fund seeks to own Large Capitalization equities within the 10 Select Sector SPDRs and the fund ebalances on a quarterly basis. When looking at its 0.5 per box chart, we can see a shakeout pattern began after it formed a double top at $59.50 between July and September before breaking a double bottom at $57.50 in October. The shakeout was initiated upon the reversal up into X’s following the election and was completed when EQL broke a triple top at $60. Demand continued to exhibit strength, as the ETF rallied to $62, made a higher bottom at $60 and completed a bullish catapult formation with a double top break in February at $62.50. The fund now trades at all-time highs in the mid $60’s after breaking its most recent double top on 6/2 at $64.50. The 0.5 per box chart shows a bullish price objective of $72.50 and a reward to risk ratio in excess of 2-to-1, if using $61 as a stop. EQL also comes with an attractive yield at roughly 2.70%. New positions are best served on a pullback from here with support coming at $61.50 and $60.

The ETFs with the most relative strength buy signals (suggesting outperformance) versus the others in the group are listed at the top. These ETFs should be overweighted in the portfolio. Those ETFs with the least amount of relative strength buy signals versus the others in the group are listed at the bottom. These ETFs should be underweighted in the portfolio.
ALPS Target Income Matrix
| Ticker | Name | Buys | Xs | Tech Attribute/ Score |
|---|---|---|---|---|
| AMLP | Alerian MLP ETF | 13 | 1 | 2.76 |
| ENFR | Alerian Energy Infrastructure ETF | 12 | 6 | 3.51 |
| SWIN | ALPS/Dorsey Wright Sector Momentum ETF | 10 | 15 | 5.35 |
| BFOR | Barron's 400 ETF | 8 | 16 | 4.56 |
| EQLT | Alps Workplace Equality Portfolio Fund | 8 | 16 | 5.40 |
| EQL | Alps Equal Sector Weight ETF | 8 | 10 | 2.98 |
| SDOG | ALPS Sector Dividend Dogs | 8 | 6 | 3.27 |
| BUZ | Buzz US Sentiment Leaders ETF | 6 | 16 | 3.03 |
| EDOG | ALPS Emerging Sector Dogs ETF | 6 | 12 | 3.20 |
| TOFR | USCF ETF Trust - Stock Split Index Fund | 6 | 11 | 3.91 |
| IDOG | ALPS International Sector Dividend Dogs ETF | 5 | 15 | 4.33 |
| SBIO | ALPS Medical Breakthroughs ETF | 5 | 11 | 1.94 |
| GRI | Cohen & Steers Global Realty Majors | 5 | 5 | 2.96 |
| MENU | USCF Restaurant Leaders Fund | 3 | 14 | 4.55 |
| RFFC | RiverFront Dynamic US Flex-Cap ETF | 3 | 13 | 4.66 |
| RFDA | RiverFront Dynamic US Dividend Advantage ETF | 3 | 13 | 4.54 |
| RFUN | RiverFront Dynamic Unconstrained Income ETF | 3 | 7 | 2.54 |
| RIGS | Riverfront Strategic Income Fund | 3 | 3 | 2.58 |
| RFCI | RiverFront Dynamic Core Income ETF | 2 | 5 | 0.97 |
| HVPW | US Equity High Volatility Put Write Index Fund | 2 | 0 | 1.12 |
| SGDJ | Sprott Junior Gold Miners ETF | 1 | 17 | 1.69 |
| SGDM | Sprott Gold Miners ETF | 1 | 16 | 2.28 |
The table below is a review of important technical data on a select group of ALPS ETFs. Significant changes within the past week are highlighted in Green if positive or Red if negative. This portfolio is designed to be used as a "radar" screen to bring your attention to potentially important technical changes that may require your attention and potential action. When evaluating the Fund Score, the strongest issues have scores of 4 or higher while those ETFs with scores below a 3 are no longer considered solid citizens.
| Symbol | Name | Price | Yield | Trend | RS Signal | RS Col. | 200 Day MA | Weekly Mom | OBOS (Weekly) | ||
| AMLP | Alerian MLP ETF | 11.82 | 7.78 | Positive | Sell | O | 12.54 | -6W |
|
||
| BFOR | Barron's 400 ETF | 37.67 | 0.73 | Positive | X | 34.84 | -1W |
|
|||
| BUZ | Buzz US Sentiment Leaders ETF | 28.25 | 0.62 | Positive | X | 25.97 | +5W |
|
|||
| EDOG | ALPS Emerging Sector Dogs ETF | 24.19 | 2.58 | Positive | O | 22.80 | +5W |
|
|||
| ENFR | Alerian Energy Infrastructure ETF | 22.78 | 3.03 | Positive | X | 23.43 | -21W |
|
|||
| EQL | Alps Equal Sector Weight ETF | 64.47 | 2.70 | Positive | X | 61.03 | +4W |
|
|||
| EQLT | Alps Workplace Equality Portfolio Fund | 33.14 | 1.38 | Positive | X | 30.35 | +6W |
|
|||
| GRI | Cohen & Steers Global Realty Majors | 44.79 | 2.58 | Positive | Sell | O | 43.10 | +2W |
|
||
| HVPW | US Equity High Volatility Put Write Index Fund | 19.13 | 9.31 | Positive | O | 19.50 | +3W |
|
|||
| IDOG | ALPS International Sector Dividend Dogs ETF | 27.19 | 3.35 | Positive | Sell | O | 24.51 | +5W |
|
||
| MENU | USCF Restaurant Leaders Fund | 18.50 | 0.32 | Positive | X | 17.22 | -1W |
|
|||
| RFCI | RiverFront Dynamic Core Income ETF | 24.77 | 2.08 | O | 24.72 | +9W |
|
||||
| RFDA | RiverFront Dynamic US Dividend Advantage ETF | 28.45 | 3.05 | X | 27.04 | +6W |
|
||||
| RFFC | RiverFront Dynamic US Flex-Cap ETF | 29.31 | 1.53 | X | 27.54 | +7W |
|
||||
| RFUN | RiverFront Dynamic Unconstrained Income ETF | 26.34 | 4.05 | Positive | X | 25.90 | +9W |
|
|||
| RIGS | Riverfront Strategic Income Fund | 25.37 | 4.65 | O | 25.20 | +1W |
|
||||
| SBIO | ALPS Medical Breakthroughs ETF | 25.62 | 0.00 | Positive | Sell | X | 24.84 | -4W |
|
||
| SDOG | ALPS Sector Dividend Dogs | 42.50 | 3.34 | Positive | X | 42.22 | +2W |
|
|||
| SGDJ | Sprott Junior Gold Miners ETF | 33.45 | 1.68 | Negative | Buy | O | 35.89 | +1W |
|
||
| SGDM | Sprott Gold Miners ETF | 21.18 | 0.02 | Positive | Buy | O | 21.09 | +2W |
|
||
| SWIN | ALPS/Dorsey Wright Sector Momentum ETF | 27.34 | 0.57 | Positive | Buy | X | 25.17 | +6W |
|
||
| TOFR | USCF ETF Trust - Stock Split Index Fund | 16.85 | 1.27 | Positive | X | 15.44 | +1W |
|
| Links to Additional Summaries |

The distribution curve places each ETF on a bell curve according to their respective degrees of overbought or oversold status using a 10-week distribution. ETFs that are statistically oversold will appear on the left-hand side of the bell curve, while those that have become statistically overbought will appear on the right-hand side of the bell curve. Perhaps the most useful attribute of this feature is that it displays the entire universe on the curve at one time to give us a general picture of whether the ALPS ETF universe is generally overbought on a near-term basis, or generally oversold. Our best opportunities are to buy strong relative strength ETFs that have regressed back toward mean conditions based on market weakness, or have become oversold based upon extreme market weakness. Weekly Distribution is a short-term gauge that is most helpful in timing entry and exit points, while the longer-term information of trend and relative strength is a more controlling factor in the decision of whether to buy or sell.
Legend:
The ALPS ETF Portfolio is designed to identify major themes in the market place through the use of the Point & Figure relative strength tools. For more information on the portfolio construction and back testing, see the model info file on the models page.
The average yield of the ALPS Target Income Model is 4.57% (as of 06/08/2017).
ALPS (Thurs.)
Loading, Please Wait...
