Most Requested Symbols

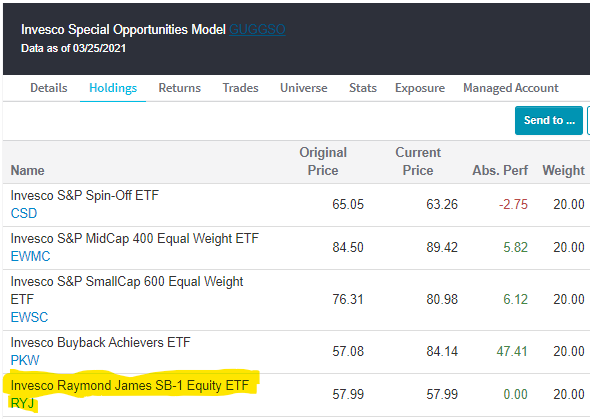
There is a change to the Invesco Special Opportunities Model GUGGSO this week. Sell the Invesco China Technology ETF CQQQ and buy the Invesco Raymond James SB-1 Equity ETF RYJ. CQQQ was removed because its rank in the model’s relative strength matrix fell below the threshold to remain a holding in the model. In place of CQQQ, the model added RYJ as it was the highest-ranking fund in the matrix that was not already a holding in the portfolio. This is the fourth change to the model this year.
RYJ tracks an index of US-listed equity securities rated Strong Buy 1 by Raymond James & Associates, Inc. RYJ currently has a strong 4.79 fund score, 1.07 points better than the average for all growth and income funds, and a positive 1.39 score direction. RYJ’s three largest sector exposures are financials (23.10%), healthcare (17.25%), and technology (14.76%).
On its default chart, RYJ has given two consecutive buy signals and reached a new all-time high earlier this month before pulling back to the middle of its trading band. Year-to-date (through 3/26) RYJ has gained 13.86% on a price return basis, while the S&P 500 SPX is up 5.82%. In addition to RYJ, GUGGSO also has exposure to spin-offs, mid cap equities, small cap equities, and buybacks. Year-to-date the model has gained 7.30%.

The distribution curve places each ETF on a bell curve according to their respective degrees of overbought or oversold status using a 10-week distribution. ETFs that are statistically oversold will appear on the left-hand side of the bell curve, while those that have become statistically overbought will appear on the right-hand side of the bell curve. Perhaps the most useful attribute of this feature is that it displays the entire universe on the curve at one time to give us a general picture of whether the Invesco ETF universe is generally overbought on a near-term basis, or generally oversold. Our best opportunities are to buy strong relative strength ETFs that have regressed back toward mean conditions based on market weakness, or have become oversold based upon extreme market weakness. Weekly Distribution is a short-term gauge that is most helpful in timing entry and exit points, while the longer-term information of trend and relative strength is a more controlling factor in the decision of whether to buy or sell.
Average Level
11.20
| <--100 | -100--80 | -80--60 | -60--40 | -40--20 | -20-0 | 0-20 | 20-40 | 40-60 | 60-80 | 80-100 | 100-> | |||
 |
||||||||||||||
Legend:
The table below is a review of important technical data on a select group of Invesco ETFs. Significant changes within the past week are highlighted in Green if positive or Red if negative. This portfolio is designed to be used as a "radar" screen to bring your attention to potentially important technical changes that may require your attention and potential action. Below this week's featured portfolio is the ability to see other Invesco portfolios including Market, Sector, International, Dynamic family, and RAFI family.
| Symbol | Name | Price | Yield (%) | PnF Trend | RS Signal | RS Col. | 200 Day MA | Weekly Mom | OBOS (Weekly) | ||
|---|---|---|---|---|---|---|---|---|---|---|---|
| ADRE | Invesco BLDRs Emerging Markets 50 ADR Index | 55.53 | 0.90 | Positive | Sell | X | 51.61 | -6W |
|
||
| PDN | Invesco FTSE RAFI Developed Markets ex-U.S. Small-Mid | 36.90 | 1.75 | Positive | Sell | O | 31.95 | +1W |
|
||
| PGJ | Invesco Golden Dragon Halter USX | 62.27 | 0.26 | Positive | Buy | O | 59.66 | -6W |
|
||
| PID | Invesco International Dividend Achievers ETF | 16.80 | 3.04 | Positive | Sell | O | 14.29 | +1W |
|
||
| PIE | Invesco DWA Emerging Markets Momentum ETF | 23.90 | 1.23 | Positive | Sell | X | 21.33 | -6W |
|
||
| PIN | Invesco India ETF | 24.56 | 0.71 | Positive | Sell | O | 21.04 | -11W |
|
||
| PIO | Invesco Global Water ETF | 36.23 | 0.89 | Positive | Sell | O | 32.98 | +1W |
|
||
| PIZ | Invesco DWA Developed Markets Momentum ETF | 34.15 | 0.38 | Positive | Sell | O | 31.70 | +1W |
|
||
| PWC | Invesco Dynamic Market ETF | 115.21 | 1.01 | Positive | O | 101.51 | -6W |
|
|||
| PXF | Invesco FTSE RAFI Developed Markets ex-U.S. ETF | 46.58 | 2.00 | Positive | Sell | O | 39.58 | -2W |
|
||
| PXH | Invesco FTSE RAFI Emerging Markets | 22.44 | 2.66 | Positive | Sell | O | 19.80 | -11W |
|

| Ticker | Name | Buys | Xs | Tech Attribute/ Score |
|---|---|---|---|---|
| XSVM | Invesco S&P SmallCap Value with Momentum ETF | 15 | 5 | 5.13 |
| XSMO | Invesco S&P SmallCap Momentum ETF | 12 | 4 | 3.70 |
| XMVM | Invesco S&P MidCap Value with Momentum ETF | 10 | 13 | 4.85 |
| XMHQ | Invesco S&P MidCap Quality ETF | 10 | 12 | 4.70 |
| QQQ | Invesco QQQ Trust | 10 | 5 | 3.95 |
| PRFZ | Invesco FTSE RAFI US 1500 Small-Mid ETF | 9 | 14 | 4.67 |
| PKW | Invesco Buyback Achievers ETF | 9 | 11 | 5.72 |
| XMMO | Invesco S&P MidCap Momentum ETF | 9 | 4 | 3.99 |
| PWB | Invesco Dynamic Large Growth | 8 | 2 | 2.76 |
| PDP | Invesco DWA Momentum ETF | 8 | 2 | 3.45 |
| PEY | Invesco High Yield Equity Dividend Achievers ETF | 6 | 9 | 3.75 |
| PRF | Invesco FTSE RAFI US 1000 ETF | 5 | 10 | 3.81 |
| PFM | Invesco Dividend Achievers ETF | 4 | 7 | 3.01 |
| DBC | Invesco DB Commodity Index Tracking | 3 | 12 | 4.89 |
| PWC | Invesco Dynamic Market ETF | 2 | 5 | 3.08 |
| PBP | Invesco S&P 500 BuyWrite | 0 | 5 | 2.66 |
m
| Market | Sector | International | Dynamic Sector | Commodity |
| ETF Name | Symbol | DWA Suggested Weighting | Yield | Date Added |
|---|---|---|---|---|
| Invesco Wilderhill Clean Energy | PBW | 14.286% | 0.4199 | 04/18/2019 |
| Invesco Dynamic Semiconductors ETF | PSI | 14.286% | 0.1818 | 12/27/2019 |
| Invesco Dynamic Building & Construction Port | PKB | 14.286% | 0.2744 | 06/26/2020 |
| Invesco Dynamic Energy Exploration & Product | PXE | 14.286% | 2.8837 | 03/05/2021 |
| Invesco Oil & Gas Services ETF | PXJ | 14.286% | 3.8725 | 03/12/2021 |
| Invesco DWA Energy Momentum ETF | PXI | 14.286% | 1.2254 | 02/26/2021 |
| Invesco Global Clean Energy ETF | PBD | 14.286% | 0.4951 | 01/08/2021 |
* - Dates prior to 1/24/2011, which is when the Invesco Sector Seven ETF Model Portfolio became available in the Invesco Weekly ETF Report, are representative of when the position was added to the backtested model.
| ETF Name | Symbol | DWA Suggested Weighting | Yield | Date Added |
|---|---|---|---|---|
| Invesco S&P SmallCap Consumer Discretionary ETF | PSCD | 33.333% | 0.4438 | 08/14/2020 |
| Invesco S&P SmallCap Energy ETF | PSCE | 33.333% | 0.6019 | 02/05/2021 |
| Invesco S&P SmallCap Materials ETF | PSCM | 33.333% | 1.4571 | 01/15/2021 |
* - Dates prior to 6/1/10, which is when the Invesco Small Cap Sector Model ETF Portfolio became available in the Invesco Weekly ETF Report, are representative of when the position was added to the backtested model.
| ETF Name | Symbol | DWA Suggested Weighting | Yield | Date Added |
|---|---|---|---|---|
| Invesco DWA SmallCap Momentum ETF | DWAS | 50.000% | 0.1843 | 08/07/2020 |
| Invesco DWA Momentum ETF | PDP | 16.667% | 0.1087 | 01/15/2016 |
| Invesco DWA Emerging Markets Momentum ETF | PIE | 16.667% | 1.2349 | 08/07/2020 |
| Invesco DWA Developed Markets Momentum ETF | PIZ | 16.667% | 0.3753 | 08/07/2020 |
* - Dates prior to 6/7/13, which is when the DWA Global Technical Leaders Portfolio became available in the Invesco Weekly ETF Report, are representative of when the position was added to the backtested model.
| ETF Name | Symbol | DWA Suggested Weighting | Yield | Date Added |
|---|---|---|---|---|
| Invesco DWA Basic Materials Momentum ETF | PYZ | 25.000% | 0.9793 | 01/29/2021 |
| Invesco DWA Consumer Cyclicals Momentum ETF | PEZ | 25.000% | 0.3296 | 05/29/2020 |
| Invesco DWA Industrials Momentum ETF | PRN | 25.000% | 0.0950 | 02/26/2021 |
| Invesco DWA Energy Momentum ETF | PXI | 25.000% | 1.2254 | 01/29/2021 |
| ETF Name | Symbol | DWA Suggested Weighting | Yield | Date Added |
|---|---|---|---|---|
| Invesco S&P Emerging Markets Low Volatility ETF | EELV | 10.500% | 2.7515 | 02/26/2021 |
| Invesco DWA SmallCap Momentum ETF | DWAS | 24.500% | 0.1843 | 02/26/2021 |
| Invesco DWA Momentum ETF | PDP | 24.500% | 0.1087 | 02/26/2021 |
| Invesco DWA Emerging Markets Momentum ETF | PIE | 4.500% | 1.2349 | 02/26/2021 |
| Invesco DWA Developed Markets Momentum ETF | PIZ | 4.500% | 0.3753 | 02/26/2021 |
| Invesco S&P International Developed Low Volatility ETF | IDLV | 10.500% | 2.3414 | 02/26/2021 |
| Invesco S&P 500 Low Volatility ETF | SPLV | 10.500% | 2.0556 | 02/26/2021 |
| Invesco S&P SmallCap Low Volatility ETF | XSLV | 10.500% | 2.2763 | 02/26/2021 |
* - Dates prior to 8/31/15, which is when the Invesco Multi Factor Global Equity Model became available in the Invesco Weekly ETF Report, are representative of when the position was added to the backtested model.
| ETF Name | Symbol | DWA Suggested Weighting | Yield | Date Added |
|---|---|---|---|---|
| Invesco DB Energy Fund | DBE | 50.000% | 0.0000 | 01/29/2021 |
| Invesco DB Oil Fund | DBO | 50.000% | 0.0000 | 11/13/2020 |
| ETF Name | Symbol | DWA Suggested Weighting | Yield | Date Added |
|---|---|---|---|---|
| Invesco S&P Spin-Off ETF | CSD | 20.000% | 0.9077 | 03/12/2021 |
| Invesco S&P MidCap 400 Equal Weight ETF | EWMC | 20.000% | 1.0568 | 02/26/2021 |
| Invesco S&P SmallCap 600 Equal Weight ETF | EWSC | 20.000% | 0.7018 | 02/12/2021 |
| Invesco Buyback Achievers ETF | PKW | 20.000% | 1.3813 | 06/12/2020 |
| Invesco Raymond James SB-1 Equity ETF | RYJ | 20.000% | 0.2548 | 03/26/2021 |
* - Dates prior to 10/14/08, which is when the Invesco Special Opportunities Model ETF Portfolio became available in the Invesco Weekly ETF Report, are representative of when the position was added to the backtested model.
| ETF Name | Symbol | DWA Suggested Weighting | Yield | Date Added |
|---|---|---|---|---|
| Invesco S&P Equal Weight Consumer Discretionary ETF | RCD | 33.333% | 0.7421 | 05/29/2020 |
| Invesco S&P Equal Weight Energy ETF | RYE | 33.333% | 2.4438 | 02/26/2021 |
| Invesco S&P Equal Weight Financials ETF | RYF | 33.333% | 2.0251 | 02/26/2021 |
* - Dates prior to 8/15/2017, which is when the Invesco Dynamic Equal Weight Sector Model became available in the Invesco Weekly ETF Report, are representative of when the position was added to the backtested model.
| Group | Symbol | Percent | |
|---|---|---|---|
| Cash | CASH$ | 0.00% | |
| Invesco S&P Mid Cap 400 Revenue ETF TR | All US Mid Cap | RWK.TR | 19.99% |
| Invesco S&P Small Cap 600 Revenue ETF TR | All US Small Cap | RWJ.TR | 40.02% |
| Invesco S&P 500 Revenue ETF TR | Growth-Domestic | RWL.TR | 19.99% |
| Invesco S&P Ultra Dividend Revenue ETF TR | Growth & Income | RDIV.TR | 20.00% |
Invesco (Mon.)
NDW MORNING UPDATE
Dec 10, 2025
Loading, Please Wait...
