Most Requested Symbols

It is no secret that Commodities as an asset class have struggled this year. Coming into 2017, the asset class was ranked second in DALI but has since fallen to fifth, falling below Cash last week. The sub-sector rankings have been changing too. Industrial Metals continue to rank first among the four sub-sectors while Precious Metals have risen from last to second place due to their improved relative strength and the weakness in Energy at the end of Q1. The PowerShares Commodity Model POWRSHARES seeks to own two of the highest relative strength ETFs out of an inventory of eight. Since Precious Metals continue to garner more relative strength (Gold in this case), the POWRSHARES Model will undergo its second change of the year. With last week's action, the PowerShares DB Commodity Index Tracking DBC fell sufficiently within the matrix rankings to warrant its removal from the portfolio. As a result. the PowerShares DB Gold Fund DGL will take its place since it is the highest ranking ETF that is not already owned.
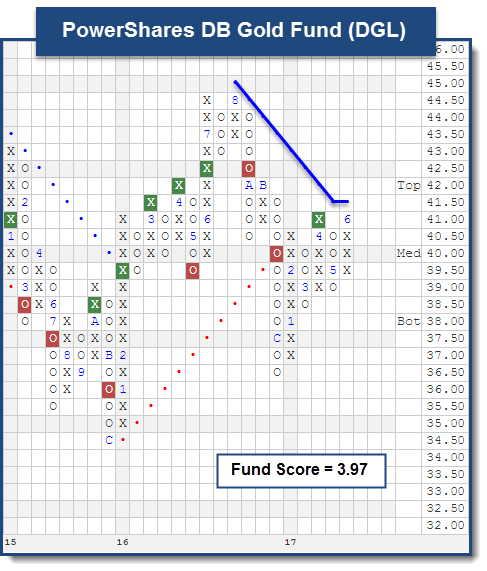
Since bottoming in December at $36.50, DGL has returned to a buy signal at $41 in April and is now currently testing its bearish resistance line. A double top break at $41.50 would flip the trend back to positive. DGL offers a fund score of 3.97, which is paired with a score direction of 2.36 speaking to its improvement over the past six months. Its high fund score tops all of its benchmarks’ average scores: Precious Metals (2.12), All US (3.52), and Commodities (1.29). In addition, its weekly momentum recently flipped positive indicating the potential for higher prices over the next several weeks. DGL comes with a bullish price objective of $46.50, which also indicates the potential for further price appreciation from current levels. All of these positive technical developments has led to DGL returning 9.40% year-to-date (through 6/9) compared to the market (S&P 500 Index SPX) up 8.62%. Those interested in gaining exposure to Gold may initiate positions at current levels. Support comes in the upper $30’s from here. For those already long, the next resistance levels are at $42 and $44.50. The Model will be rebalanced and offers exposure to Base Metals DBB (50%) and Gold DGL (50%).

The distribution curve places each ETF on a bell curve according to their respective degrees of overbought or oversold status using a 10-week distribution. ETFs that are statistically oversold will appear on the left-hand side of the bell curve, while those that have become statistically overbought will appear on the right-hand side of the bell curve. Perhaps the most useful attribute of this feature is that it displays the entire universe on the curve at one time to give us a general picture of whether the PowerShares ETF universe is generally overbought on a near-term basis, or generally oversold. Our best opportunities are to buy strong relative strength ETFs that have regressed back toward mean conditions based on market weakness, or have become oversold based upon extreme market weakness. Weekly Distribution is a short-term gauge that is most helpful in timing entry and exit points, while the longer-term information of trend and relative strength is a more controlling factor in the decision of whether to buy or sell.
The average Bullish Percent reading this week is 57.65% up 0.89% from the previous week
| <--100 | -100--80 | -80--60 | -60--40 | -40--20 | -20-0 | 0-20 | 20-40 | 40-60 | 60-80 | 80-100 | 100-> | |||
 |
||||||||||||||
Legend:
The table below is a review of important technical data on a select group of PowerShares ETFs. Significant changes within the past week are highlighted in Green if positive or Red if negative. This portfolio is designed to be used as a "radar" screen to bring your attention to potentially important technical changes that may require your attention and potential action. Below this week's featured portfolio is the ability to see other PowerShares portfolios including Market, Sector, International, Dynamic family, and RAFI family.
| Symbol | Name | Price | Yield | Trend | RS Signal | RS Col. | 200 Day MA | Weekly Mom | OBOS (Weekly) | ||
| ADRA | PowerShares BLDRs Asia 50 ADR Index Fund | 31.35 | 1.88 | Positive | Sell | O | 28.24 | +6W |
|
||
| ADRD | PowerShares BLDRs Developed Markets 100 ADR Index | 22.21 | 3.30 | Positive | Sell | O | 20.53 | -1W |
|
||
| ADRE | PowerShares BLDRs Emerging Markets 50 ADR Index | 38.72 | 1.47 | Positive | Sell | O | 35.36 | -1W |
|
||
| ADRU | PowerShares BLDRs Europe 100 ADR Index Fund | 21.82 | 3.54 | Positive | Sell | O | 19.92 | -2W |
|
||
| PAF | PowerShares FTSE RAFI Asia Pacific ex-Japan Portfolio | 54.88 | 3.08 | Positive | Sell | O | 50.65 | -1W |
|
||
| PDN | PowerShares FTSE RAFI Developed Markets ex-U.S. Small-Mid | 31.34 | 1.92 | Positive | Sell | O | 28.35 | -1W |
|
||
| PGJ | PowerShares Golden Dragon Halter USX | 38.46 | 1.44 | Positive | Sell | X | 33.05 | -1W |
|
||
| PID | PowerShares International Dividend Achievers Portfolio | 15.32 | 3.70 | Positive | Sell | O | 14.72 | -1W |
|
||
| PIE | PowerShares DWA Emerging Markets Momentum Portfolio | 17.25 | 1.27 | Positive | Sell | O | 16.01 | +6W |
|
||
| PIN | PowerShares India Portfolio | 23.23 | 0.91 | Positive | Sell | O | 21.21 | -9W |
|
||
| PIO | PowerShares Global Water Portfolio | 23.90 | 1.26 | Positive | Sell | O | 21.97 | -2W |
|
||
| PIZ | PowerShares DWA Developed Markets Momentum Portfolio | 25.75 | 1.83 | Positive | Sell | O | 22.98 | -2W |
|
||
| PWC | PowerShares Dynamic Market Portfolio | 86.22 | 0.95 | Positive | X | 80.10 | +6W |
|
|||
| PXF | PowerShares FTSE RAFI Developed Markets ex-U.S. Portfolio | 42.27 | 2.71 | Positive | Sell | O | 38.59 | -2W |
|
||
| PXH | PowerShares FTSE RAFI Emerging Markets | 19.92 | 1.81 | Positive | Sell | X | 19.05 | -2W |
|
||
| PXR | PowerShares Emerging Markets Infrastructure | 34.64 | 1.18 | Positive | Sell | O | 33.04 | +2W |
|
| Links to Additional Summaries |

| Ticker | Name | Buys | Xs | Tech Attribute/ Score |
|---|---|---|---|---|
| QQQ | PowerShares QQQ Trust | 18 | 17 | 5.74 |
| PWB | PowerShares Dynamic Large Growth | 15 | 12 | 3.37 |
| PKW | PowerShares Buyback Achievers Portfolio | 14 | 8 | 4.80 |
| PXSV | PowerShares Russell 2000 Pure Value Portfolio | 13 | 6 | 3.26 |
| PDP | PowerShares DWA Momentum Portfolio | 12 | 7 | 3.15 |
| PXMV | PowerShares Russell Midcap Pure Value Portfolio | 12 | 6 | 4.33 |
| DWAQ | PowerShares DWA NASDAQ Momentum Portfolio | 11 | 16 | 5.73 |
| PRFZ | FTSE RAFI US 1500 Small-Mid Portfolio | 11 | 11 | 5.26 |
| PEY | PowerShares High Yield Equity Dividend Achievers Portfolio | 11 | 9 | 3.79 |
| PRF | PowerShares FTSE RAFI US 1000 Portfolio | 10 | 7 | 2.89 |
| PWC | PowerShares Dynamic Market Portfolio | 7 | 11 | 4.34 |
| EQWM | PowerShares Russell Midcap Equal Weight Portfolio | 7 | 8 | 2.76 |
| PFM | PowerShares Dividend Achievers Portfolio | 6 | 7 | 3.83 |
| PZI | PowerShares Zacks Micro Cap Portfolio | 6 | 2 | 2.86 |
| PXSG | PowerShares Fundamental Pure Small Growth Portfolio | 4 | 16 | 4.72 |
| PXMG | PowerShares Russell Midcap Pure Growth Portfolio | 4 | 15 | 4.77 |
| EQWS | PowerShares Russell 2000 Equal Weight Portfolio | 4 | 9 | 4.12 |
| PBP | PowerShares S&P 500 BuyWrite | 1 | 4 | 2.90 |
| DBC | PowerShares DB Commodity Index Tracking | 0 | 0 | 0.33 |
| Market | Sector | International | Dynamic Sector | Commodity |
| ETF Name | Symbol | DWA Suggested Weighting | Yield | Date Added |
|---|---|---|---|---|
| PowerShares Dynamic Media Portfolio | PBS | 14.286% | 0.1520 | 06/28/2013 |
| PowerShares Dynamic Semiconductors Portfolio | PSI | 14.286% | 0.5390 | 03/13/2015 |
| PowerShares Dynamic Software Portfolio | PSJ | 14.286% | 0.0260 | 10/09/2015 |
| PowerShares Dynamic Building & Construction Port | PKB | 14.286% | 0.2950 | 09/02/2016 |
| PowerShares Aerospace & Defense Portfoli | PPA | 14.286% | 1.4080 | 05/09/2014 |
| PowerShares Nasdaq Internet ETF | PNQI | 14.286% | 0.0000 | 01/08/2016 |
| PowerShares KBW Property & Casualty Insurance ETF | KBWP | 14.286% | 1.9490 | 08/26/2016 |
* - Dates prior to 1/24/2011, which is when the PowerShares Sector Seven ETF Model Portfolio became available in the PowerShares Weekly ETF Report, are representative of when the position was added to the backtested model.
* - Dates prior to 6/1/10, which is when the PowerShares Small Cap Sector Model ETF Portfolio became available in the PowerShares Weekly ETF Report, are representative of when the position was added to the backtested model.
| ETF Name | Symbol | DWA Suggested Weighting | Yield | Date Added |
|---|---|---|---|---|
| PowerShares DWA SmallCap Momentum Portfolio | DWAS | 16.667% | 0.4680 | 02/17/2017 |
| PowerShares DWA Momentum Portfolio | PDP | 50.000% | 0.7210 | 01/15/2016 |
| PowerShares DWA Emerging Markets Momentum Portfolio | PIE | 16.667% | 1.2680 | 05/19/2017 |
| PowerShares DWA Developed Markets Momentum Portfolio | PIZ | 16.667% | 1.8330 | 05/05/2017 |
* - Dates prior to 6/7/13, which is when the DWA Global Technical Leaders Portfolio became available in the PowerShares Weekly ETF Report, are representative of when the position was added to the backtested model.
| ETF Name | Symbol | DWA Suggested Weighting | Yield | Date Added |
|---|---|---|---|---|
| PowerShares DWA Consumer Cyclicals Momentum Portfolio | PEZ | 25.000% | 0.7680 | 06/02/2017 |
| PowerShares DWA Financial Momentum Portfolio | PFI | 25.000% | 2.1090 | 12/02/2016 |
| PowerShares DWA Industrials Momentum Portfolio | PRN | 25.000% | 0.5300 | 11/04/2016 |
| PowerShares DWA Technology Momentum Portfolio | PTF | 25.000% | 0.2210 | 10/02/2015 |
| ETF Name | Symbol | DWA Suggested Weighting | Yield | Date Added |
|---|---|---|---|---|
| PowerShares S&P Emerging Markets Low Volatility Portfolio | EELV | 4.500% | 2.1580 | 02/03/2017 |
| PowerShares DWA SmallCap Momentum Portfolio | DWAS | 24.500% | 0.4680 | 02/03/2017 |
| PowerShares DWA Momentum Portfolio | PDP | 24.500% | 0.7210 | 02/03/2017 |
| PowerShares DWA Emerging Markets Momentum Portfolio | PIE | 10.500% | 1.2680 | 02/03/2017 |
| PowerShares DWA Developed Markets Momentum Portfolio | PIZ | 10.500% | 1.8330 | 02/03/2017 |
| PowerShares S&P International Developed Low Volatility Portf | IDLV | 4.500% | 3.3820 | 02/03/2017 |
| PowerShares S&P 500 Low Volatility Portfolio | SPLV | 10.500% | 1.9550 | 02/03/2017 |
| PowerShares S&P SmallCap Low Volatility Portfolio | XSLV | 10.500% | 1.7940 | 02/03/2017 |
* - Dates prior to 8/31/15, which is when the PowerShares Multi Factor Global Equity Model became available in the PowerShares Weekly ETF Report, are representative of when the position was added to the backtested model.
Invesco (Mon.)
Loading, Please Wait...
