Most Requested Symbols


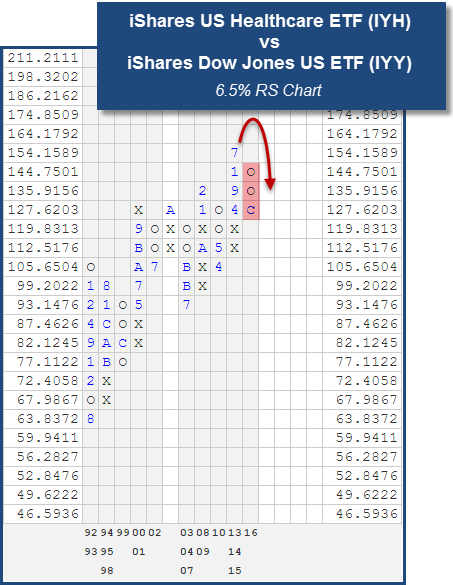
Today there is a change within the iShares Sector Rotation Model. The buy and sell decisions within this portfolio are determined based on individual RS charts for each of the members in the potential universe versus the iShares Dow Jones US ETF IYY. Over the course of the past week, there has been enough of a price dispersion between the iShares U.S. Healthcare ETF IYH and the IYY to cause a reversal down in to O's on the RS chart. This reversal tells us that IYH is weakening relative to the broad market and as a result, we have sold the IYH out of the portfolio. The IYH was previously added to the model back on January 7th of 2015. While it was a leader within that portfolio during different times of its holding period, it ultimately contributed a loss of -3.34 while in the portfolio. Fortunately, the model still managed to beat both the IYY and the SPX, rallying 11.73 versus 10.63% and 10.82%, respectively (from 1/7/15-12/7/16). As a result of this change, the model has rid itself of all healthcare exposure, as it sold out of Biotech IBB earlier in the year. Additionally, each of the remaining 10 positions will be rebalanced to 10% each to reflect an equally weighted portfolio.

The distribution curve places each ETF on a bell curve according to their respective degrees of overbought or oversold status using a 10-week distribution. ETFs that are statistically oversold will appear on the left-hand side of the bell curve, while those that have become statistically overbought will appear on the right-hand side of the bell curve. Perhaps the most useful attribute of this feature is that it displays the entire universe on the curve at one time with an "average level" to give us a general picture of whether the iShare ETF universe is generally overbought on a near-term basis, or generally oversold. Our best opportunities are to buy strong market ETFs that have regressed back toward mean conditions based on market weakness, or have become oversold based upon extreme market weakness.
Weekly Distribution is a short-term gauge that is most helpful in timing entry and exit points, while the longer-term information of trend and relative strength is a more controlling factor in the decision of whether to buy or sell. The Distribution Curve below displays those ETFs with positive RS in uppercase letters and those ETFs with poor RS versus the market in lowercase letters. As well, those ETFs that are on a Point & Figure Buy signal appear in Green letters, while those on Sell signals can appear in Red letters.
The average Bullish Percent reading this week is 58.38% up 1.27% from the previous week
| <--100 | -100--80 | -80--60 | -60--40 | -40--20 | -20-0 | 0-20 | 20-40 | 40-60 | 60-80 | 80-100 | 100-> | |||
 |
||||||||||||||
This section of the report categorizes select iShares ETFs by their respective broad group. Along with each group, you can view the Average Group Score, which is an average of the scores of all funds represented in that particular group. Those iShares ETFs that meet or exceed the Average Group Score will be highlighted in green in order to easily view those ETFs that have superior strength within their respective group. You want to focus on those ETFs that exhibit superior strength when looking to add new exposure to a particular group.
| Small Cap Funds | Symbol | Name | Score |
|---|---|---|---|
| Average Group Score: 4.2 | IJS | iShares S&P SmallCap 600 Value ETF | 5.84 |
| IJR | iShares S&P SmallCap 600 Index Fund | 5.71 | |
| IJT | iShares S&P SmallCap 600 Growth ETF | 5.59 | |
| IWN | iShares Russell 2000 Value ETF | 4.81 | |
| IWM | iShares Russell 2000 ETF | 4.41 | |
| IWO | iShares Russell 2000 Growth ETF | 3.27 |
| Sector Funds | Symbol | Name | Score |
|---|---|---|---|
| Average Group Score: 3.3 | SOXX | iShares PHLX Semiconductor ETF | 5.93 |
| IAI | iShares U.S. Broker Dealers & Securities Exchanges ETF | 5.80 | |
| IAI | iShares U.S. Broker Dealers & Securities Exchanges ETF | 5.80 | |
| IEZ | iShares U.S. Oil Equip. & Svcs. ETF | 5.76 | |
| ITA | iShares U.S. Aerospace & Defense ETF | 5.74 | |
| IGN | iShares North American Tech-Multimedia Networking ETF | 5.72 | |
| IAT | iShares U.S. Regional Banks ETF | 5.72 | |
| IEO | iShares U.S. Oil & Gas Exploration & Production ETF | 5.64 | |
| IYC | iShares U.S. Consumer Services ETF | 5.21 | |
| IGV | iShares North American Tech-Software ETF | 4.82 | |
| IYT | iShares U.S. Transportation ETF | 4.71 | |
| IGE | iShares North American Natural Resources ETF | 4.66 | |
| IYE | iShares U.S. Energy ETF | 4.61 | |
| IYM | iShares U.S. Basic Materials ETF | 4.50 | |
| IAK | iShares U.S. Insurance ETF | 4.46 | |
| IYW | iShares U.S. Tech. ETF | 4.36 | |
| IHI | iShares U.S. Medical Devices ETF | 3.83 | |
| IYJ | iShares U.S. Industrial ETF | 3.81 | |
| IYF | iShares U.S. Financial ETF | 3.65 | |
| ITB | iShares U.S. Home Construction ETF | 3.25 | |
| IYZ | iShares U.S. Telecom ETF | 3.03 | |
| ICF | iShares Cohen & Steers Realty ETF | 2.89 | |
| IHF | iShares U.S. Healthcare Providers ETF | 2.50 | |
| IYH | iShares U.S. Healthcare ETF | 2.47 | |
| IYK | iShares U.S. Consumer Goods ETF | 2.15 | |
| IDU | iShares U.S. Utilities ETF | 1.84 | |
| IBB | iShares NASDAQ Biotech ETF | 1.66 | |
| IHE | iShares U.S. Pharmaceuticals ETF | 1.20 |
| Mid Cap Funds | Symbol | Name | Score |
|---|---|---|---|
| Average Group Score: 3.3 | IJJ | iShares S&P MidCap 400 Value ETF | 5.83 |
| IJH | iShares S&P MidCap 400 Index Fund | 4.83 | |
| IWS | iShares Russell Midcap Value ETF | 4.73 | |
| IJK | iShares S&P MidCap 400 Growth ETF | 4.56 | |
| IWR | iShares Russell Midcap ETF | 4.52 | |
| IWP | iShares Russell Midcap Growth ETF | 4.09 |
| Large Cap Funds | Symbol | Name | Score |
|---|---|---|---|
| Average Group Score: 3.2 | IWY | iShares Russell Top 200 Growth ETF | 3.85 |
| IVE | iShares S&P 500 Value ETF | 3.78 | |
| IVW | iShares S&P 500 Growth ETF | 3.70 | |
| IWD | iShares Russell 1000 Value ETF | 3.68 | |
| IWB | iShares Russell 1000 ETF | 3.60 | |
| IWX | iShares Russell Top 200 Value ETF | 3.56 | |
| IYY | iShares Dow Jones U.S. ETF | 3.49 | |
| IWL | iShares Russell Top 200 ETF | 3.42 | |
| OEF | iShares S&P 100 ETF | 3.41 | |
| IVV | iShares S&P 500 Index | 3.34 |
| Global Funds | Symbol | Name | Score |
|---|---|---|---|
| Average Group Score: 2.8 | ILF | iShares S&P Latin America 40 ETF | 4.29 |
| JPXN | iShares JPX-Nikkei 400 ETF | 3.69 | |
| EPP | iShares MSCI Pacific ex-Japan Index Fund | 3.53 | |
| BKF | iShares MSCI BRIC ETF | 3.04 | |
| EEM | iShares MSCI Emerging Markets ETF | 3.00 | |
| EFA | iShares MSCI EAFE ETF | 2.45 | |
| IEV | iShares Europe ETF | 1.94 |

Weekly Updates:
| ETF Name | Symbol | DWA Suggested Weighting | Date Added |
|---|---|---|---|
| iShares Cohen & Steers Realty ETF | ICF | 10.000% | 01/07/2015 |
| iShares North American Natural Resources ETF | IGE | 10.000% | 05/04/2016 |
| iShares S&P GSTI (TM) Technology ETF | IGM | 10.000% | 01/07/2015 |
| iShares North American Tech-Software ETF | IGV | 10.000% | 01/07/2015 |
| iShares U.S. Consumer Services ETF | IYC | 10.000% | 01/07/2015 |
| iShares Dow Jones U.S. Financial Service ETF | IYG | 10.000% | 01/07/2015 |
| iShares U.S. Industrial ETF | IYJ | 10.000% | 01/07/2015 |
| iShares U.S. Consumer Goods ETF | IYK | 10.000% | 01/07/2015 |
| iShares U.S. Tech. ETF | IYW | 10.000% | 01/07/2015 |
| iShares PHLX Semiconductor ETF | SOXX | 10.000% | 01/07/2015 |
| ETF Name | Symbol | DWA Suggested Weighting | Date Added |
|---|---|---|---|
| iShares North American Tech-Software ETF | IGV | 16.667% | 10/19/2016 |
| iShares U.S. Consumer Services ETF | IYC | 16.667% | 03/13/2013 |
| iShares U.S. Tech. ETF | IYW | 16.667% | 11/02/2016 |
| iShares U.S. Medical Devices ETF | IHI | 16.667% | 09/21/2016 |
| iShares U.S. Aerospace & Defense ETF | ITA | 16.667% | 10/16/2013 |
| iShares PHLX Semiconductor ETF | SOXX | 16.667% | 10/05/2016 |
| ETF Name | Symbol | DWA Suggested Weighting | Date Added |
|---|---|---|---|
| iShares North American Tech-Software ETF | IGV | 12.500% | 01/27/2016 |
| iShares S&P SmallCap 600 Index Fund | IJR | 12.500% | 06/19/2013 |
| iShares U.S. Consumer Services ETF | IYC | 12.500% | 04/29/2010 |
| iShares U.S. Medical Devices ETF | IHI | 12.500% | 01/20/2016 |
| iShares U.S. Insurance ETF | IAK | 12.500% | 11/16/2016 |
| iShares U.S. Regional Banks ETF | IAT | 12.500% | 11/16/2016 |
| iShares U.S. Aerospace & Defense ETF | ITA | 12.500% | 08/14/2013 |
| iShares PHLX Semiconductor ETF | SOXX | 12.500% | 10/05/2016 |
| ETF Name | Symbol | DWA Suggested Weighting | Date Added |
|---|---|---|---|
| iShares MSCI Germany ETF | EWG | 16.667% | 02/18/2015 |
| iShares MSCI Belgium ETF | EWK | 16.667% | 06/24/2015 |
| iShares MSCI Switzerland ETF | EWL | 16.667% | 02/18/2015 |
| iShares MSCI Netherlands ETF | EWN | 16.667% | 02/18/2015 |
| iShares MSCI Israel Capped ETF | EIS | 16.667% | 01/27/2016 |
| iShares MSCI Ireland Capped Investable Market ETF | EIRL | 16.667% | 02/18/2015 |
| ETF Name | Symbol | DWA Suggested Weighting | Date Added |
|---|---|---|---|
| iShares MSCI Brazil ETF | EWZ | 20.000% | 07/20/2016 |
| iShares MSCI All Peru Capped Index Fund | EPU | 20.000% | 06/29/2016 |
| iShares MSCI Indonesia Investable Market ETF | EIDO | 20.000% | 03/02/2016 |
| iShares MSCI New Zealand Investable Market ETF | ENZL | 20.000% | 08/03/2016 |
| iShares Dow Jones U.S. ETF | IYY | 20.000% | 02/29/2012 |
| ETF Name | Symbol | DWA Suggested Weighting | Date Added |
|---|---|---|---|
| iShares MSCI Taiwan Capped ETF | EWT | 16.667% | 02/18/2015 |
| iShares MSCI Brazil ETF | EWZ | 16.667% | 10/19/2016 |
| iShares MSCI All Peru Capped Index Fund | EPU | 16.667% | 05/18/2016 |
| iShares MSCI Russia Capped ETF | ERUS | 16.667% | 07/15/2015 |
| iShares MSCI Emerging Markets Asia ETF | EEMA | 16.667% | 02/18/2015 |
| iShares S&P Latin America 40 ETF | ILF | 16.667% | 11/23/2016 |
The iShares Sector Rotation ETF Portfolio ISHRSECT is designed to identify major sector themes in the market place through the use of the Point & Figure relative strength tools. The portfolio's composition is based on relative strength and is applied by comparing the iShares inventory components to one another by means of point & figure relative strength analysis. The relative strength analysis is then aggregated using a relative strength "matrix" ranking process, and the number of holdings are then based on the highest realtive strength components within the inventory of holdings. For more information on the portfolio construction and back testing, click here. The iShares Sector Rotation Portfolio will be updated Thursday mornings by 9:30 am EST.
The iShares Tactical ETF Portfolio ISHRTACTICAL is designed to identify major asset class and sector themes in the market place through the use of the Point & Figure relative strength tools. The portfolio's inventory draws primarily on sub-sector iShares, some asset class ETFs, and some commodity based iShares. Relative strength is compared not only to the market indices but also to the other iShares in the inventory. This model will also incorporate the use of fixed income ETFs to help mitigate risk in the portfolio. For more information on the portfolio construction and returns since the inception in 2002, click here. The iShares Tactical Portfolio will be updated Thursday mornings by 9:30 am EST.
The iShares International Model ISHRINTL is designed to identify themes within the international equity asset class, in terms of country and region strength. The portfolio's inventory is made up of approximately 45 International iShares ETFs. We implement the relative strength matrix metholodology as the rules-based decision making strategy for buy and sell decisions within the model. For more information on portfolio construction and performance, you can visit the model's information file attached here.
The iShares Developed Market Model ISHRDEV is designed to identify themes within the developed market space, in terms of country strength. The portfolio's inventory is made up of approximately 27 developed market iShares ETFs. We implement the relative strength matrix metholodology as the rules-based decision making strategy for buy and sell decisions within the model. For more information on portfolio construction and performance, you can visit the model's information file attached here.
The iShares Emerging Market Model ISHREMERG is designed to identify themes within the emerging market space, in terms of country strength. The portfolio's inventory is made up of approximately 27 emerging market iShares ETFs. We implement the relative strength matrix metholodology as the rules-based decision making strategy for buy and sell decisions within the model. For more information on portfolio construction and performance, you can visit the model's information file attached here.
Be sure to check out the iShares DALI Organizer Tool which shows you which asset classes are emphasized in DALI and then provides you with at least one model per all asset classes. In addition, from this one link you can input a dollar amount and then allocate that money across the different models. The iShares DALI Organizer Tool will then automatically calculate exactly how many shares to buy and exactly what percentage that position represents in a portfolio. You can then export this information to excel to potentially interact with your trading system.
iShares (Thurs.)
Loading, Please Wait...
