Most Requested Symbols


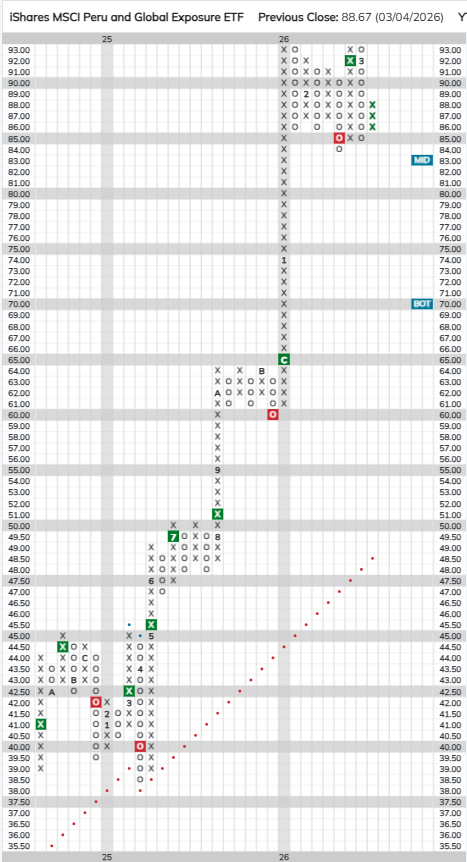
There are no changes to any of the iShares models this week. As we have previously discussed, international equities now rank first in the DALI asset class rankings after overtaking domestic equities last month. Over the last week, many international equity ETFs have pulled back as the dollar strengthened in response to the Middle East conflict, offering a potential buying opportunity for investors looking to increase their international exposure. One such fund is the iShares MSCI Peru and Global Exposure (EPU). EPU currently has a near-perfect 5.96 fund score which is 1.33 points better than the average for all non-US equity funds, and a positive 0.60 score direction. In addition to its strong fund score, EPU currently ranks first out of 46 names in the World ETF Matrix.
After briefly falling to a sell signal on its default chart, EPU returned to a buy signal last week when it broke a double top at $92 and continued higher to $95, matching the all-time high it reached in January. In this week’s trading, EPU pulled back to $85, just above its February low, before reversing up into a column of Xs in Wednesday’s (3/4) trading. Year-to-date (through 3/4) EPU has gained 22.56% on a price return basis; the fund also carries a 1.26% yield.

This section of the report categorizes select iShares Fixed Income and Currency ETPs by their respective fund groups. Along with each group, you can view the Average Group Score, which is an average of the scores of all funds represented in that particular group. Those iShares ETFs that meet or exceed the Average Group Score will be highlighted in green in order to easily view those ETFs that have superior strength within their respective group. You want to focus on those ETFs that exhibit superior strength when looking to add new exposure to a particular group.
Global Fixed Income
Symbol
Name
Score
Average Group Score: 3.4
EMB
iShares JP Morgan USD Emerging Markets Bond ETF
2.87
IGOV
iShares S&P Citigroup International Treasury Bond ETF
2.76
ISHG
iShares S&P Citigroup 1-3 Year Intl. Treas. Bond ETF
2.75
Municipal Bonds
Symbol
Name
Score
Average Group Score: 2.9
MUB
iShares National Municipal Bond ETF
2.82
NYF
iShares New York Muni Bond ETF
2.74
CMF
iShares California Municipal Bond ETF
2.59
SUB
iShares Short-Term National Muni Bond ETF
2.55
Inflation Protection Bonds
Symbol
Name
Score
Average Group Score: 2.9
STIP
iShares Barclays 0-5 Year TIPS Bond ETF
2.24
TIP
iShares Barclays US Treasury Inflation Protected Securities
1.46
High Yield
Symbol
Name
Score
Average Group Score: 2.8
HYG
iShares iBoxx $ High Yield Corporate Bond ETF
2.27
PFF
iShares Preferred & Income Securities ETF
1.67
Broad Fixed Income
Symbol
Name
Score
Average Group Score: 2.8
MBB
iShares Barclays MBS Fixed-Rate Bond ETF
2.98
IGIB
iShares Investment Grade Systematic Bond ETF
2.87
AGG
iShares US Core Bond ETF
2.76
USIG
iShares Broad USD Investment Grade Corporate Bond ETF
2.52
IGLB
iShares 10+ Year Investment Grade Corporate Bond ETF
2.41
Corporate Bonds
Symbol
Name
Score
Average Group Score: 2.7
LQD
iShares iBoxx $ Investment Grade Corp. Bond ETF
2.74
IGSB
iShares Trust iShares 1-5 Year Investment Grade Corporate Bond ETF
2.42
FLOT
iShares Floating Rate Note ETF
2.10
Agency Bonds
Symbol
Name
Score
Average Group Score: 2.6
AGZ
iShares Barclays Agency Bond ETF
1.42
Treasury Bonds
Symbol
Name
Score
Average Group Score: 2.6
TLH
iShares Barclays 10-20 Year Treasury Bond ETF
3.10
TLT
iShares Barclays 20+ Year Treasury Bond ETF
2.91
IEI
iShares Barclays 3-7 Year Treasury Bond ETF
2.81
IEF
iShares Barclays 7-10 Year Tres. Bond ETF
2.72
SHY
iShares Barclays 1-3 Year Tres. Bond ETF
2.21
GBF
iShares Barclays Government Credit Bond ETF
1.83
GVI
iShares Barclays Intermediate Government/Credit Bond ETF
1.83
The distribution curve places each ETF on a bell curve according to their respective degrees of overbought or oversold status using a 10-week distribution. ETFs that are statistically oversold will appear on the left-hand side of the bell curve, while those that have become statistically overbought will appear on the right-hand side of the bell curve. Perhaps the most useful attribute of this feature is that it displays the entire universe on the curve at one time with an "average level" to give us a general picture of whether the iShare ETF universe is generally overbought on a near-term basis, or generally oversold. Our best opportunities are to buy strong market ETFs that have regressed back toward mean conditions based on market weakness, or have become oversold based upon extreme market weakness.
Weekly Distribution is a short-term gauge that is most helpful in timing entry and exit points, while the longer-term information of trend and relative strength is a more controlling factor in the decision of whether to buy or sell. The Distribution Curve below displays those ETFs with positive RS in uppercase letters and those ETFs with poor RS versus the market in lowercase letters. As well, those ETFs that are on a Point & Figure Buy signal appear in Green letters, while those on Sell signals can appear in Red letters. Box Color indicates the Sector Status Rating. Green = Favored, Yellow = Average, and Red = Unfavored.
Average Level
17.11
| < - -100 | -100 - -80 | -80 - -60 | -60 - -40 | -40 - -20 | -20 - 0 | 0 - 20 | 20 - 40 | 40 - 60 | 60 - 80 | 80 - 100 | 100 - > |
|---|---|---|---|---|---|---|---|---|---|---|---|
|
Buy signalEWJ
|
|||||||||||
|
Buy signalitb
|
Sell signalEWZ
|
||||||||||
|
Sell signalIYC
|
Buy signalTUR
|
Buy signalEWT
|
|||||||||
|
Buy signalwood
|
Buy signalixj
|
Buy signalefa
|
Buy signalthd
|
||||||||
|
Buy signalEZU
|
Buy signalewk
|
Sell signalEZA
|
Buy signalijr
|
Buy signalIYJ
|
|||||||
|
Buy signalewq
|
Buy signaleems
|
Sell signalIXP
|
Buy signalIJH
|
Buy signaliyt
|
|||||||
|
Sell signalihf
|
Sell signalSLV
|
Buy signalEEM
|
Buy signalewl
|
Buy signalIAU
|
Buy signaljxi
|
||||||
|
Buy signalEWO
|
Buy signalIYY
|
Sell signalSOXX
|
Buy signalEWD
|
Buy signalEWC
|
Buy signalIGE
|
||||||
|
Buy signaligv
|
Buy signalEWI
|
Buy signalIVV
|
Buy signalewm
|
Sell signalilf
|
Buy signalEWU
|
Buy signalkxi
|
Buy signalEIS
|
Buy signaligf
|
|||
|
Sell signalRXI
|
Buy signalEWG
|
Buy signalEWS
|
Buy signalewn
|
Sell signalICLN
|
Buy signalEWH
|
Buy signalepp
|
Sell signaliym
|
Buy signalewa
|
Buy signalIXC
|
||
|
Sell signalindy
|
Sell signalIYG
|
Buy signalixg
|
Buy signalIAT
|
Buy signaliev
|
Buy signalenzl
|
Sell signaleww
|
Buy signalmxi
|
Buy signaliyk
|
Buy signalIEZ
|
Buy signalIEO
|
|
|
Sell signalbkf
|
Sell signalECH
|
Sell signalihi
|
Buy signalEWP
|
Buy signalIXN
|
Buy signalIAK
|
Buy signalIHE
|
Buy signalITA
|
Buy signalEWY
|
Buy signalicf
|
Buy signalGSG
|
|
|
Sell signaleido
|
Sell signalfxi
|
Sell signalEUFN
|
Sell signalIAI
|
Sell signalEPOL
|
Buy signalIBB
|
Buy signalemif
|
Buy signalEPU
|
Buy signaldvy
|
Buy signalexi
|
Buy signalIDU
|
Buy signaliyz
|
| < - -100 | -100 - -80 | -80 - -60 | -60 - -40 | -40 - -20 | -20 - 0 | 0 - 20 | 20 - 40 | 40 - 60 | 60 - 80 | 80 - 100 | 100 - > |

This section of the report categorizes select iShares ETFs by their respective broad group. Along with each group, you can view the Average Group Score, which is an average of the scores of all funds represented in that particular group. Those iShares ETFs that meet or exceed the Average Group Score will be highlighted in green in order to easily view those ETFs that have superior strength within their respective group. You want to focus on those ETFs that exhibit superior strength when looking to add new exposure to a particular group.
| Small Cap Funds | Symbol | Name | Score |
|---|---|---|---|
| Average Group Score: 4.1 | IWO | iShares Russell 2000 Growth ETF | 4.95 |
| IWN | iShares Russell 2000 Value ETF | 4.53 | |
| IJS | iShares S&P SmallCap 600 Value ETF | 4.36 | |
| IWM | iShares Russell 2000 ETF | 4.21 | |
| IJR | iShares S&P SmallCap 600 Index Fund | 3.38 | |
| IJT | iShares S&P SmallCap 600 Growth ETF | 3.32 |
| Large Cap Funds | Symbol | Name | Score |
|---|---|---|---|
| Average Group Score: 4.0 | IWB | iShares Russell 1000 ETF | 4.84 |
| IYY | iShares Dow Jones U.S. ETF | 4.79 | |
| IWL | iShares Russell Top 200 ETF | 4.78 | |
| IVV | iShares S&P 500 Index | 4.71 | |
| IWX | iShares Russell Top 200 Value ETF | 4.08 | |
| OEF | iShares S&P 100 ETF | 3.96 | |
| IVW | iShares S&P 500 Growth ETF | 3.95 | |
| IVE | iShares S&P 500 Value ETF | 3.91 | |
| IWY | iShares Russell Top 200 Growth ETF | 3.56 | |
| IWD | iShares Russell 1000 Value ETF | 3.34 |
| Mid Cap Funds | Symbol | Name | Score |
|---|---|---|---|
| Average Group Score: 3.9 | IJH | iShares S&P MidCap 400 Index Fund | 4.39 |
| IJK | iShares S&P MidCap 400 Growth ETF | 3.73 | |
| IWS | iShares Russell Midcap Value ETF | 3.45 | |
| IWR | iShares Russell Midcap ETF | 3.28 | |
| IJJ | iShares S&P MidCap 400 Value ETF | 3.11 | |
| IWP | iShares Russell Midcap Growth ETF | 1.80 |
| Global Funds | Symbol | Name | Score |
|---|---|---|---|
| Average Group Score: 3.9 | JPXN | iShares JPX-Nikkei 400 ETF | 5.66 |
| EEM | iShares MSCI Emerging Markets ETF | 5.43 | |
| ILF | iShares S&P Latin America 40 ETF | 4.83 | |
| EPP | iShares MSCI Pacific ex-Japan Index Fund | 4.46 | |
| EFA | iShares MSCI EAFE ETF | 4.34 | |
| IEV | iShares Europe ETF | 4.12 | |
| BKF | iShares MSCI BRIC ETF | 1.97 |
| Sector Funds | Symbol | Name | Score |
|---|---|---|---|
| Average Group Score: 3.8 | IEZ | iShares U.S. Oil Equip. & Svcs. ETF | 5.87 |
| IGE | iShares North American Natural Resources ETF | 5.83 | |
| ITA | iShares U.S. Aerospace & Defense ETF | 5.81 | |
| SOXX | iShares Semiconductor ETF | 5.76 | |
| IDGT | iShares U.S. Digital Infrastructure and Real Estate ETF | 5.68 | |
| IYE | iShares U.S. Energy ETF | 5.65 | |
| IHE | iShares U.S. Pharmaceuticals ETF | 5.62 | |
| IEO | iShares U.S. Oil & Gas Exploration & Production ETF | 5.58 | |
| IYJ | iShares U.S. Industrial ETF | 5.32 | |
| IBB | iShares Biotechnology ETF | 5.27 | |
| IYZ | iShares U.S. Telecom ETF | 4.89 | |
| IYM | iShares U.S. Basic Materials ETF | 4.70 | |
| IDU | iShares U.S. Utilities ETF | 4.41 | |
| IYT | iShares U.S. Transportation ETF | 4.25 | |
| IAT | iShares U.S. Regional Banks ETF | 4.18 | |
| IYK | iShares US Consumer Staples ETF | 4.04 | |
| IAI | iShares U.S. Broker Dealers & Securities Exchanges ETF | 4.00 | |
| IAI | iShares U.S. Broker Dealers & Securities Exchanges ETF | 4.00 | |
| IAK | iShares U.S. Insurance ETF | 3.92 | |
| IYW | iShares U.S. Tech. ETF | 3.86 | |
| IYC | iShares US Consumer Discretionary ETF | 3.74 | |
| IYH | iShares U.S. Healthcare ETF | 3.62 | |
| IYF | iShares U.S. Financial ETF | 3.38 | |
| ITB | iShares U.S. Home Construction ETF | 3.28 | |
| ICF | iShares Select U.S. REIT ETF | 3.17 | |
| IHI | iShares U.S. Medical Devices ETF | 1.20 | |
| IGV | iShares North American Tech-Software ETF | 1.20 | |
| IHF | iShares U.S. Healthcare Providers ETF | 0.21 |
Weekly Updates: No changes.
| ETF Name | Symbol | NDW Suggested Weighting | Yield | Date Added |
|---|---|---|---|---|
| iShares Biotechnology ETF | IBB | 11.111% | 0.2208 | 11/19/2025 |
| iShares North American Natural Resources ETF | IGE | 11.111% | 1.8577 | 02/18/2026 |
| iShares Expanded Tech Sector ETF | IGM | 11.111% | 0.1763 | 09/06/2023 |
| iShares U.S. Energy ETF | IYE | 11.111% | 2.2914 | 02/18/2026 |
| iShares U.S. Financial ETF | IYF | 11.111% | 1.3876 | 11/16/2022 |
| iShares U.S. Basic Materials ETF | IYM | 11.111% | 1.2337 | 02/11/2026 |
| iShares U.S. Tech. ETF | IYW | 11.111% | 0.1456 | 05/31/2023 |
| iShares U.S. Telecom ETF | IYZ | 11.111% | 1.7427 | 02/26/2025 |
| iShares Semiconductor ETF | SOXX | 11.111% | 0.4888 | 09/24/2025 |
| ETF Name | Symbol | NDW Suggested Weighting | Yield | Date Added |
|---|---|---|---|---|
| iShares COMEX Gold Trust | IAU | 12.500% | 0.0000 | 05/07/2025 |
| iShares S&P 500 Index | IVV | 12.500% | 1.1662 | 12/20/2023 |
| iShares U.S. Industrial ETF | IYJ | 12.500% | 0.7602 | 02/21/2024 |
| iShares U.S. Oil Equip. & Svcs. ETF | IEZ | 12.500% | 1.3443 | 02/18/2026 |
| iShares U.S. Broker Dealers & Securities Exchanges ETF | IAI | 12.500% | 0.9981 | 08/14/2024 |
| iShares U.S. Aerospace & Defense ETF | ITA | 12.500% | 0.4819 | 03/15/2023 |
| iShares Semiconductor ETF | SOXX | 12.500% | 0.4888 | 01/14/2026 |
| iShares Silver Trust | SLV | 12.500% | 0.0000 | 11/19/2025 |
| ETF Name | Symbol | NDW Suggested Weighting | Yield | Date Added |
|---|---|---|---|---|
| iShares MSCI Italy ETF | EWI | 20.000% | 2.6508 | 05/10/2023 |
| iShares MSCI South Korea ETF | EWY | 20.000% | 1.3486 | 12/03/2025 |
| iShares MSCI Israel ETF | EIS | 20.000% | 1.3315 | 12/11/2024 |
| iShares MSCI Peru and Global Exposure ETF | EPU | 20.000% | 1.2646 | 06/05/2024 |
| iShares MSCI Poland ETF | EPOL | 20.000% | 4.3949 | 03/13/2024 |
| ETF Name | Symbol | NDW Suggested Weighting | Yield | Date Added |
|---|---|---|---|---|
| iShares JP Morgan USD Emerging Markets Bond ETF | EMB | 20.000% | 4.8939 | 08/07/2024 |
| iShares Global High Yield Corp Bond ETF | GHYG | 20.000% | 6.0542 | 02/08/2023 |
| IShares Emerging Markets High Yield Bond ETF | EMHY | 20.000% | 6.3339 | 01/25/2023 |
| iShares JP Morgan EM Corporate Bond ETF | CEMB | 20.000% | 5.0581 | 03/12/2025 |
| iShares JP Morgan EM Local Currency Bond ETF | LEMB | 20.000% | 2.3718 | 01/18/2023 |
iShares (Thurs.)
Loading, Please Wait...
