Most Requested Symbols


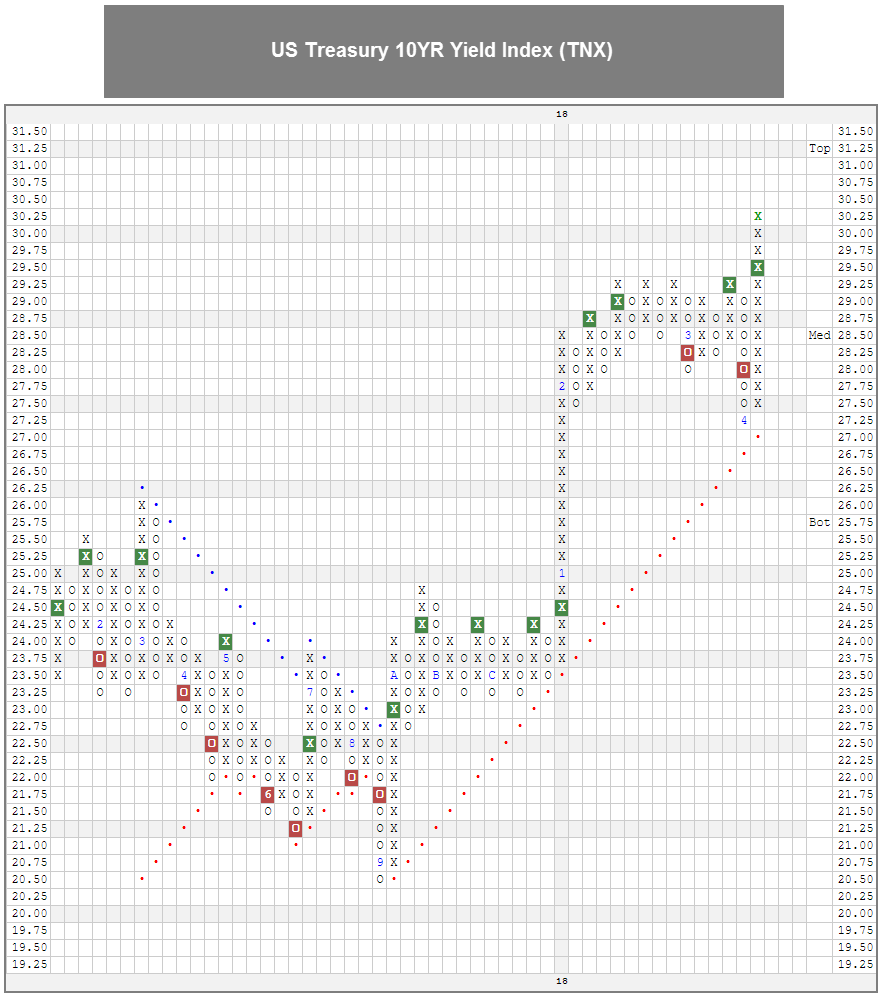
There are no changes to any of the iShares Alternatives models this week. As we discussed in yesterday's fixed income piece, the US Treasury 10YR Yield Index TNX recently reached 3.0% and continued higher, reaching levels we have not seen since 2011. We have also seen notable deterioration in the average score for many fixed income groups - currently the only fixed income groups with a score above 3.0 are the Floating Rate, Inverse-Fixed Income, and Convertible Bonds groups.
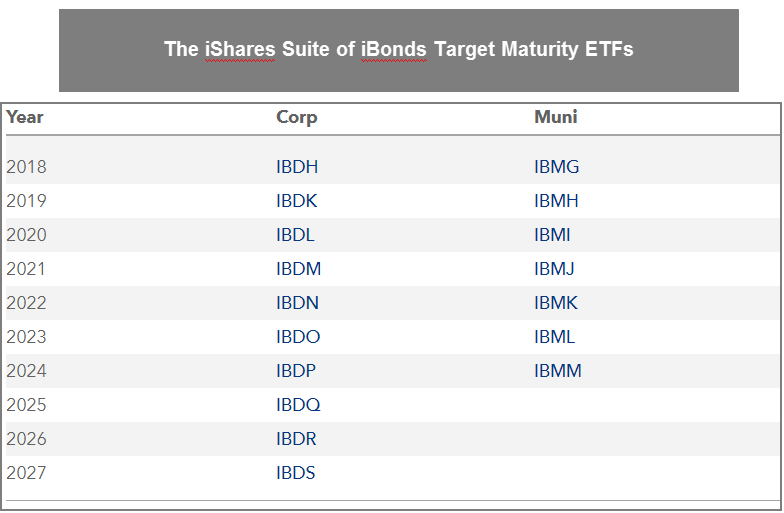
If you are concerned about how your clients' fixed income allocation may hold up in a rising rate environment, you may want to consider incorporating a laddered, held-to-maturity portfolio using the iShares iBonds Suite of products. The iBonds offer a series of target maturity corporate and municipal bond ETFs.
Unlike traditional fixed income ETFs, target maturity ETFs hold individual bonds that each mature or are expected to be called in the same year. As the underlying bonds mature, the cash or cash equivalent holdings of the fund increases and upon the fund reaching maturity the proceeds are distributed to shareholders. Because these funds have a target maturity, they can be used to create a held-to-maturity portfolio to protect against capital losses due to rising interest rates.Targeted maturity ETFs can also be used to create laddered portfolios. A laddered portfolio is one with allocations spread across several different maturities, e.g. 20% each to 1 to 5 year maturity bonds. A laddered portfolio provides liquidity and can help minimize interest rate risk.

This section of the report categorizes select iShares Fixed Income and Currency ETPs by their respective fund groups. Along with each group, you can view the Average Group Score, which is an average of the scores of all funds represented in that particular group. Those iShares ETFs that meet or exceed the Average Group Score will be highlighted in green in order to easily view those ETFs that have superior strength within their respective group. You want to focus on those ETFs that exhibit superior strength when looking to add new exposure to a particular group.
Global Fixed Income
Symbol
Name
Score
Average Group Score: 2.7
IGOV
iShares S&P/Citigroup International Treasury Bond ETF
3.35
ISHG
iShares S&P/Citigroup 1-3 Year Intl. Treas. Bond ETF
3.19
IPFF
iShares S&P International Preferred Stock ETF
2.34
EMB
iShares JP Morgan USD Emerging Markets Bond ETF
1.20
High Yield
Symbol
Name
Score
Average Group Score: 2.5
HYG
iShares iBoxx $ High Yield Corporate Bond ETF
1.62
Broad Fixed Income
Symbol
Name
Score
Average Group Score: 2.3
MBB
iShares Barclays MBS Fixed-Rate Bond ETF
1.54
CIU
iShares Barclays Intermediate Credit Bond ETF
1.31
AGG
iShares US Core Bond ETF
1.29
CRED
iShares US Credit Bond ETF
0.23
CLY
iShares 10+ Year Credit Bond ETF
0.16
Municipal Bonds
Symbol
Name
Score
Average Group Score: 2.3
CMF
iShares California Municipal Bond ETF
1.31
NYF
iShares New York Muni Bond ETF
1.26
SUB
iShares Short-Term National Muni Bond ETF
0.72
MUB
iShares National Municipal Bond ETF
0.30
Corporate Bonds
Symbol
Name
Score
Average Group Score: 2.3
FLOT
iShares Floating Rate Note ETF
3.38
CSJ
iShares Barclays 1-3 Year Credit Bond ETF
2.08
PFF
iShares S&P U.S. Preferred Stock ETF
1.76
LQD
iShares iBoxx $ Investment Grade Corp. Bond ETF
0.29
Inflation Protection Bonds
Symbol
Name
Score
Average Group Score: 2.1
STIP
iShares Barclays 0-5 Year TIPS Bond ETF
2.57
TIP
iShares Barclays US Treasury Inflation Protected Securities
1.83
Agency Bonds
Symbol
Name
Score
Average Group Score: 2.1
AGZ
iShares Barclays Agency Bond ETF
0.51
Treasury Bonds
Symbol
Name
Score
Average Group Score: 2.1
SHV
iShares Barclays Short Treasury Bond ETF
2.81
SHY
iShares Barclays 1-3 Year Tres. Bond ETF
2.28
IEI
iShares Barclays 3-7 Year Treasury Bond ETF
1.16
IEF
iShares Barclays 7-10 Year Tres. Bond ETF
0.55
TLH
iShares Barclays 10-20 Year Treasury Bond ETF
0.48
TLT
iShares Barclays 20+ Year Treasury Bond ETF
0.45
GVI
iShares Barclays Intermediate Government/Credit Bond ETF
0.40
GBF
iShares Barclays Government/Credit Bond ETF
0.22
The DWA Matrix uses a Point & Figure relative strength comparison of each index to one another to identify the strongest and the weakest among the universe used. The ETFs with the most relative strength buy signals (suggesting outperformance) versus the others in the group are listed at the top. These ETFs should be overweighted in the portfolio. Those ETFs with the least amount of relative strength buy signals versus the others in the group are listed at the bottom. These ETFs should be underweighted in the portfolio.
iShare Alternative Matrix Summary
| Ticker | Name | Buys | Xs | Tech Attribute/ Score |
|---|---|---|---|---|
| WOOD | iShares S&P Global Timber & Forestry ETF | 10 | 10 | 4.94 |
| DVY | iShares Dow Jones Select Dividend ETF | 9 | 6 | 2.74 |
| WPS | iShares S&P World ex-US Property ETF | 7 | 5 | 2.83 |
| GSG | iShares S&P GSCI Commodity-Indexed Trust | 6 | 9 | 3.82 |
| IDV | iShares Dow Jones International Select Dividend ETF | 6 | 6 | 2.68 |
| IAU | iShares COMEX Gold Trust | 5 | 8 | 3.85 |
| ICF | iShares Cohen & Steers Realty ETF | 4 | 0 | 0.29 |
| SLV | iShares Silver Trust | 3 | 3 | 0.96 |
| TIP | iShares Barclays US Treasury Inflation Protected Securities | 3 | 2 | 1.83 |
| PFF | iShares S&P U.S. Preferred Stock ETF | 2 | 2 | 1.76 |
| SHV | iShares Barclays Short Treasury Bond ETF | 0 | 4 | 2.81 |

Weekly Updates:
| ETF Name | Symbol | DWA Suggested Weighting | Yield | Date Added |
|---|---|---|---|---|
| iShares iBoxx $ High Yield Corporate Bond ETF | HYG | 20.000% | 5.1320 | 11/16/2016 |
| iShares Global High Yield Corp Bond ETF | GHYG | 20.000% | 4.7950 | 12/28/2016 |
| iShares International High Yield Bond ETF | HYXU | 20.000% | 1.0560 | 07/26/2017 |
| IShares Emerging Markets High Yield Bond ETF | EMHY | 20.000% | 5.1890 | 11/09/2016 |
| iShares JP Morgan EM Corporate Bond ETF | CEMB | 20.000% | 4.1600 | 11/23/2016 |
| ETF Name | Symbol | DWA Suggested Weighting | Yield | Date Added |
|---|---|---|---|---|
| iShares Dow Jones Select Dividend ETF | DVY | 16.667% | 3.1590 | 02/18/2015 |
| iShares Russell Midcap Value ETF | IWS | 16.667% | 2.0100 | 02/18/2015 |
| iShares U.S. Consumer Goods ETF | IYK | 16.667% | 1.9490 | 02/18/2015 |
| iShares Edge MSCI Min Vol USA ETF | USMV | 16.667% | 1.8480 | 02/18/2015 |
| iShares Core Dividend Growth ETF | DGRO | 16.667% | 2.1760 | 01/13/2016 |
| iShares Edge MSCI Min Vol Japan ETF | JPMV | 16.667% | 1.4020 | 11/16/2016 |
iShares Alternative (Thurs.)
Loading, Please Wait...
