Most Requested Symbols


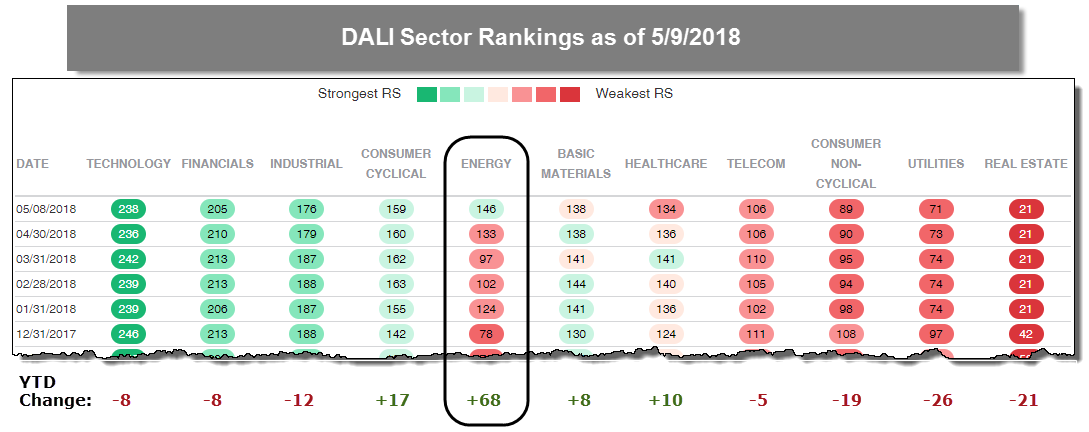
As discussed in today's Daily Equity Report update, so far this year, Commodities has been by far the most improved asset class in terms of buy signal tally in our Dynamic Asset Level Investig (DALI) tool. Year-to-date, Commodities has gained +48 new signals, and in effect, has seen its tally signal count rise from 131 to 179. One of the major factors driving the improvement in Commodities has been crude oil. The improvement in oil has also resulted in improvement in the broad Energy sector of domestic equities. Thus far this year, Energy is the most improved sector, adding 68 buy signals to its tally in the DALI sector rankings.
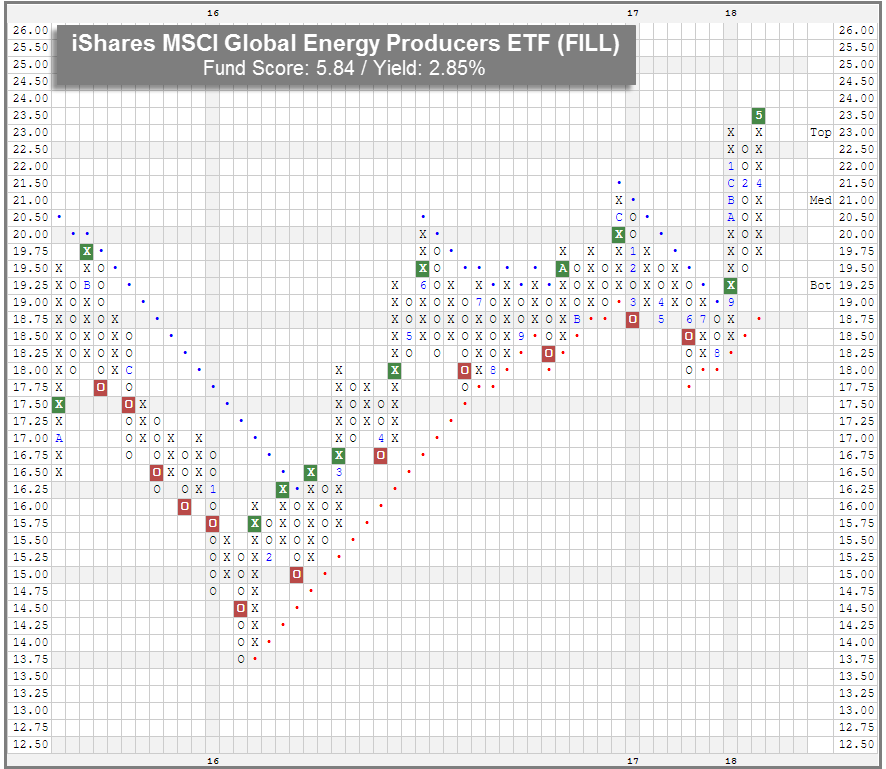
If the upward trend in oil prices continues, one fund that is positioned to benefit is the iShares MSCI Global Energy Producers FILL. FILL has a nearly perfect 5.84 fund score and a strongly positive score direction of 3.30. FILL gave a second consecutive buy signal when it broke a double top at $23.50 in trading on 5/9. Meanwhile, its bullish price objective of $32.75 and recent flip to positive monthly momentum each suggest that FILL has the potential for additional upside. The fund also offers a 2.85% yield. FILL currently sits in overbought territory with a weekly distribution reading of 102%, so those interested in adding exposure can consider waiting for a pullback. The fund most recently found support at $19.50.
There are no changes to any of the iShares models this week. We wanted to take this opportunity to alert you to some upcoming changes to the iShares models lineup and the weekly iShares reports. First, the iShares Alternative Report and iShares Equity Report will be consolidated into a single, all-encompassing iShares report, the “iShares ETF Report”. Additionally, the models will be streamlined and reduced to four models that can be seen as the essential portfolio building blocks. The inventories of the remaining models are currently going through an evaluation to determine if there are ways to expand coverage within the model’s asset class. The models that will remain are:
The models that will no longer be available are:

This section of the report categorizes select iShares Fixed Income and Currency ETPs by their respective fund groups. Along with each group, you can view the Average Group Score, which is an average of the scores of all funds represented in that particular group. Those iShares ETFs that meet or exceed the Average Group Score will be highlighted in green in order to easily view those ETFs that have superior strength within their respective group. You want to focus on those ETFs that exhibit superior strength when looking to add new exposure to a particular group.
High Yield
Symbol
Name
Score
Average Group Score: 2.5
HYG
iShares iBoxx $ High Yield Corporate Bond ETF
1.82
Global Fixed Income
Symbol
Name
Score
Average Group Score: 2.4
IGOV
iShares S&P/Citigroup International Treasury Bond ETF
2.78
ISHG
iShares S&P/Citigroup 1-3 Year Intl. Treas. Bond ETF
2.69
IPFF
iShares S&P International Preferred Stock ETF
2.36
EMB
iShares JP Morgan USD Emerging Markets Bond ETF
1.20
Municipal Bonds
Symbol
Name
Score
Average Group Score: 2.3
CMF
iShares California Municipal Bond ETF
1.29
NYF
iShares New York Muni Bond ETF
1.18
SUB
iShares Short-Term National Muni Bond ETF
0.32
MUB
iShares National Municipal Bond ETF
0.29
Broad Fixed Income
Symbol
Name
Score
Average Group Score: 2.3
MBB
iShares Barclays MBS Fixed-Rate Bond ETF
1.46
AGG
iShares US Core Bond ETF
1.21
CIU
iShares Barclays Intermediate Credit Bond ETF
1.17
CRED
iShares US Credit Bond ETF
0.12
CLY
iShares 10+ Year Credit Bond ETF
0.11
Inflation Protection Bonds
Symbol
Name
Score
Average Group Score: 2.2
STIP
iShares Barclays 0-5 Year TIPS Bond ETF
2.14
TIP
iShares Barclays US Treasury Inflation Protected Securities
1.74
Corporate Bonds
Symbol
Name
Score
Average Group Score: 2.2
FLOT
iShares Floating Rate Note ETF
3.25
PFF
iShares S&P U.S. Preferred Stock ETF
2.04
CSJ
iShares Barclays 1-3 Year Credit Bond ETF
1.83
LQD
iShares iBoxx $ Investment Grade Corp. Bond ETF
0.24
Agency Bonds
Symbol
Name
Score
Average Group Score: 2.0
AGZ
iShares Barclays Agency Bond ETF
0.28
Treasury Bonds
Symbol
Name
Score
Average Group Score: 2.0
SHV
iShares Barclays Short Treasury Bond ETF
2.35
SHY
iShares Barclays 1-3 Year Tres. Bond ETF
1.93
IEI
iShares Barclays 3-7 Year Treasury Bond ETF
0.98
TLT
iShares Barclays 20+ Year Treasury Bond ETF
0.46
TLH
iShares Barclays 10-20 Year Treasury Bond ETF
0.21
GVI
iShares Barclays Intermediate Government/Credit Bond ETF
0.17
IEF
iShares Barclays 7-10 Year Tres. Bond ETF
0.17
GBF
iShares Barclays Government/Credit Bond ETF
0.13
The DWA Matrix uses a Point & Figure relative strength comparison of each index to one another to identify the strongest and the weakest among the universe used. The ETFs with the most relative strength buy signals (suggesting outperformance) versus the others in the group are listed at the top. These ETFs should be overweighted in the portfolio. Those ETFs with the least amount of relative strength buy signals versus the others in the group are listed at the bottom. These ETFs should be underweighted in the portfolio.
iShare Alternative Matrix Summary
| Ticker | Name | Buys | Xs | Tech Attribute/ Score |
|---|---|---|---|---|
| WOOD | iShares S&P Global Timber & Forestry ETF | 10 | 10 | 4.85 |
| DVY | iShares Dow Jones Select Dividend ETF | 8 | 6 | 2.82 |
| GSG | iShares S&P GSCI Commodity-Indexed Trust | 7 | 9 | 3.82 |
| WPS | iShares S&P World ex-US Property ETF | 7 | 5 | 3.10 |
| IDV | iShares Dow Jones International Select Dividend ETF | 6 | 6 | 2.55 |
| IAU | iShares COMEX Gold Trust | 5 | 8 | 3.43 |
| ICF | iShares Cohen & Steers Realty ETF | 4 | 0 | 0.97 |
| SLV | iShares Silver Trust | 3 | 3 | 0.83 |
| TIP | iShares Barclays US Treasury Inflation Protected Securities | 3 | 2 | 1.74 |
| PFF | iShares S&P U.S. Preferred Stock ETF | 2 | 2 | 2.04 |
| SHV | iShares Barclays Short Treasury Bond ETF | 0 | 4 | 2.35 |

Weekly Updates:
| ETF Name | Symbol | DWA Suggested Weighting | Yield | Date Added |
|---|---|---|---|---|
| iShares iBoxx $ High Yield Corporate Bond ETF | HYG | 20.000% | 5.1170 | 11/16/2016 |
| iShares Global High Yield Corp Bond ETF | GHYG | 20.000% | 4.8980 | 12/28/2016 |
| iShares International High Yield Bond ETF | HYXU | 20.000% | 1.0860 | 07/26/2017 |
| IShares Emerging Markets High Yield Bond ETF | EMHY | 20.000% | 5.2490 | 11/09/2016 |
| iShares JP Morgan EM Corporate Bond ETF | CEMB | 20.000% | 4.2150 | 11/23/2016 |
| ETF Name | Symbol | DWA Suggested Weighting | Yield | Date Added |
|---|---|---|---|---|
| iShares Dow Jones Select Dividend ETF | DVY | 16.667% | 3.1590 | 02/18/2015 |
| iShares Russell Midcap Value ETF | IWS | 16.667% | 1.9980 | 02/18/2015 |
| iShares U.S. Consumer Goods ETF | IYK | 16.667% | 1.9590 | 02/18/2015 |
| iShares Edge MSCI Min Vol USA ETF | USMV | 16.667% | 1.8350 | 02/18/2015 |
| iShares Core Dividend Growth ETF | DGRO | 16.667% | 2.1560 | 01/13/2016 |
| iShares Edge MSCI Min Vol Japan ETF | JPMV | 16.667% | 1.4050 | 11/16/2016 |
iShares Alternative (Thurs.)
Loading, Please Wait...
