Most Requested Symbols


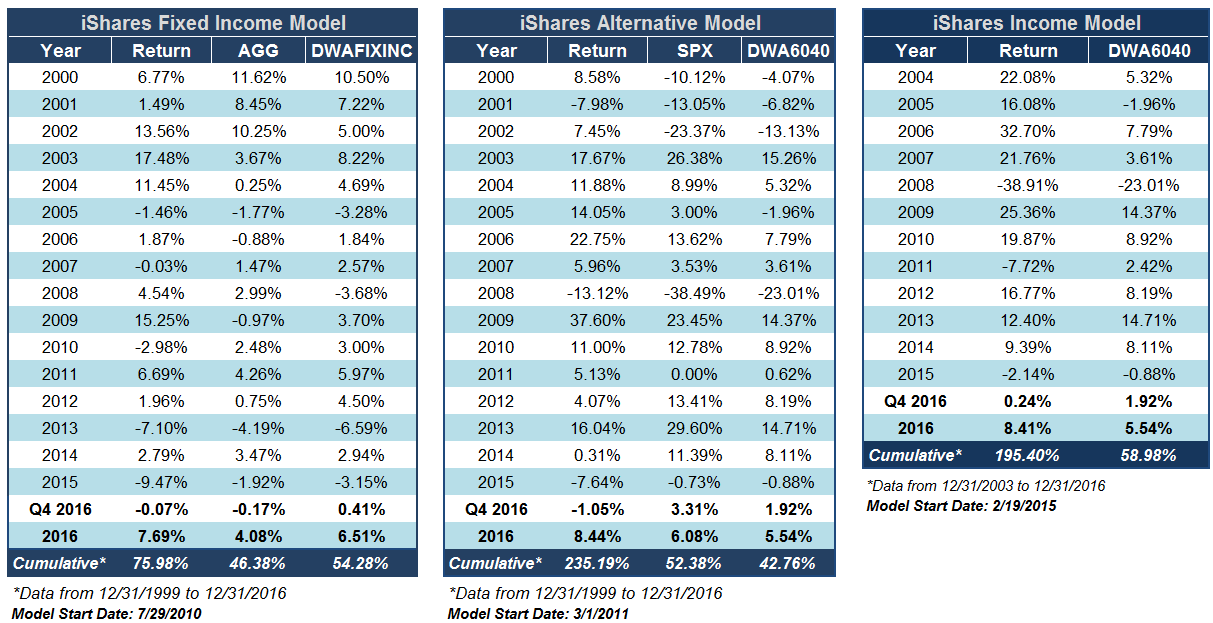
When all was said and done, the major "theme" in terms of asset class performance in 2016 remained US Equities. Despite heightened volatility coupled with a correction in Q1, money that was diversified away from US equities throughout the year, likely caused a lag relative to major market benchmarks such as the S&P 500 Index SPX and the Dow Jones Industrial Average DJIA. Nonetheless, there were still gains to be had in "alternative" areas of the market. For instance the broad fixed income benchmark, AGG, managed a 4.08% gain in 2016, despite a less than ideal Q4. The iShares Fixed Income Model ISHRFIXED was able to outperformance this benchmark both for the past quarter and the year as a whole, rallying 7.69% for the year. The iShares Alternative Model and the iShares Income Model, were also both able to beat their respective benchmarks for the year. Below we have provided a complete performance review for each of these models both during Q4 and 2016 as a whole.
iShares Fixed Income Model ISHRFIXED Q4 Changes:
iShares Alternative Model ISHRALT Q4 Changes:
iShares Income Model ISHRINCOME Q4 Changes:

This section of the report categorizes select iShares Fixed Income and Currency ETPs by their respective fund groups. Along with each group, you can view the Average Group Score, which is an average of the scores of all funds represented in that particular group. Those iShares ETFs that meet or exceed the Average Group Score will be highlighted in green in order to easily view those ETFs that have superior strength within their respective group. You want to focus on those ETFs that exhibit superior strength when looking to add new exposure to a particular group.
High Yield
Symbol
Name
Score
Average Group Score: 3.4
HYG
iShares iBoxx $ High Yield Corporate Bond ETF
2.93
Corporate Bonds
Symbol
Name
Score
Average Group Score: 3.2
FLOT
iShares Floating Rate Note ETF
1.99
CSJ
iShares Barclays 1-3 Year Credit Bond ETF
1.92
PFF
iShares S&P U.S. Preferred Stock ETF
1.88
LQD
iShares iBoxx $ Investment Grade Corp. Bond ETF
1.10
Broad Fixed Income
Symbol
Name
Score
Average Group Score: 2.4
CIU
iShares Barclays Intermediate Credit Bond ETF
1.98
MBB
iShares Barclays MBS Fixed-Rate Bond ETF
1.48
AGG
iShares US Core Bond ETF
1.30
CLY
iShares 10+ Year Credit Bond ETF
1.26
CRED
iShares US Credit Bond ETF
0.69
Global Fixed Income
Symbol
Name
Score
Average Group Score: 2.3
IPFF
iShares S&P International Preferred Stock ETF
1.90
EMB
iShares JP Morgan USD Emerging Markets Bond ETF
1.89
IGOV
iShares S&P/Citigroup International Treasury Bond ETF
0.47
ISHG
iShares S&P/Citigroup 1-3 Year Intl. Treas. Bond ETF
0.23
Inflation Protection Bonds
Symbol
Name
Score
Average Group Score: 2.3
TIP
iShares Barclays US Treasury Inflation Protected Securities
2.07
STIP
iShares Barclays 0-5 Year TIPS Bond ETF
1.95
Agency Bonds
Symbol
Name
Score
Average Group Score: 2.1
AGZ
iShares Barclays Agency Bond ETF
1.40
Treasury Bonds
Symbol
Name
Score
Average Group Score: 2.1
SHV
iShares Barclays Short Treasury Bond ETF
2.03
SHY
iShares Barclays 1-3 Year Tres. Bond ETF
2.02
GBF
iShares Barclays Government/Credit Bond ETF
1.95
GVI
iShares Barclays Intermediate Government/Credit Bond ETF
1.73
IEF
iShares Barclays 7-10 Year Tres. Bond ETF
0.47
TLH
iShares Barclays 10-20 Year Treasury Bond ETF
0.42
IEI
iShares Barclays 3-7 Year Treasury Bond ETF
0.37
TLT
iShares Barclays 20+ Year Treasury Bond ETF
0.31
Municipal Bonds
Symbol
Name
Score
Average Group Score: 2.1
IBMF
iShares iBonds Sep 2017 AMT-Free Muni Bond ETF
1.96
IBME
iShares iBonds Sep 2016 Term M
1.90
MUB
iShares National Municipal Bond ETF
1.30
NYF
iShares New York Muni Bond ETF
1.23
CMF
iShares California Municipal Bond ETF
1.14
SUB
iShares Short-Term National Muni Bond ETF
0.59
The DWA Matrix uses a Point & Figure relative strength comparison of each index to one another to identify the strongest and the weakest among the universe used. The ETFs with the most relative strength buy signals (suggesting outperformance) versus the others in the group are listed at the top. These ETFs should be overweighted in the portfolio. Those ETFs with the least amount of relative strength buy signals versus the others in the group are listed at the bottom. These ETFs should be underweighted in the portfolio.
iShare Alternative Matrix Summary
| Ticker | Name | Buys | Xs | Tech Attribute/ Score |
|---|---|---|---|---|
| DVY | iShares Dow Jones Select Dividend ETF | 10 | 8 | 4.39 |
| WOOD | iShares S&P Global Timber & Forestry ETF | 9 | 10 | 4.39 |
| ICF | iShares Cohen & Steers Realty ETF | 7 | 3 | 3.08 |
| SLV | iShares Silver Trust | 6 | 1 | 1.23 |
| GSG | iShares S&P GSCI Commodity-Indexed Trust | 4 | 9 | 1.80 |
| TIP | iShares Barclays US Treasury Inflation Protected Securities | 4 | 4 | 2.07 |
| IAU | iShares COMEX Gold Trust | 4 | 0 | 0.54 |
| IDV | iShares Dow Jones International Select Dividend ETF | 3 | 7 | 2.50 |
| SHV | iShares Barclays Short Treasury Bond ETF | 3 | 6 | 2.03 |
| PFF | iShares S&P U.S. Preferred Stock ETF | 3 | 4 | 1.88 |
| WPS | iShares S&P World ex-US Property ETF | 1 | 3 | 0.15 |

Weekly Updates:
| ETF Name | Symbol | DWA Suggested Weighting | Date Added |
|---|---|---|---|
| iShares iBoxx $ High Yield Corporate Bond ETF | HYG | 20.000% | 11/16/2016 |
| iShares Global High Yield Corp Bond ETF | GHYG | 20.000% | 12/28/2016 |
| IShares Emerging Markets High Yield Bond ETF | EMHY | 20.000% | 11/09/2016 |
| iShares Emerging Markets Corporate Bond ETF | CEMB | 20.000% | 11/23/2016 |
| iShares Barclays 7-10 Year Tres. Bond ETF | IEF | 20.000% | 08/26/2015 |
| ETF Name | Symbol | DWA Suggested Weighting | Date Added |
|---|---|---|---|
| iShares Dow Jones Select Dividend ETF | DVY | 16.667% | 02/18/2015 |
| iShares Russell Midcap Value ETF | IWS | 16.667% | 02/18/2015 |
| iShares U.S. Consumer Goods ETF | IYK | 16.667% | 02/18/2015 |
| iShares Edge MSCI Min Vol USA ETF | USMV | 16.667% | 02/18/2015 |
| iShares Core Dividend Growth ETF | DGRO | 16.667% | 01/13/2016 |
| iShares Edge MSCI Min Vol Japan ETF | JPMV | 16.667% | 11/16/2016 |
iShares Alternative (Thurs.)
Loading, Please Wait...
