Over the last week of market action, seven of the major market ETFs covered in this report finished in positive territory while three finished in the red. Today, we'll walk through how to use smaller scales/box sizes to identify tighter support levels on those charts that may be trading on a stem, such as the QQQ and the XLG.
Portfolio View - Major Market ETFs
| Symbol | Name | Price | Yield | PnF Trend | RS Signal | RS Col. | Fund Score | 200 Day MA | Weekly Mom |
|---|---|---|---|---|---|---|---|---|---|
| DIA | SPDR Dow Jones Industrial Average ETF Trust | 278.20 | 2.15 | Positive | O | 4.07 | 262.80 | +4W | |
| EEM | iShares MSCI Emerging Markets ETF | 44.75 | 2.00 | Positive | Sell | O | 5.11 | 40.84 | -2W |
| EFA | iShares MSCI EAFE ETF | 65.25 | 2.50 | Positive | Sell | O | 3.02 | 62.73 | -1W |
| FM | iShares MSCI Frontier 100 ETF | 24.56 | 3.23 | Negative | Sell | O | 0.39 | 25.90 | +1W |
| IJH | iShares S&P MidCap 400 Index Fund | 193.50 | 1.66 | Positive | Buy | O | 3.20 | 182.81 | +4W |
| IJR | iShares S&P SmallCap 600 Index Fund | 74.70 | 1.58 | Positive | Buy | O | 2.79 | 71.87 | +4W |
| QQQ | Invesco QQQ Trust | 277.97 | 0.59 | Positive | Buy | X | 5.86 | 223.16 | -2W |
| RSP | Invesco S&P 500 Equal Weight ETF | 110.39 | 1.94 | Positive | Buy | X | 4.04 | 104.60 | +4W |
| SPY | SPDR S&P 500 ETF Trust | 338.64 | 1.69 | Positive | O | 4.24 | 306.40 | +5W | |
| XLG | Invesco S&P 500 Top 50 ETF | 263.85 | 1.38 | Positive | O | 5.65 | 229.69 | +6W |
Additional Comments:
Over the last week of market action, seven of the major market ETFs covered in this report finished in positive territory while three finished in the red. The top two performing funds for the week were the Invesco QQQ Trust QQQ and the Invesco S&P 500 Top 50 ETF XLG with gains of 4.82% and 2.77%, respectively, as we continue to witness those stocks in the large and mega-cap camps march higher. Small-caps struggled this week as the three worst-performing funds included the Invesco S&P 500 Equal Weight ETF RSP, iShares S&P MidCap 400 Index Fund IJH, and the iShares S&P SmallCap 600 Index Fund IJR with respective losses of -0.15%, -0.38%, and -1.32%. Today, we'll walk through how to use smaller scales/box sizes to identify tighter support levels on those charts that may be trading on a stem, such as the QQQ and the XLG.
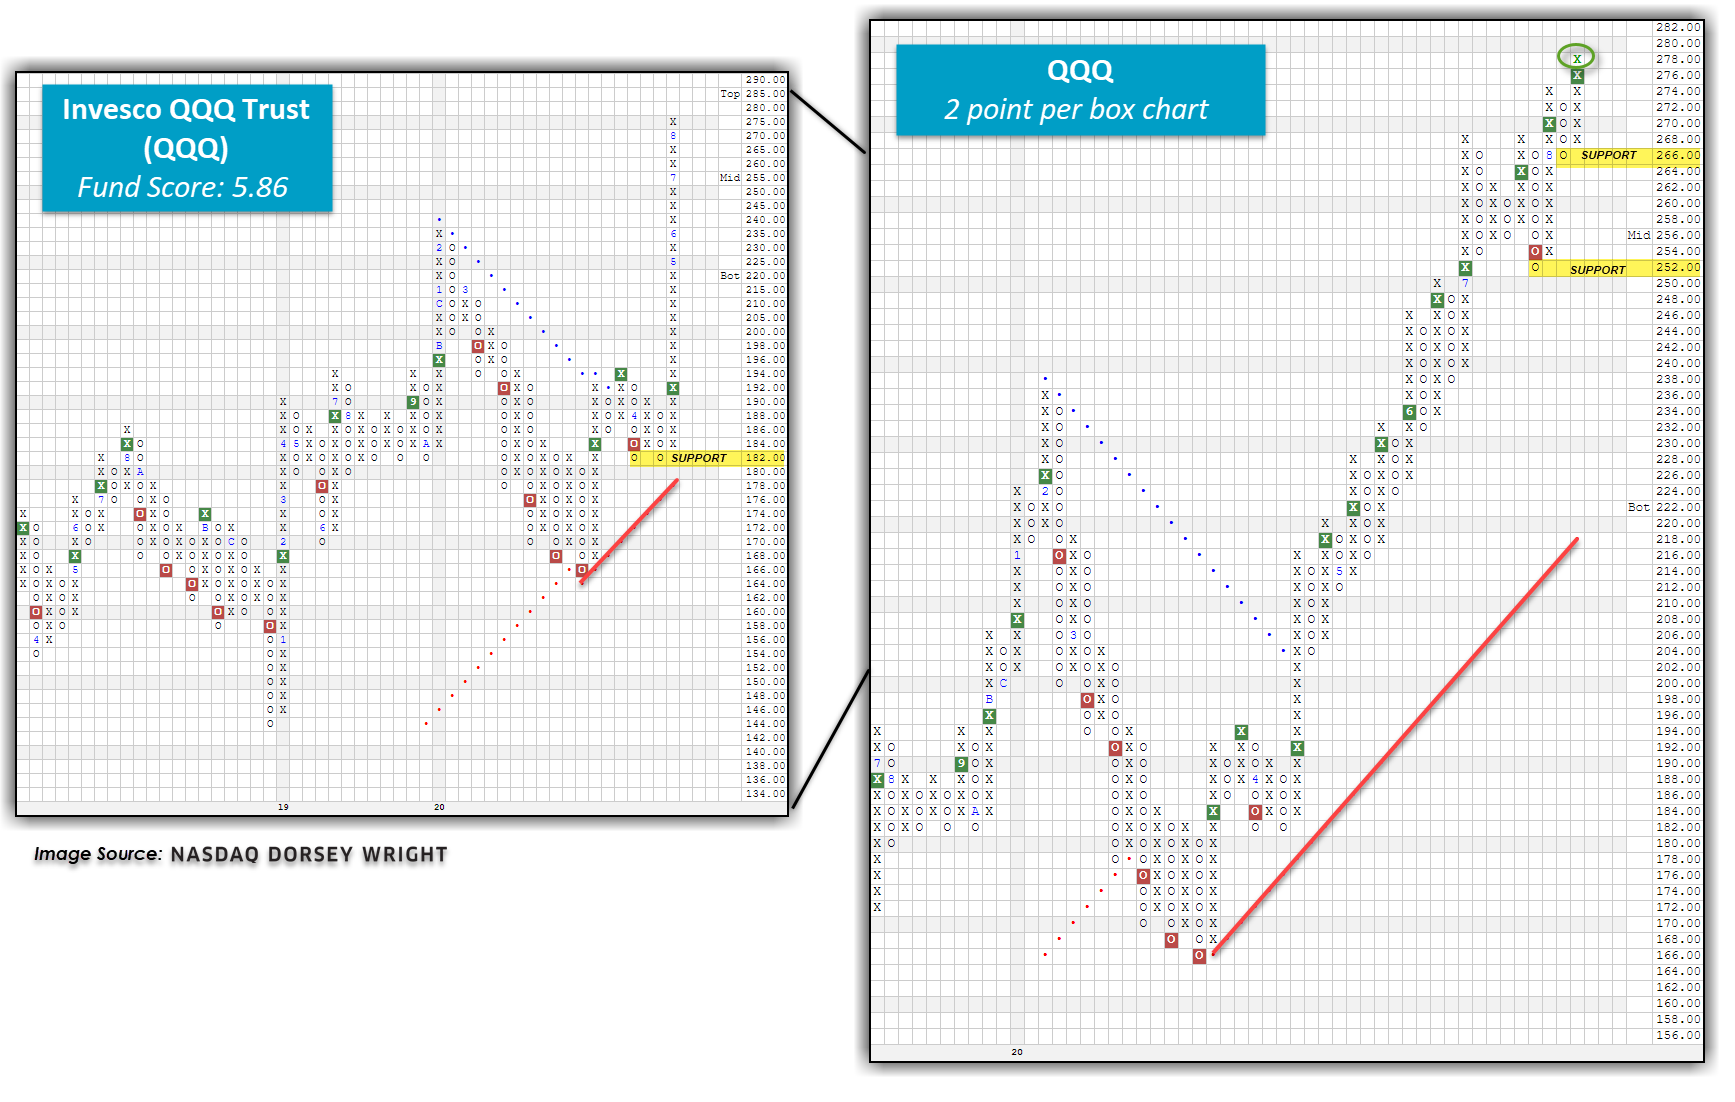
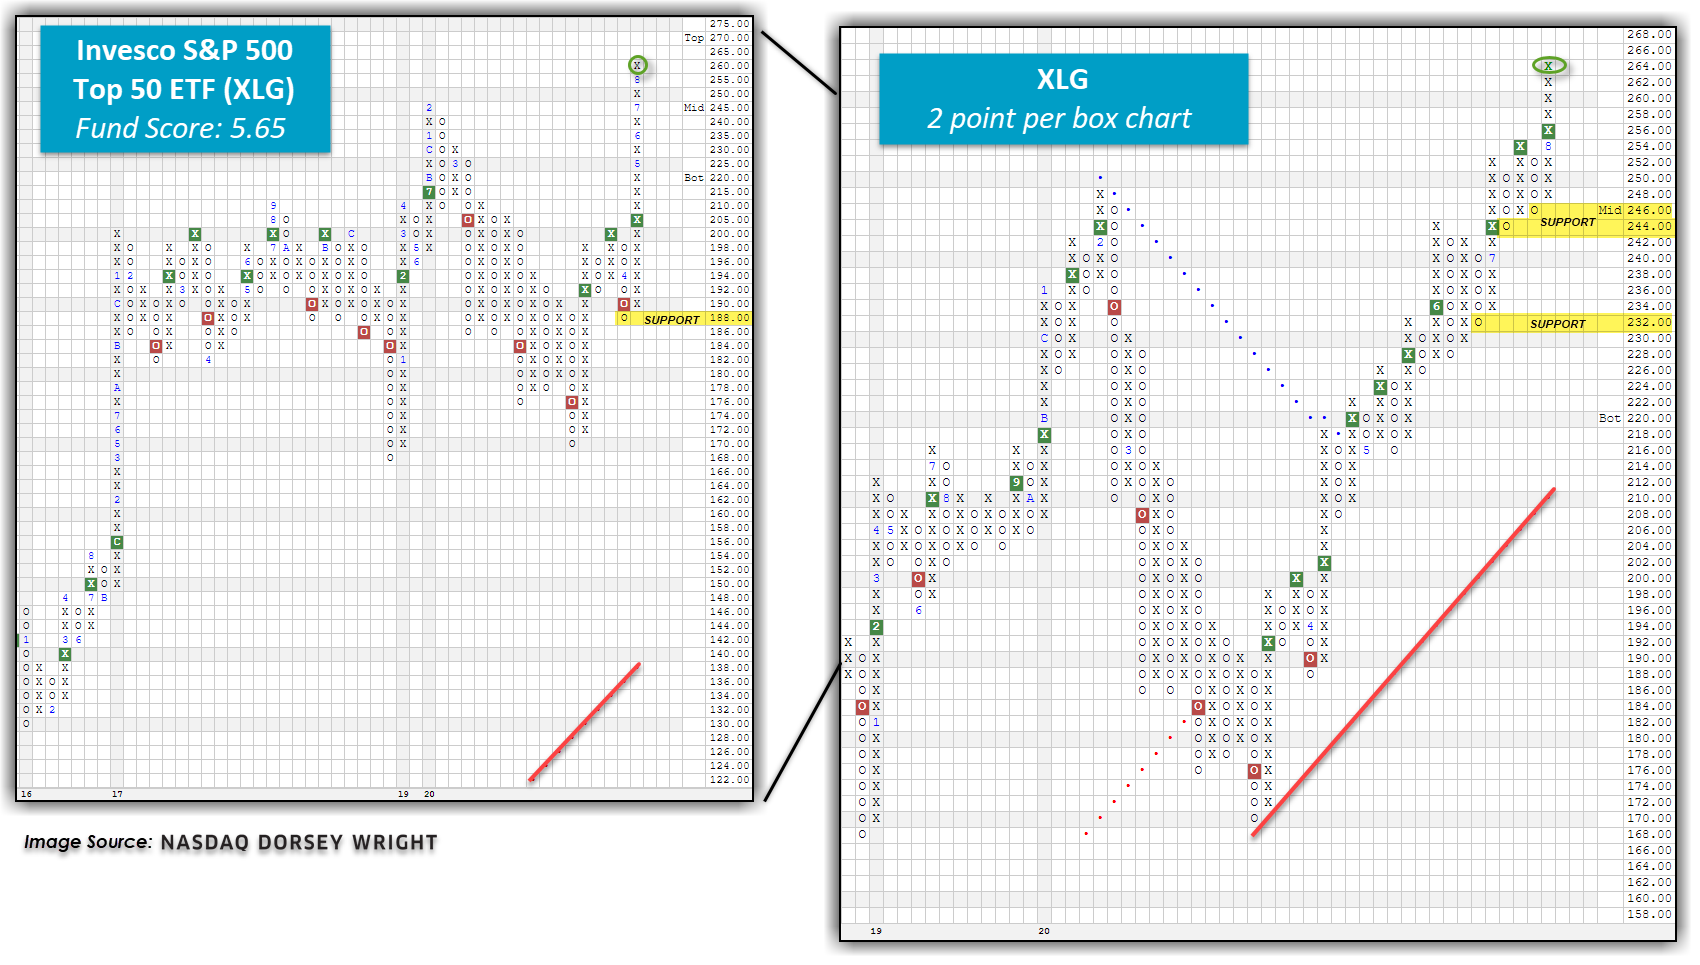
When tracking the price action of a security over time using the Point & Figure methodology, we can target a shorter-term picture that is more sensitive to price movements by using a smaller box size to view the chart. In the images below, we look at both the default charts for the QQQ and XLG versus their respective 2-point per box charts.
In both cases, the default charts have been on a long stem of X's that have been intact since April of this year. As the indexes continue to better their highs, new X's are added to these columns, moving them further from potential support levels for those who may be entering new positions or holding open positions. When we look at the more sensitive 2-point per box charts, we can identify better areas of support and resistance. For example, the 2-point chart for the QQQ shows a pullback and subsequent reversal up into X's that occurred just this month. With yesterday's market action, this chart broke a double top at $276 before pushing higher to $278, marking the second consecutive buy signal for the fund in addition to printing a new record high. This price action also establishes support at the $266 level as a result of the QQQ's brief exhale, with additional support offered at $252. We find that these support levels are much more manageable when compared to the QQQ's default chart support, which sits at $182, more than -34.5% away from where the fund is trading today.
Concerning XLG, the 2-point per box chart reveals a total of eight consecutive buy signals that have occurred over the last four months as well as a recent rally to new all-time highs at $264. In terms of support levels for the XLG, we can identify $246 as initial support, with additional support coming in at $244 and $232. In comparison, the default chart for the XLG offers initial support at $188, over -28% away from where XLG trades today. Overall, both the QQQ and XLG offer bullish technical pictures with scores over the strong 5.50-level. Although at first glance they may appear too overbought for new positions, the more sensitive box sizes show attractive entry points at current levels, with reasonable support nearby.


