In recent reports, we have continued to discuss the factors driving the wide performance dispersion between the top-performing fund, the QQQ, and the second-best performing fund, the XLG, including the superior strength of large-cap growth stocks relative to their large-cap value counterparts. Today, we want to bring your attention to another year-to-date performance dispersion that caught our eye – the +8% spread between that of the cap-weighted SPDR S&P 500 ETF Trus (SPY) and the equal-weighted Invesco S&P 500 Equal Weight ETF (RSP).
Portfolio View - Major Market ETFs
| Symbol | Name | Price | Yield | PnF Trend | RS Signal | RS Col. | Fund Score | 200 Day MA | Weekly Mom |
|---|---|---|---|---|---|---|---|---|---|
| DIA | SPDR Dow Jones Industrial Average ETF Trust | 261.50 | 2.29 | Positive | X | 3.39 | 263.21 | +11W | |
| EEM | iShares MSCI Emerging Markets ETF | 40.80 | 2.19 | Positive | Sell | O | 2.26 | 40.56 | +11W |
| EFA | iShares MSCI EAFE ETF | 62.11 | 2.63 | Positive | Sell | O | 1.22 | 63.20 | +11W |
| FM | iShares MSCI Frontier 100 ETF | 24.04 | 3.30 | Negative | Sell | O | 0.35 | 26.69 | +11W |
| IJH | iShares S&P MidCap 400 Index Fund | 178.66 | 1.80 | Positive | Buy | O | 2.46 | 184.56 | +11W |
| IJR | iShares S&P SmallCap 600 Index Fund | 67.97 | 1.74 | Positive | Buy | O | 2.10 | 73.40 | +11W |
| QQQ | Invesco QQQ Trust | 248.84 | 0.66 | Positive | Buy | X | 5.87 | 209.46 | +11W |
| RSP | Invesco S&P 500 Equal Weight ETF | 102.86 | 2.08 | Positive | Buy | X | 3.30 | 105.07 | +11W |
| SPY | SPDR S&P 500 ETF Trust | 312.05 | 1.83 | Positive | O | 3.84 | 301.58 | +11W | |
| XLG | Invesco S&P 500 Top 50 ETF | 240.34 | 1.51 | Positive | O | 4.75 | 222.62 | +11W |
Additional Comments:
It was a mixed bag in terms of price performance over the last week of trading as half of the major market funds covered in this report finished up for the week while the remaining half found themselves in the red. The best performing fund over the last seven days was the iShares MSCI Emerging Markets ETF EEM, up 3.21%, while the worst-performing fund was the iShares S&P SmallCap 600 Index Fund IJR, down -2.69% (through 6/23). Relatively speaking, US large caps continue to dominate all other areas of the equity markets, a leadership theme that is reflected in the year-to-date performance numbers for our lineup of major market funds with the Invesco QQQ Trust QQQ leading with an impressive gain of 17.04%, followed by the XLG and the SPY with respective returns of 2.98% and -3.05%.

In recent reports, we have continued to discuss the factors driving the wide performance dispersion between the top-performing fund, the QQQ, and the second-best performing fund, the XLG, including the superior strength of large-cap growth stocks relative to their large-cap value counterparts. Today, we want to bring your attention to another year-to-date performance dispersion that caught our eye – the +8% spread between that of the cap-weighted SPDR S&P 500 ETF Trust SPY and the equal-weighted Invesco S&P 500 Equal Weight ETF RSP.
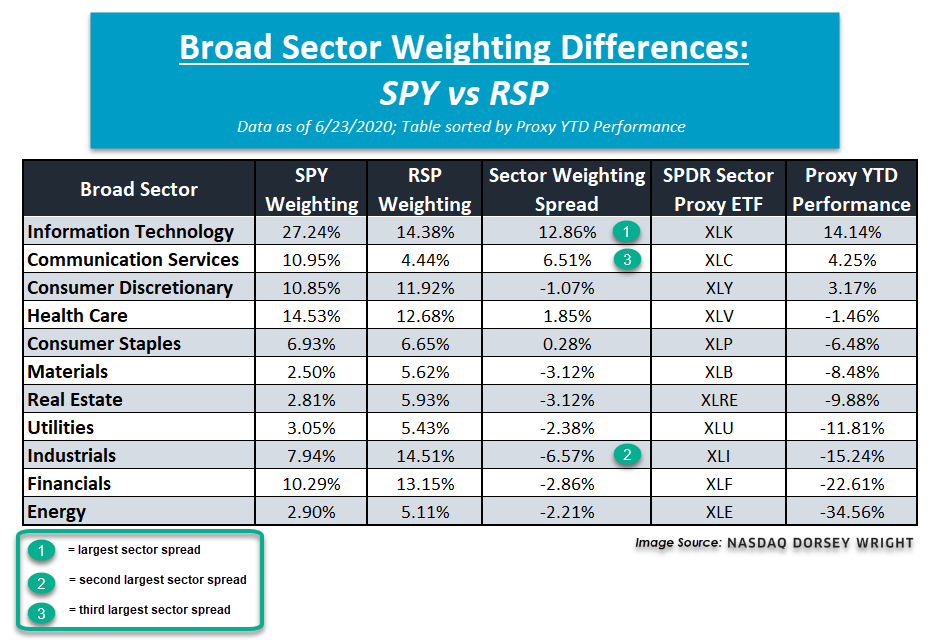
While the SPY and RSP provide exposure to the same basket of 500 stocks, the way in which each provides exposure is what makes them stand apart. The SPY is a cap-weighted fund, meaning the larger the stock's market cap, the higher the weighting in the fund. Conversely, the RSP gives all stocks the exact same weighting with no regard for market cap. When we drill down into the sector weightings for each of these two S&P 500-based funds, we find that there are significant differences in sector weightings between the SPY and the RSP, which we've broken down in the table below. Notice how the SPY is most heavily allocated to the technology sector at 27.24%, which is nearly 2x greater than the RSP’s 14.38% weighting. This spread of +12.86% is the largest sector weighting difference between the two funds and is one that has greatly benefitted the SPY as technology (XLK) is the top-performing SPDR sector fund so far this year, up 14.14%. On the other hand, the RSP is most heavily allocated to industrials at 14.51%, a weighting that nearly doubles that of the SPY’s, making it the second-largest single sector weighting difference between the two funds. RSP’s aforementioned overweight to the industrials sector has caused a significant drag on the fund as industrials (XLI) is one of the worst-performing sectors so far into 2020, down -15.24%. That said, SPY’s relatively low weighting of 7.94% has shielded the cap-weighted fund from taking a bigger hit in performance. The second-best performing sector fund on a year-to-date basis is communication services, a high-RS sector that the SPY has a 10.95% allocation towards versus the RSP’s 4.44% weighting. Once again, this single sector overweight is the third-largest and has helped the SPY outperform so far this year. as comm services is up 4.25% year-to-date. As we often mention throughout our research, it is important to not only know what you own (S&P 500 stocks) but how you own it (cap versus equal weight). Additionally, in case of the SPY, we often find that outperformance is not just about what is owned or overweighted, such as technology and communication services, but is also about what is not owned or underweighted, like industrials and financials.