
Most Requested Symbols


| AWI Armstrong World Industries, Inc. ($70.85) - Building - Armstrong World Industries reversed lower today, breaking a double bottom at $72 to mark a third consecutive sell signal before declining further to $71. Today's break also signifies a negative trend reversal for the stock, demoting it to a 2 for 5'er. Supply is in control and long exposure should be avoided. Short sellers should note that support is offered at $70 and that AWI returns to a buy signal with a double top break at $77. |
| BAX Baxter International Inc. ($82.45) - Healthcare - Baxter International shares reversed lower today, breaking a spread triple bottom at $82 to mark a second consecutive sell signal. Today's break also signifies a negative trend reversal, demoting the stock to a 2 for 5 TA rating. BAX ranks 97th of 115 names included in the healthcare sector RS matrix and recently witnessed a flip to negative monthly momentum, suggesting the potential for further losses. The weight of the evidence is negative. Those with long exposure should move to the sidelines here. |
| CME CME Group, Inc. ($167.08) - Wall Street - CME shares reversed lower today, breaking a spread quadruple bottom at $170 to mark a second consecutive sell signal before declining further to $168. This 2 for 5'er moved to a negative trend earlier this month and ranks 20th of 22 names included in the wall street sector RS matrix. Additionally, weekly momentum has recently flipped negative, suggesting the potential for further losses. Supply is in control and long exposure should be avoided. Short sellers should note that support is offered at $164 and that CME carries a yield of 1.96%. |
| GPI Group 1 Automotive, Inc. ($58.62) - Autos and Parts - Group 1 Automotive shares broke a double bottom at $62 today to mark a second consecutive sell signal before declining further past support to $58. Despite this 5 for 5'er having returned to a positive trend in June and market RS buy signal in May, recent consecutive sell signals suggest that supply is in control in the near-term. No new positions at this time. From here, the bullish support line is found at $51. Note that earnings are expected on 7/23. |
| HCA HCA Healthcare Inc. ($94.15) - Healthcare - HCA Healthcare shares broke a double bottom at $96 today, marking a third consecutive sell signal before declining further past support to $94. Although this 2 for 5'er moved back to a positive trend in May and remains on a market RS buy signal since 2012, recent consecutive sell signals suggest that supply is in control. Additionally, HCA ranks 89th of 115 names included in the healthcare sector RS matrix and has recently witnessed a flip to negative weekly momentum, suggesting the potential for further decline. The weight of the evidence is negative. Avoid. |
| JWN Nordstrom, Inc. ($15.93) - Retailing - Nordstrom shares returned to a sell signal and negative trend with a double bottom break at $16 today. This trend reversal results in a demotion to a 0 for 5 TA rating, suggesting both absolute and relative weakness. Avoid long exposure. Short sellers should note that JWN tests support here. |
| MAXR Maxar Technologies Ltd. ($17.27) - Business Products - Maxar Technologies completed a bullish triangle at $17 today, marking a second consecutive buy signal. This strong 5 for 5'er returned to a positive trend and market RS buy signal in late May. Additionally, MAXR ranks 5th of 98 names included in the business products sector RS matrix. Demand is in control and long exposure may be added here. Note that support is offered at $15 and $14. |
| MDT Medtronic PLC ($89.20) - Healthcare - Medtronic shares reversed lower today, returning to a sell signal with a spread triple bottom break at $90 before declining further past support to $89. This 1 for 5'er moved to a negative trend in early June and ranks 91st of 115 names in included in the healthcare sector RS matrix. Additionally, weekly momentum has recently flipped negative, suggesting the potential for further losses. Supply is in control. Avoid. Short sellers should note that MDT carries a yield of 2.48% and returns to a buy signal/positive trend with a double top break at $96. |
| NWE NorthWestern Corporation ($52.38) - Utilities/Electricity - NorthWestern shares broke a spread triple bottom at $52 today, returning the stock to a sell signal. Today's break also signifies a negative trend reversal, demoting NWE to a 1 for 5'er. NEW has been on a market RS sell signal since December of 2017 and ranks 44th out of 48 names included in the utilities/electricity sector RS matrix. Supply is in control. Avoid long exposure. Short sellers should note that NEW carries a yield of 4.43% and finds support at $46. |
| THS TreeHouse Foods, Inc. ($44.43) - Food Beverages/Soap - Shares of THS continued lower on Wednesday to give a third consecutive sell signal with a double bottom break at $45. The move also marks a negative trend change for the stock, demoting it to a 1 for 5'er. Furthermore, THS resides in the average food beverage/soap sector and demonstrates long-term weakness relative to the market, remaining on an RS sell signal since November of 2016. The weight of the evidence is negative here. The next level of support can be found at $37 while resistance resides at $49. |

Each week the analysts at DWA review and comment on all major asset classes in the global markets. Shown below is the summary or snapshot of the primary technical indicators we follow for multiple areas. Should there be changes mid-week we will certainly bring these to your attention via the report.
| Universe | BP Col & Level (actual) | BP Rev Level | PT Col & Level (actual) | PT Rev Level | HiLo Col & Level (actual) | HiLo Rev Level | 10 Week Col & Level (actual) | 10 Week Rev Level | 30 Week Col & Level (actual) | 30 Week Rev Level |
|---|---|---|---|---|---|---|---|---|---|---|
| ALL |
|
64% |
|
40% |
|
84% |
|
82% |
|
34% |
| NYSE |
|
74% |
|
50% |
|
86% |
|
84% |
|
26% |
| OTC |
|
60% |
|
38% |
|
84% |
|
74% |
|
40% |
| World |
|
56% |
|
38% |
|
|
|
76% |
|
40% |
| Symbol | Name | Price | Yield | PnF Trend | RS Signal | RS Col. | Fund Score | 200 Day MA | Weekly Mom |
|---|---|---|---|---|---|---|---|---|---|
| DIA | SPDR Dow Jones Industrial Average ETF Trust | 261.50 | 2.29 | Positive | X | 3.39 | 263.21 | +11W | |
| EEM | iShares MSCI Emerging Markets ETF | 40.80 | 2.19 | Positive | Sell | O | 2.26 | 40.56 | +11W |
| EFA | iShares MSCI EAFE ETF | 62.11 | 2.63 | Positive | Sell | O | 1.22 | 63.20 | +11W |
| FM | iShares MSCI Frontier 100 ETF | 24.04 | 3.30 | Negative | Sell | O | 0.35 | 26.69 | +11W |
| IJH | iShares S&P MidCap 400 Index Fund | 178.66 | 1.80 | Positive | Buy | O | 2.46 | 184.56 | +11W |
| IJR | iShares S&P SmallCap 600 Index Fund | 67.97 | 1.74 | Positive | Buy | O | 2.10 | 73.40 | +11W |
| QQQ | Invesco QQQ Trust | 248.84 | 0.66 | Positive | Buy | X | 5.87 | 209.46 | +11W |
| RSP | Invesco S&P 500 Equal Weight ETF | 102.86 | 2.08 | Positive | Buy | X | 3.30 | 105.07 | +11W |
| SPY | SPDR S&P 500 ETF Trust | 312.05 | 1.83 | Positive | O | 3.84 | 301.58 | +11W | |
| XLG | Invesco S&P 500 Top 50 ETF | 240.34 | 1.51 | Positive | O | 4.75 | 222.62 | +11W |
It was a mixed bag in terms of price performance over the last week of trading as half of the major market funds covered in this report finished up for the week while the remaining half found themselves in the red. The best performing fund over the last seven days was the iShares MSCI Emerging Markets ETF EEM, up 3.21%, while the worst-performing fund was the iShares S&P SmallCap 600 Index Fund IJR, down -2.69% (through 6/23). Relatively speaking, US large caps continue to dominate all other areas of the equity markets, a leadership theme that is reflected in the year-to-date performance numbers for our lineup of major market funds with the Invesco QQQ Trust QQQ leading with an impressive gain of 17.04%, followed by the XLG and the SPY with respective returns of 2.98% and -3.05%.

In recent reports, we have continued to discuss the factors driving the wide performance dispersion between the top-performing fund, the QQQ, and the second-best performing fund, the XLG, including the superior strength of large-cap growth stocks relative to their large-cap value counterparts. Today, we want to bring your attention to another year-to-date performance dispersion that caught our eye – the +8% spread between that of the cap-weighted SPDR S&P 500 ETF Trust SPY and the equal-weighted Invesco S&P 500 Equal Weight ETF RSP.
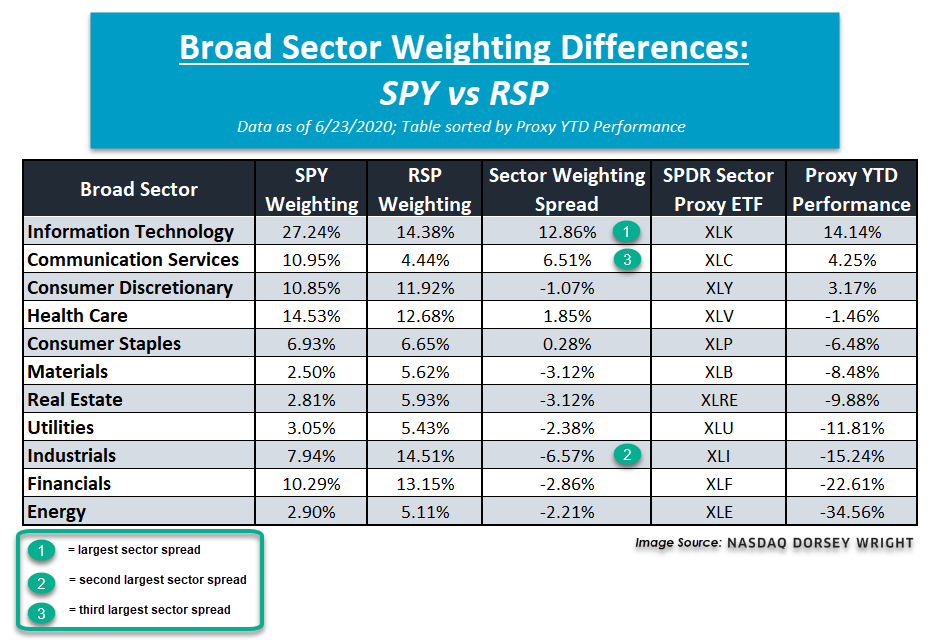
While the SPY and RSP provide exposure to the same basket of 500 stocks, the way in which each provides exposure is what makes them stand apart. The SPY is a cap-weighted fund, meaning the larger the stock's market cap, the higher the weighting in the fund. Conversely, the RSP gives all stocks the exact same weighting with no regard for market cap. When we drill down into the sector weightings for each of these two S&P 500-based funds, we find that there are significant differences in sector weightings between the SPY and the RSP, which we've broken down in the table below. Notice how the SPY is most heavily allocated to the technology sector at 27.24%, which is nearly 2x greater than the RSP’s 14.38% weighting. This spread of +12.86% is the largest sector weighting difference between the two funds and is one that has greatly benefitted the SPY as technology (XLK) is the top-performing SPDR sector fund so far this year, up 14.14%. On the other hand, the RSP is most heavily allocated to industrials at 14.51%, a weighting that nearly doubles that of the SPY’s, making it the second-largest single sector weighting difference between the two funds. RSP’s aforementioned overweight to the industrials sector has caused a significant drag on the fund as industrials (XLI) is one of the worst-performing sectors so far into 2020, down -15.24%. That said, SPY’s relatively low weighting of 7.94% has shielded the cap-weighted fund from taking a bigger hit in performance. The second-best performing sector fund on a year-to-date basis is communication services, a high-RS sector that the SPY has a 10.95% allocation towards versus the RSP’s 4.44% weighting. Once again, this single sector overweight is the third-largest and has helped the SPY outperform so far this year. as comm services is up 4.25% year-to-date. As we often mention throughout our research, it is important to not only know what you own (S&P 500 stocks) but how you own it (cap versus equal weight). Additionally, in case of the SPY, we often find that outperformance is not just about what is owned or overweighted, such as technology and communication services, but is also about what is not owned or underweighted, like industrials and financials.

SECTOR BULLISH PERCENT CHANGES
| Reversed to X | Reversed to O |
|---|---|
| 3 (BPBIOM | 58), (BPHEAL | 50), (BPSOFT | 70), |
5 (BPGAME | 70), (BPOIL | 52), (BPOILS | 50), (BPREAL | 72), (BPTRAN | 58), |
| To Xs | To Os |
|---|
Average Level
59.45
| Sector |
|---|
| None |
| Sector |
|---|
| Healthcare (50%) - Bull Confirmed |
| Sector |
|---|
| Aerospace Airline (66%) - Bear Alert |
| Autos & Parts (66%) - Bear Alert |
| Banks (60%) - Bear Alert |
| Business Products (64%) - Bear Alert |
| Chemicals (62%) - Bear Alert |
| Computers (54%) - Bull Correction |
| Electronics (60%) - Bear Alert |
| Utilities / Electric (54%) - Bull Correction |
| Foods Beverages/Soap (52%) - Bull Correction |
| Gaming (70%) - Bull Confirmed |
| Household Goods (72%) - Bull Confirmed |
| Insurance (60%) - Bear Alert |
| Leisure (54%) - Bear Alert |
| Machinery and Tools (62%) - Bear Alert |
| Oil (52%) - Bull Correction |
| Oil Service (50%) - Bull Correction |
| Protection Safety Eq (60%) - Bear Alert |
| Real Estate (72%) - Bull Confirmed |
| Restaurants (52%) - Bear Alert |
| Retailing (56%) - Bull Correction |
| Semiconductors (72%) - Bull Confirmed |
| Steel/Iron (56%) - Bull Correction |
| Textiles / Apparel (56%) - Bear Alert |
| Transports / Non Air (58%) - Bull Correction |
| Wall Street (70%) - Bull Confirmed |
SECTOR INDICATOR CHART CHANGES
PT is the percentage of stocks within a sector that are trading above their bullish support lines. RSX is the percentage of stocks within a sector whose relative strength charts are in a column of Xs. RSP is the percentage of stocks within a sector whose relative strength charts are on a buy signal. The strongest sectors, i.e. market leaders, will have most of these indicators positive and moving higher in a column of Xs.
|
There were only rising sector PT charts this week, with 6 rising and none moving lower. The following sector charts rose: Biomedics/Genetics [^PTBIOM], Internet [^PTINET], Media [^PTMEDI], Retailing [^PTRETA], Savings & Loans [^PTSAVI], Software [^PTSOFT]. No charts reversed in column. |
|
| ^PT Charts Reversing Up - | ^PT Charts Reversing Down - |
|
|
|
| ^PT Charts Moving Higher - | ^PT Charts Moving Lower - |
|
|
|
|
There were mostly RSX charts rising this week, with 14 rising and 11 moving lower. The following sector charts rose: Banks [^RSXBANK], Biomedics/Genetics [^RSXBIOM], Building [^RSXBUIL], Computers [^RSXCOMP]-Rev. , Drugs [^RSXDRUG]-Rev. , Electronics [^RSXELEC]-Rev. , Healthcare [^RSXHEAL]-Rev. , Internet [^RSXINET]-Rev. , Insurance [^RSXINSU], Precious Metals [^RSXPREC]-Rev. , Protection Safety Equipment [^RSXPROT], Steel/Iron [^RSXSTEE], Wall Street [^RSXWALL], Waste Management [^RSXWAST]. The following sector charts fell: Aerospace Airline [^RSXAERO], Forest Prods/Paper [^RSXFORE], Leisure [^RSXLEIS], Metals Non Ferrous [^RSXMETA]-Rev. , Oil [^RSXOIL], Oil Service [^RSXOILS], Real Estate [^RSXREAL]-Rev. , Restaurants [^RSXREST], Retailing [^RSXRETA], Semiconductors [^RSXSEMI], Textiles/Apparel [^RSXTEXT]. |
|
| ^RSX Charts Reversing Up - | ^RSX Charts Reversing Down - |
| ^RSX Charts Moving Higher - | ^RSX Charts Moving Lower - |
|
There were only rising sector RSP charts this week, with 12 rising and none moving lower. The following sector charts rose: Autos and Parts [^RSPAUTO], Building [^RSPBUIL], Finance [^RSPFINA], Gas Utilities [^RSPGUTI], Internet [^RSPINET], Machinery and Tools [^RSPMACH], Media [^RSPMEDI], Precious Metals [^RSPPREC], Protection Safety Equipment [^RSPPROT], Real Estate [^RSPREAL], Telephone [^RSPTELE], Waste Management [^RSPWAST]-Rev. . There were 1 that reversed to X. |
|
| ^RSP Charts Reversing Up - | ^RSP Charts Reversing Down - |
|
|
| ^RSP Charts Moving Higher - | ^RSP Charts Moving Lower - |
|
|
FAVORED SECTOR STATUS CHANGES
A sector is considered to be Favored if it has 3 or 4 of the sector indicators (Relative Strength, RSX, RSP, & PT) positive, Average if it has 2 of the 4 indicators positive, & Unfavored if it has 0 or 1 of the indicators positive. The table below contains those sectors that have experienced a Favored Sector Status change over the past week. It is best to focus on sectors that are about 50% or lower on their Bullish Percent charts & are in Xs. Note: If a sector moves from Favored to Average, it doesn't necessarily mean that the sector in question has to be sold - it just means you need to evaluate your individual positions with exposure to that sector.
| Changes since 06/17/2020 | Full Report |
|
|
|
|
|||||
|
|
|
|
|
|
|||
|
|
|
|
|
|||
|
|
|
|
|
|
|||
Remember, these are technical comments only. Just as you must be aware of fundamental data for the stocks we recommend based on technical criteria in the report, so too must you be aware of important data regarding delivery, market moving government releases, and other factors that may influence commodity pricing. We try to limit our technical comments to the most actively traded contracts in advance of delivery, but some contracts trade actively right up to delivery while others taper off well in advance. Be sure you check your dates before trading these contracts. For questions regarding this section or additional coverage of commodities email james.west@dorseywright.com.
Data represented in the table below is through 06/23/2020:
Broad Market Commodities Report
| Symbol | Name | Price | PnF Trend | RS Signal | RS Col. | 200 Day MA | Weekly Mom |
|---|---|---|---|---|---|---|---|
| CL/ | Crude Oil Continuous | 40.25 | Negative | Buy | X | 45.19 | +9W |
| DBLCIX | Deutsche Bank Liquid Commodities Index | 259.09 | Negative | Sell | O | 287.64 | +11W |
| DWACOMMOD | DWA Continuous Commodity Index | 451.95 | Negative | Buy | O | 460.24 | +10W |
| GC/ | Gold Continuous | 1784.60 | Positive | Buy | X | 1587.68 | -7W |
| HG/ | Copper Continuous | 2.66 | Negative | Buy | O | 2.56 | +10W |
| ZG/ | Corn (Electronic Day Session) Continuous | 324.50 | Negative | Buy | O | 360.59 | +8W |
While analogies continue to surface about the potential disconnect between the stock market and the economy, key reminders of the market being a leading indicator are also increasing in circulation. Although generally true, the stock market is not the sole leading indicator of economic expectations. In fact, probably to little surprise, there are a number of such indicators that take shape outside of equities, and in the commodity space. Today we will highlight copper, or “Doctor Copper” in market lingo, focusing largely on the recent technical improvements for this alternative leading indicator. As a refresher, copper is often referenced as a leading economic indicator due to its fundamental and wide-ranging application in industrial production and electrical equipment (source: investopedia.com). Rising demand for copper will typically manifest in higher market prices, consequently suggesting the potential for economic growth. According to the Eurasia Group, in the current environment, two large catalysts for copper demand stem from green and digital stimulus programs. This demand is centered predominantly in Asia and Europe as electric vehicles, 5G networks, and renewable power generation remain in focus (source: cnbc.com). As countries begin to work through the lingering effects of the COVID-19 epidemic, we note an increased demand for copper that has translated into an improved picture in the near-term.
From a technical perspective, the shorter-term chart ($0.02 scale) for Copper Continuous HG/ shows resounding strength on the back of six consecutive buy signals following its multi-year low of $2.12 that was established in March. Additionally, copper’s recent ascent back into a positive trend on this near-term chart set the stage for a further advance past resistance established in February of this year. HG/ has formed a double top at $2.66 and a further advance to $2.68 would offer additional bullish confirmation to the upside with a seventh consecutive buy signal. Support is offered at $2.56 on the $0.02 chart.

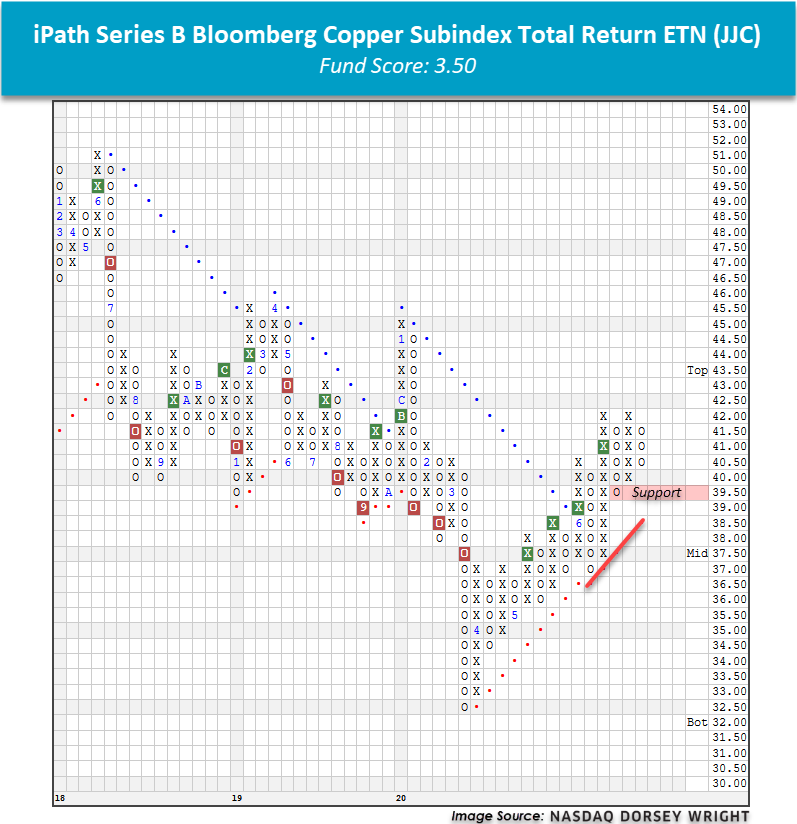
A similar picture of strength is displayed on the iPath Series B Bloomberg Copper Subindex Total Return ETN JJC. The note seeks to provide exposure to the Bloomberg Copper Subindex Total ReturnSM Index, which tracks unlevered futures contracts on copper. JCC displays similar chart action to HG/ and is on a fourth consecutive buy signal in a newly-established positive trend. Monthly momentum has recently flipped positive as well, suggesting the potential for further gains. JCC is actionable here with a solid fund score of 3.50 on the back of a positive score direction of 2.10. Note that support is offered at $39.50.

Average Level
32.10
| AGG | iShares US Core Bond ETF |
| USO | United States Oil Fund |
| DIA | SPDR Dow Jones Industrial Average ETF |
| DVY | iShares Dow Jones Select Dividend Index ETF |
| DX/Y | NYCE U.S.Dollar Index Spot |
| EFA | iShares MSCI EAFE ETF |
| FXE | Invesco CurrencyShares Euro Trust |
| GLD | SPDR Gold Trust |
| GSG | iShares S&P GSCI Commodity-Indexed Trust |
| HYG | iShares iBoxx $ High Yield Corporate Bond ETF |
| ICF | iShares Cohen & Steers Realty ETF |
| IEF | iShares Barclays 7-10 Yr. Tres. Bond ETF |
| LQD | iShares iBoxx $ Investment Grade Corp. Bond ETF |
| IJH | iShares S&P 400 MidCap Index Fund |
| ONEQ | Fidelity Nasdaq Composite Index Track |
| QQQ | Invesco QQQ Trust |
| RSP | Invesco S&P 500 Equal Weight ETF |
| IWM | iShares Russell 2000 Index ETF |
| SHY | iShares Barclays 1-3 Year Tres. Bond ETF |
| IJR | iShares S&P 600 SmallCap Index Fund |
| SPY | SPDR S&P 500 Index ETF Trust |
| TLT | iShares Barclays 20+ Year Treasury Bond ETF |
| GCC | WisdomTree Continuous Commodity Index Fund |
| VOOG | Vanguard S&P 500 Growth ETF |
| VOOV | Vanguard S&P 500 Value ETF |
| EEM | iShares MSCI Emerging Markets ETF |
| XLG | Invesco S&P 500 Top 50 ETF |
From the Analyst
Loading, Please Wait...
