Most Requested Symbols

There were no changes to any of the DWS models this week.
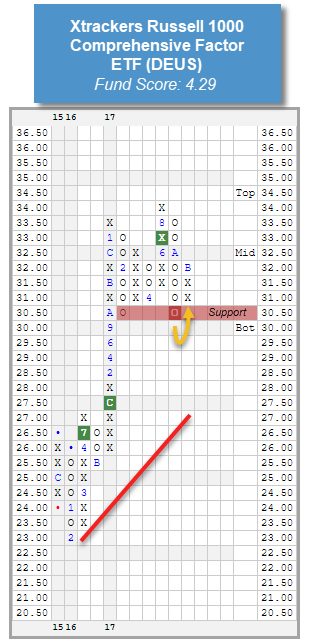
This week, we are going to take a look at the Xtrackers Russell 1000 Comprehensive Factor ETF DEUS. As a refresher, this fund seeks to follow the performance, before fees and expenses, of the Russell 1000 Comprehensive Factor Index, which filters through the Russell 1000 based on Quality, Value, Momentum, Low Volatility, and Size screens. This fund reached a new all-time high in August, before pulling back with the broader market in October, and ultimately finding support at the February low of $30.50. The fund has shown a rebound in early November with its reversal up into a column of Xs at $32. DEUS has been able to maintain a strong fund score throughout the market turbulence, most recently posting a score of 4.29. This is better than the average for Domestic Growth of 3.75 as well as the average for all US of 3.22. Weekly momentum also just flipped positive, indicating the potential for further price appreciation. Those looking to add domestic equity exposure can look to DEUS as an option to do so on this recent reversal upwards. Support can be found at $30.50.

The ETFs with the most relative strength buy signals (suggesting outperformance) versus the others in the group are listed at the top. These ETFs should be overweighted in the portfolio. Those ETFs with the least amount of relative strength buy signals versus the others in the group are listed at the bottom. These ETFs should be underweighted in the portfolio.
Deutsche Bank Matrix Summary
| Ticker | Name | Buys | Xs | Tech Attribute/ Score |
|---|---|---|---|---|
| DEUS.TR | Xtrackers Russell 1000 Comprehensive Factor ETF TR | 17 | 19 | 4.29 |
| DBJP.TR | Xtrackers MSCI Japan Hedged Equity ETF Total Return | 15 | 17 | 1.94 |
| CN.TR | Xtrackers MSCI All China Equity ETF TR | 13 | 4 | 0.35 |
| DEEF.TR | Xtrackers FTSE Developed EX US Comprehensive Factor ETF TR | 12 | 12 | 2.23 |
| DBEF.TR | Xtrackers MSCI EAFE Hedged Equity ETF Total Return | 10 | 15 | 2.20 |
| DBAP.TR | Xtrackers MSCI AC Asia Pacific ex Japan Hedged Equity Total Return | 10 | 8 | 1.51 |
| DBEZ.TR | Xtrackers MSCI Eurozone Hedged Equity ETF Total Return | 9 | 16 | 2.02 |
| DBUK.TR | Xtrackers MSCI United Kingdom Hedged Equity ETF Total Return | 9 | 11 | 2.42 |
| DBKO.TR | Xtrackers MSCI South Korea Hedged Equity ETF Total Return | 9 | 4 | 2.52 |
| DBEU.TR | Xtrackers MSCI Europe Hedged Equity ETF Total Return | 8 | 15 | 2.17 |
| JPN.TR | Deutsche X-trackers Japan JPX-Nikkei 400 Equity ETF TR | 8 | 9 | 1.50 |
| HDEF.TR | Deutsche X-trackers MSCI EAFE High Dividend Yield Hedged Equity ETF TR | 7 | 8 | 0.24 |
| DBAW.TR | Xtrackers MSCI All World ex US Hedged Equity ETF Total Return | 6 | 13 | 2.04 |
| DBGR.TR | Xtrackers MSCI Germany Hedged Equity ETF Total Return | 6 | 11 | 1.68 |
| HDAW.TR | Deutsche X-trackers MSCI All World ex US High Dividend Yield Hedged Equity ETF TR | 6 | 8 | 0.44 |
| DBEM.TR | Xtrackers MSCI Emerging Markets Hedged Equity ETF TR | 5 | 8 | 2.67 |
| GRMY.TR | X-Trackers Germany Equity ETF Total Return | 4 | 0 | 1.53 |
| EURZ.TR | Xtrackers Eurozone Equity ETF Total Return | 2 | 3 | 1.24 |
| ASHR.TR | Deutsche X-trackers Harvest CSI 300 China A-Shares ETF TR | 1 | 5 | 0.46 |
| ASHX.TR | Deutsche X-Trackers CSI 300 China A-Shares Hedged Equity ETF TR | 0 | 3 | 0.23 |
| ETF Name | Symbol | DWA Suggested Weighting | Yield | Date Added |
|---|---|---|---|---|
| X-Trackers Germany Equity ETF Total Return | GRMY.TR | 20.000% | 2.3220 | 05/01/2017 |
| Xtrackers Eurozone Equity ETF Total Return | EURZ.TR | 20.000% | 2.7450 | 05/21/2018 |
| Xtrackers MSCI All China Equity ETF TR | CN.TR | 20.000% | 1.0220 | 12/29/2017 |
| Xtrackers FTSE Developed EX US Comprehensive Factor ETF TR | DEEF.TR | 20.000% | 2.9520 | 05/21/2018 |
| Xtrackers Russell 1000 Comprehensive Factor ETF TR | DEUS.TR | 20.000% | 1.6140 | 07/13/2012 |
* - Dates prior to 9/6/2016, which is when the Xtrackers Global Model Portfolio became available in the DWS Weekly ETF Report, are representative of when the position was added to the backtested model.
| ETF Name | Symbol | DWA Suggested Weighting | Yield | Date Added |
|---|---|---|---|---|
| X-Trackers Germany Equity ETF Total Return | GRMY.TR | 25.000% | 2.3220 | 05/01/2017 |
| Xtrackers Eurozone Equity ETF Total Return | EURZ.TR | 25.000% | 2.7450 | 05/21/2018 |
| Xtrackers MSCI All China Equity ETF TR | CN.TR | 25.000% | 1.0220 | 12/29/2017 |
| Xtrackers FTSE Developed EX US Comprehensive Factor ETF TR | DEEF.TR | 25.000% | 2.9520 | 06/24/2016 |
* - Dates prior to 9/6/2016, which is when the Xtrackers All World Ex US Model Portfolio became available in the DWS Weekly ETF Report, are representative of when the position was added to the backtested model.
| ETF Name | Symbol | DWA Suggested Weighting | Yield | Date Added |
|---|---|---|---|---|
| Xtrackers MSCI Eurozone Hedged Equity ETF Total Return | DBEZ.TR | 33.333% | 2.1910 | 06/24/2016 |
| Xtrackers Eurozone Equity ETF Total Return | EURZ.TR | 33.333% | 2.7450 | 05/21/2018 |
| Xtrackers FTSE Developed EX US Comprehensive Factor ETF TR | DEEF.TR | 33.333% | 2.9520 | 12/29/2017 |
* - Dates prior to 9/6/2016, which is when the Xtrackers Developed Intl Equity Model Portfolio became available in the DWS Weekly ETF Report, are representative of when the position was added to the backtested model.

The DWA Monthly Currency Hedge Ratings are designed to provide you with an objective confidence rating for the major currency pairs. The ratings are based upon 3-12 month price momentum inputs, using monthly cross-rate data, and ratings range from 0-4. For currencies weakening and experiencing negative momentum relative to the US Dollar, the hedge rating will be high. For currencies strengthening and experiencing positive momentum relative to the US Dollar, the hedge rating will be low. The hedge percentage (Hedge %) can range from 0 - 100%. For currencies with a high hedge rating, a larger currency hedge exposure is indicated. The Hedge % uses a sliding scale in increments of 25%. For example, a currency with a Hedge Rating of 3 has a suggested Hedge % of 75%.


DWS (Tue.)
Loading, Please Wait...
