Growth focused assets in one corner, value oriented names in the other. October's back and forth action brought lots of changes worth talking about. Today we remind readers of the RS basics as well as some of the more "art" than science to reading important changes as they occur in real time.
Relative strength lies at the heart of nearly all Nasdaq Dorsey Wright strategies. Identifying those assets that are rising faster or falling slower (positive RS) and owning them over those areas that are rising slower or falling faster (negative RS) is the name of the game. Of course, there are different ways that you can choose these winning/losing assets, with some of them being more advantageous than others. One of the more prominent ways that the analyst team will home in on key RS matchups is through relative strength charts… charts which pit each member against each other to see who is stronger. These RS charts impact various areas of the platform (Fund Scores, Technical Attribute Scores, Matrix Rankings, etc.) so knowing how to read them is key. Today’s feature will detail some of the intricacies of relative strength chart analysis as well as discuss a handful of notable changes amidst market volatility over the last few weeks. For those of you who are already familiar with RS charts and their high-level calculations, feel free to skip ahead.
Relative Strength Charts: Back to the Basics
As mentioned previously, there are several different ways you can calculate relative strength (RS). For NDW, relative strength is a simple mathematical computation charted over time. Asset A divided by Asset B, multiplied by 100. For example, stock A-valued at $100- compared to stock B-valued at $50- would have an RS value of 200.
On its own, this value means nothing. You’ll never hear an NDW analyst say “the Apple to Microsoft RS reading is sitting at 63.8372 today… its time to buy!” What does matter, however, is how this value shifts over time. Going back to our example, if stock A were to rise to $150 while stock B stayed at $50, our quotient would now result in a value of 300 instead of our previously calculated 200. It is quite obvious which asset you would have rather owned. If this value decreases over time (say if stock B moved to a value of $75 while stock A stayed put at $100) then our RS reading would fall to 133.33, signaling outperformance from our denominator (stock B). Over time, plotting these changes in this simple RS calculation in a similar fashion to normal trend charts results in a picture we can take advantage of in security selection. It is easiest to think about assets that are moving up, but this same mathematical computation identifies stocks that are falling less during times of uncertainty.

RS Charts- October 2026 Changes
Not every RS chart is created equal. While it can be fun during down time around the office to peruse random comparisons, there are some that the analyst team will focus on as key indicators of strength. To give you an idea, some of the major relationships we will watch include:
- Sector vs. Cash (For example, XLK vs. MNYMKT), Sector Vs. Broad Index (XLP vs. SPX), Sector vs. Sector (XLP vs. XLY)
- Index vs. Index (SPX vs. SPXEWI), Index vs. Cash (SPX vs. MNYMKT)
- Asset Class Vs. Asset Class (SPX vs. ACWX, SPX vs. GLD)
- Factor vs factor (MTUM vs. SPLV), value vs. growth (VUG vs. VTV), etc.
While this is by no means an exhaustive list, it can provide some context to how many on the team keep track of different assets. Note, you can also observe different scales- with higher values requiring more movement. Just like trend charts, some scales “work” and some don’t. We will discuss this more in just a moment. Included below is a table of the different RS charts that flipped over the last few weeks, as well as who maintains both long- and short-term strength. Remember, in this table, movement “up” favors asset A, while movement “down” favors asset B.
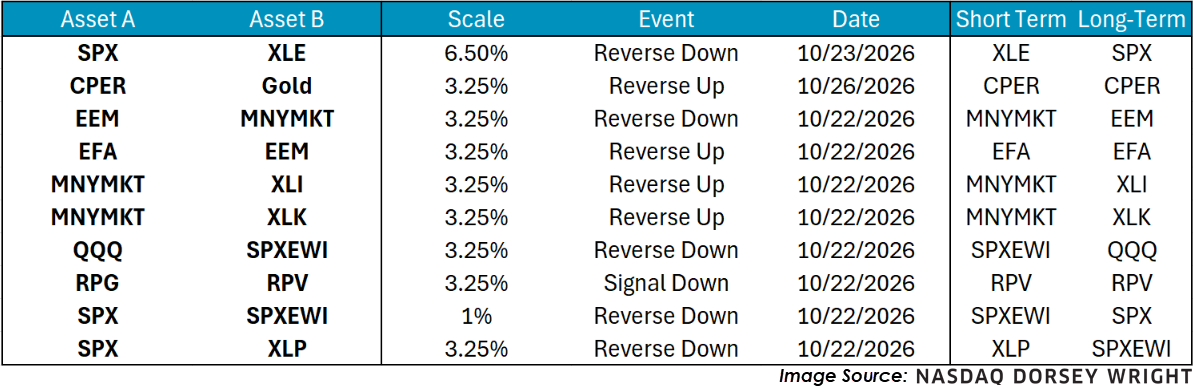
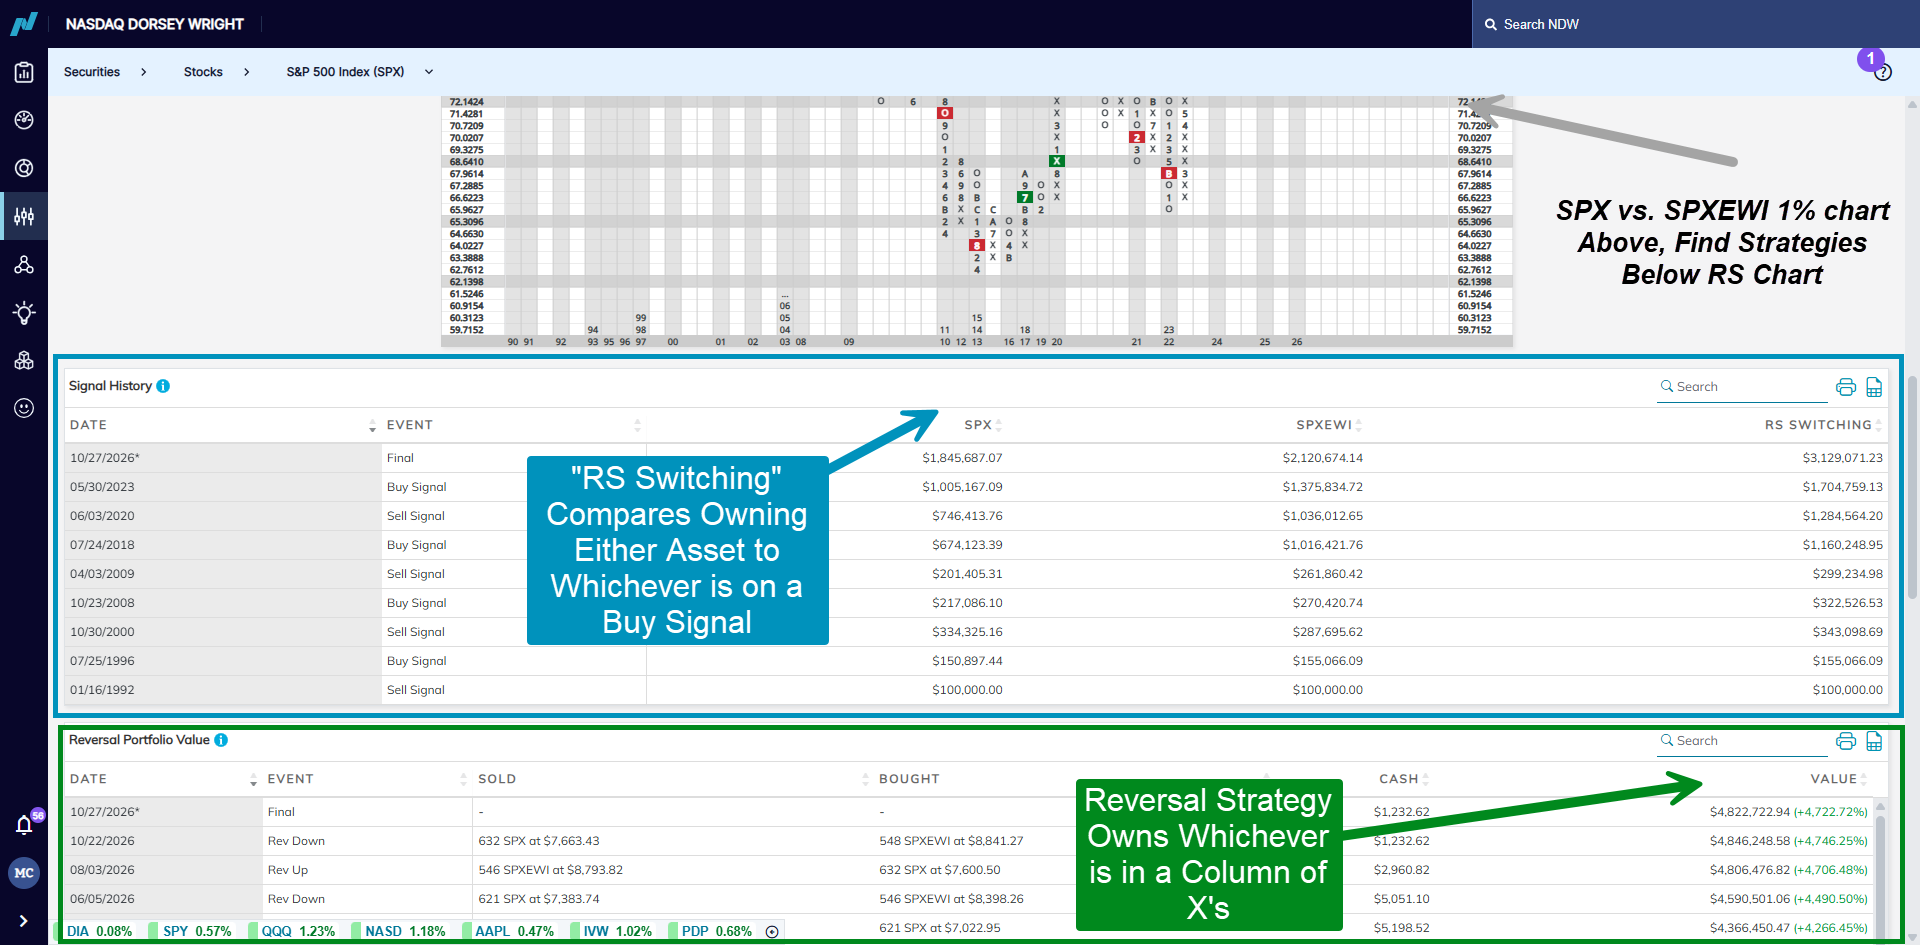
While 3.25% and 6.5% are by far the most “frequent” scales used within our RS analysis, that isn’t to say they are aways the “right” scales when it comes to picking winners and losers. In fact, of the 10 RS charts in the table above, four of them don’t produce profitable RS Switching strategies (owning whichever asset sits on a long-term buy signal.) The point is finding scales that are consistent over time… just use these relative landmarks (3.25% & 6.5%) as starting points when finding said consistency. Some scales (take for instance, a lot of the 6.5% scales) are insensitive to the rapid movements markets can throw at us… leading to years of market movement without a change in signal. In some cases, a more sensitive 3-box reversal can provide more insight into what “works”. To help guide you, NDW includes these hypothetical strategies beneath each RS chart. Said portfolios are a frequent first stop for many of the analysts when judging the validity of a specific RS chart. Where to find them is included in the screenshot below.
It is very important to remind you that we aren’t in the business of simply making an RS chart work for the sake of it working. Just like a regular trend chart, you can get an RS relationship to tell you whatever you want it to. For some, a 0.25% scale might yield the best results but ultimately produce a change once a day, far too frequently for most to make trading decisions. For others, it might “work” simply because there hasn’t been a change in years. So much for active management! Some charts might have worked in 9/10 cases but appear to underperform over the long-run because of the one missed signal. Point is, be careful about simply taking any of these hypothetical portfolios as gospel. For many of the analysts, they are jumping off points for other inquiries. If we see a sector reversing down against the broad S&P 500, we might dive deeper into why that is rather than rushing to write an article about the reversal alone.
All in all, the main takeaway from October’s reversals is an emerging preference for some areas outside of cap-weighted growth assets. While many of these areas still maintain long-term strength, it will be worth watching how this changes-if it does at all- as we close out 2026.