Most Requested Symbols

Nothing is constant except change, and markets continued to experience meaningful rotation during the third quarter. While the S&P 500 advanced 3.55%, performance varied significantly beneath the surface as investors shifted exposure across several sectors. With that in mind, how did sector leadership evolve during the quarter, and what does it suggest about the market heading into Q4?
NDW Morning Pulse - September 29, 2026
Below are highlights from the NDW Morning Update Video for the morning of 09/29. Access the video on the NDW Morning Update Video page.

Nothing is constant except change, and markets continued to experience meaningful rotation during the third quarter. While the S&P 500 advanced 3.55%, performance varied significantly beneath the surface as investors shifted exposure across several sectors. With that in mind, how did sector leadership evolve during the quarter, and what does it suggest about the market heading into Q4?
The third quarter produced generally positive results for domestic equities, though leadership looked notably different than it did at the start of the period. Energy delivered the strongest return among major sectors, gaining 17.53%, while healthcare and communication services followed with gains of 8.00% and 5.78%, respectively. Technology also finished higher, advancing 3.13% and once again sits atop the DALI sector rankings after falling as low as third during the quarter. On the other end of the spectrum, industrials, utilities, discretionary, real estate, and staples all produced negative returns over the quarter.

Performance across the major sectors drove several notable shifts within our DALI rankings, particularly among the market leaders. Healthcare posted the largest improvement these past few months, surging from eight to first as healthcare’s signal count climbed from 128 to 191 (from 06/22 to 9/28), before dropping to second place last week, firmly establishing the group among the market’s leadership cohort after a strong end of Q2. Technology maintained its spot at the top of the rankings despite more modest returns, while communication services continued to rank favorably and remain part of the market's leadership structure.
The largest deterioration occurred within industrials, which fell from second to sixth place over the quarter. Utilities also lost ground, slipping from fifth to eighth, while energy finished in fourth despite producing the strongest total return among major sectors. The divergence between performance and ranking highlights an important distinction: strong price appreciation alone does not always result in broad internal strength. Overall, the quarter's ranking changes suggest leadership broadened rather than rotated defensively, with healthcare joining technology and communication services among the market's strongest areas.

When evaluating the strength of a group or security, NDW primarily emphasizes long-term relative strength. However, short-term strength can often provide important clues regarding where strength may be headed. DALI's rankings are based on the long-term RS buy signal tally of a group, but we can also evaluate short-term strength using the cumulative RS column of Xs for each group. Doing so provides a useful view of which sectors might be primed for further strengthening or weakening.

Looking at the current strength map, the overall picture remains constructive despite the leadership changes that occurred during the quarter. Technology and healthcare have emerged as the clear leaders, maintaining some of the strongest combinations of both long-term and short-term relative strength. Communications, energy, financials, and basic materials also reside within the upper-right quadrant, indicating these sectors continue to exhibit favorable characteristics across multiple time horizons. Healthcare's position is particularly noteworthy given its sharp improvement in the DALI rankings, suggesting recent leadership has been supported by both improving participation and strong underlying relative strength.
There are, however, some notable divergences beneath the surface. Industrials remains one of the stronger sectors from a long-term perspective but has experienced a meaningful deterioration in short-term strength, placing it in the weakening quadrant. This loss of momentum helps explain the sector's decline in the DALI rankings during the quarter and bears monitoring should near-term weakness persist. Meanwhile, utilities, consumer cyclical, real estate, and consumer staples continue to rank among the weakest groups from both a short- and long-term relative strength standpoint, indicating leadership remains concentrated elsewhere in the market.
Overall, the strength map continues to support a favorable equity backdrop heading into the fourth quarter. Rather than signaling a defensive rotation, the strongest areas of the market remain concentrated in growth-oriented sectors such as technology and communications, while healthcare has emerged as an additional source of leadership. The broad presence of sectors within the leading quadrant suggests sector participation remains healthy and that market leadership has broadened rather than narrowed in recent months.
Technology shows both short- and long-term relative strength and recently reclaimed the top spot in our DALI sector rankings. The State Street Technology Select Sector SPDR ETF (XLK) reversed back into Xs versus the market earlier this month and generated its second consecutive buy signal after completing a spread triple-top breakout last week. Year-to-date (through 9/28), the fund has gained 35% and maintains favorable technical readings, including a fund score of 5.73 and a score direction of 2.24. The overall technical backdrop remains constructive, supporting a bullish bias. Key support levels are $180 and $168, while initial resistance stands at $198, representing the fund’s previous all-time high.

Average Level
-37.15
| < - -100 | -100 - -80 | -80 - -60 | -60 - -40 | -40 - -20 | -20 - 0 | 0 - 20 | 20 - 40 | 40 - 60 | 60 - 80 | 80 - 100 | 100 - > |
|---|---|---|---|---|---|---|---|---|---|---|---|
|
Sell signalief
|
|||||||||||
|
Sell signalhyg
|
Buy signalicf
|
Sell signalfxe
|
Buy signalVOOG
|
Buy signalUSO
|
|||||||
|
Sell signalagg
|
Buy signalijr
|
Buy signalrsp
|
Buy signaldia
|
Buy signalONEQ
|
Buy signaldx/y
|
||||||
|
Sell signalshy
|
Sell signaltlt
|
Buy signaliwm
|
Buy signalVOOV
|
Buy signalSPY
|
Buy signalxlg
|
Buy signalGSG
|
|||||
|
Sell signallqd
|
Sell signaldvy
|
Buy signalIJH
|
Buy signalgld
|
Buy signalefa
|
Sell signalEEM
|
Buy signalQQQ
|
Buy signalgcc
|
||||
| < - -100 | -100 - -80 | -80 - -60 | -60 - -40 | -40 - -20 | -20 - 0 | 0 - 20 | 20 - 40 | 40 - 60 | 60 - 80 | 80 - 100 | 100 - > |
| AGG | iShares US Core Bond ETF |
| USO | United States Oil Fund |
| DIA | SPDR Dow Jones Industrial Average ETF |
| DVY | iShares Dow Jones Select Dividend Index ETF |
| DX/Y | NYCE U.S.Dollar Index Spot |
| EFA | iShares MSCI EAFE ETF |
| FXE | Invesco CurrencyShares Euro Trust |
| GLD | SPDR Gold Trust |
| GSG | iShares S&P GSCI Commodity-Indexed Trust |
| HYG | iShares iBoxx $ High Yield Corporate Bond ETF |
| ICF | iShares Cohen & Steers Realty ETF |
| IEF | iShares Barclays 7-10 Yr. Tres. Bond ETF |
| LQD | iShares iBoxx $ Investment Grade Corp. Bond ETF |
| IJH | iShares S&P 400 MidCap Index Fund |
| ONEQ | Fidelity Nasdaq Composite Index Track |
| QQQ | Invesco QQQ Trust |
| RSP | Invesco S&P 500 Equal Weight ETF |
| IWM | iShares Russell 2000 Index ETF |
| SHY | iShares Barclays 1-3 Year Tres. Bond ETF |
| IJR | iShares S&P 600 SmallCap Index Fund |
| SPY | SPDR S&P 500 Index ETF Trust |
| TLT | iShares Barclays 20+ Year Treasury Bond ETF |
| GCC | WisdomTree Continuous Commodity Index Fund |
| VOOG | Vanguard S&P 500 Growth ETF |
| VOOV | Vanguard S&P 500 Value ETF |
| EEM | iShares MSCI Emerging Markets ETF |
| XLG | Invesco S&P 500 Top 50 ETF |

| Symbol | Company | Sector | Current Price | Action Price | Target | Stop | Notes |
|---|---|---|---|---|---|---|---|
| FR | First Industrial Realty Trust | Real Estate | $61.26 | mid-to-hi 60s | 86 | 59 | 4 for 5'er, top 25% of REAL sector matrix, LT pos peer RS, spread sextuple top, R-R>2.0, 2.9% yield |
| AME | Ametek Inc | Electronics | $251.67 | mid 230s - mid 250s | 342 | 204 | 4 for 5'er, LT pos mkt RS, bullish catapult, buy on pullback, R-R>2.0 |
| WELL | Welltower Inc. | Real Estate | $232.96 | low 230s to low 250s | 366 | 194 | 5 for 5'er since Feb. '24, top quintile of Real Est. matrix, Pos. trend since Feb. '24, buy on pullback. |
| CENTA | Central Garden & Pet Company | Household Goods | $34.23 | mid-to-hi 30s | 48 | 31 | 4 for 5'er, favored HOUS sector, LT pos peer RS, spread quad top, buy on pullback |
| CLH | Clean Harbors Inc | Waste Management | $313.26 | 310s - 320s | 356 | 288 | 5 for 5'er, #3 of 22 in WAST sector matrix, LT pos peer & mkt RS |
| ASC | Ardmore Shipping Corporation | Transports/Non Air | $18.15 | 17 - 19 | 24 | 15.50 | 5 for 5'er, top 20% of favored TRAN sector matrix, triple top, good R-R, 7.5% yield |
| ASX | ASE Industrial Holding Co., Ltd. Sponsored ADR | Semiconductors | $43.79 | hi 30s | 52 | 31 | 5 for 5'er, top 10% of SEMI sector matrix, LT pos peer & mkt RS, triple top, R-R~2.0 |
| MTCH | Match Group, Inc. | Leisure | $39.51 | low-to-mid 40s | 55 | 36 | 4 for 5'er, top 20% of LEIS sector matrix, one box from RS buy, triple top, 1.8% yield |
| FTNT | Fortinet Inc. | Software | $176.33 | hi 160s - hi 170s | 226 | 142 | 5 for 5'er, top third of favored SOFT sector matrix, LT pos mkt RS, spread quad top |
| CSTL | Castle Biosciences, Inc. | Biomedics/Genetics | $35.93 | 32 - 35 | 63.50 | 28 | 4 for 5'er, top 10% of favored BIOM sector matrix, multiple buy signals, pos trend flip, R-R~4.0 |
| GH | Guardant Health, Inc. | Biomedics/Genetics | $177.33 | low 170s to mid 180s | 236 | 140 | 5 for 5'er since May '26, top quintile of Biomedics matrix, pos. trend, ATH on 9/17. |
| ANET | Arista Networks Inc | Telephone | $204.92 | 190s - mid 210s | 262 | 178 | 5 for 5'er, top quintile of Telephone matrix, pos. trend, matched ATH on 9/25. |
| AVT | Avnet Inc | Electronics | $101.56 | hi 90s - low 100s | 125 | 85 | 4 for 5'er, top 10% of Elec. matrix, pos. trend, pos. LT Mkt RS, ATH 9/25. |
| Symbol | Company | Sector | Current Price | Action Price | Target | Stop | Notes |
|---|---|---|---|---|---|---|---|
| ADBE | Adobe Systems Incorporated | Software | $231.01 | (230s - 240s) | 192 | 268 | 2 for 5'er, bottom 25% of SOFT sector matrix, LT neg mkt & peer RS, spread triple bottom |
| Comment | |||||||
|---|---|---|---|---|---|---|---|
|
|
|||||||
AVT Avnet Inc ($101.39) - Electronics - Avnet has been a 4 for 5’er since February 2026 and currently ranks 3rd (out of 69) within the Electronics sector matrix. Along with positive near-term relative strength against the market and its peer group, AVT has maintained positive long-term market RS since May 2022. On the trend chart, AVT has maintained a positive trend since January this year and returned to a buy signal on 9/18. Last week’s trading brought the chart above resistance at $100 before rallying to a second buy signal and new all-time chart high at $104. Okay to consider in the upper $90 to mid-$100 range. The bullish price objective of $125 will serve as the price target, while the initial stop loss will be set for $85.
| 104.00 | X | 104.00 | |||||||||||||||||||||||||||
| 102.00 | X | X | 102.00 | ||||||||||||||||||||||||||
| 100.00 | X | X | O | X | 100.00 | ||||||||||||||||||||||||
| 99.00 | X | O | X | X | X | X | X | O | X | 99.00 | |||||||||||||||||||
| 98.00 | X | O | X | O | X | O | X | O | X | O | X | O | 98.00 | ||||||||||||||||
| 97.00 | X | O | X | O | X | O | X | O | X | O | X | 97.00 | |||||||||||||||||
| 96.00 | X | O | X | O | O | X | O | X | O | X | 96.00 | ||||||||||||||||||
| 95.00 | X | O | X | O | X | O | X | O | X | X | 95.00 | ||||||||||||||||||
| 94.00 | X | O | O | O | X | O | X | O | X | 94.00 | |||||||||||||||||||
| 93.00 | X | X | O | X | O | X | O | X | Mid | 93.00 | |||||||||||||||||||
| 92.00 | O | X | O | X | O | X | X | O | O | X | 92.00 | ||||||||||||||||||
| 91.00 | O | X | O | X | X | X | O | X | O | X | O | • | 91.00 | ||||||||||||||||
| 90.00 | O | O | X | O | X | O | 8 | O | X | O | X | • | 90.00 | ||||||||||||||||
| 89.00 | O | X | O | X | O | X | O | X | O | X | • | 89.00 | |||||||||||||||||
| 88.00 | O | O | X | X | O | X | O | X | O | X | • | 88.00 | |||||||||||||||||
| 87.00 | O | X | O | X | O | X | O | X | 9 | • | 87.00 | ||||||||||||||||||
| 86.00 | O | X | O | X | O | X | O | • | 86.00 | ||||||||||||||||||||
| 85.00 | 7 | X | O | X | O | X | • | 85.00 | |||||||||||||||||||||
| 84.00 | O | X | O | X | O | • | 84.00 | ||||||||||||||||||||||
| 83.00 | O | X | O | • | 83.00 | ||||||||||||||||||||||||
| 82.00 | O | X | • | 82.00 | |||||||||||||||||||||||||
| 81.00 | O | • | 81.00 |
| ASML ASML Holding NV ADR ($1,831.80) - Semiconductors - ASML inched higher to complete a double top break at $1792. The 3 for 5'er moved down from a 5 in July after reversing back into Os against the market and its peers. Although the stock has shown much improvement this year, ASML is still rated a hold in its technical attribute score. Continue monitoring for further improvement. Initial strong support is at $1584, with additional support at $1536. |
| LRCX Lam Research Corporation ($323.00) - Semiconductors - LRCX inched higher to complete a triple top break at $324. The 5 for 5'er moved up from a 4 with its latest move, after reversing back into a positive trend. Additionally, the stock ranks in the top half of the semiconductors sector matrix. Long exposure can be made here. Initial strong support is at $268, with additional suppor at $252. |
| ORCL Oracle Corporation ($138.16) - Software - ORCL reversed back up and completed a double top break at $142. The 1 for 5'er moved up from a 0 after reversing back into Xs against the market last month, and ranks in the top half of the software sector. Although ORCL has demonstrated some improvement in recent weeks, the stock is still rated a sell and is down over 27% year-to-date. Continue avoiding for the time being. Initial support is at $132, with additional support at $116. |
| P Everpure Inc. ($130.86) - Computers - P inched higher to complete a double top break at $132, marking its third consecutive buy signal. The 5 for 5'er moved up from a 4 earlier this month, after reversing back into Xs against the market. Additionally, the stock ranks first in the computers sector matrix. The weekly OBOS indicates that the stock is in overbought territory, so wait for a normalization of the 10-week trading band before considering. Initial support is at $124, with additional support at $96. |
| SHOP Shopify Inc ($147.62) - Retailing - SHOP completed a bullish triangle $146, marking its second consecutive buy signal. The 4 for 5'er moved up from a 3 earlier this month, after reversing back into a positive trend. Long exposure can be made here. Initial strong support can be seen between $136-$138, with additional strong support between $126-$128. |
| TSLA Tesla Inc. ($354.40) - Autos and Parts - TSLA inched lower to complete a double bottom break at $352. The 2 for 5'er moved down from a 3 with its latest move, after reversing back into a negative trend. Additionally, the stock ranks in the bottom half of the autos and parts sector matrix. Initial strong support is at $352, with additional support at $344. Strong resistance can be seen at $384. |

The option suggestions featured here are pulled from the NDW Options Ideas tool. These are just a sample of the ideas that can be found there. The Options Idea tool contains numerous additional income and speculative plays. It also offers relative strength-based screens targeting the highest (and lowest) relative strength stocks and ETFs that have recently moved counter to their longer-term trend. To access or subscribe to the Options Ideas tool, click here.
Call
AbbVie Inc (ABBV) Dec 18 $260 Call

| Additional Data: | |
| Bid/Ask Spread | 2.16% |
| Delta | 59.85 |
| Gamma | 1.16 |
| Implied Volatility | 28.17% |
| Expiry Date | 80 |
| Earnings Date | 10/29/2026 |
Put
Reddit Inc (RDDT) Dec 18 $145 Put
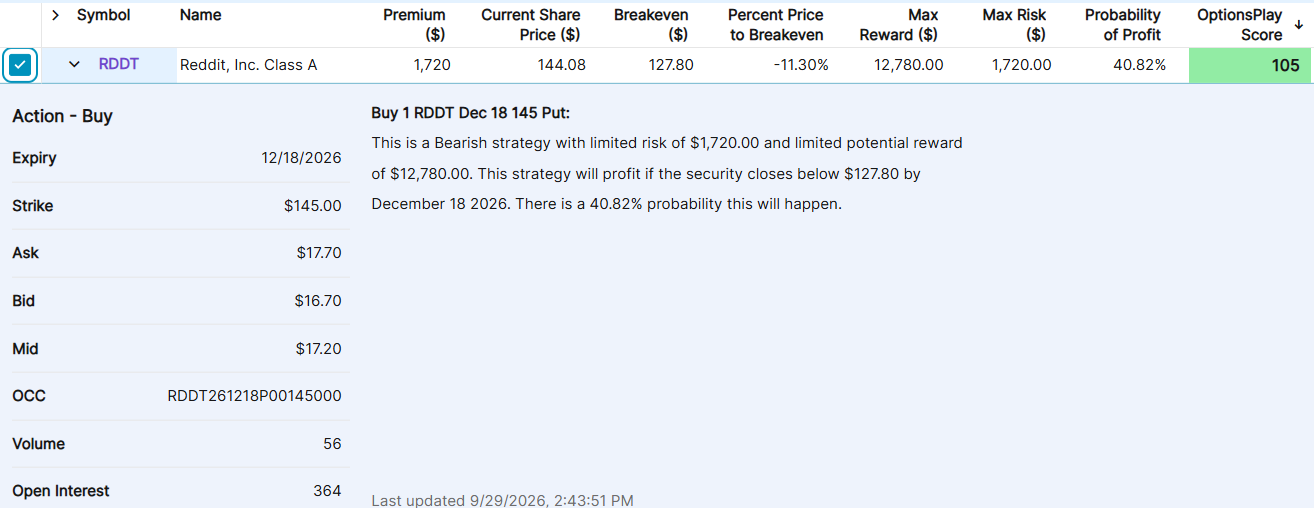
| Additional Data: | |
| Bid/Ask Spread | 5.99% |
| Delta | -43.69 |
| Gamma | 0.9 |
| Implied Volatility | 65.46% |
| Expiry Date | 80 |
| Earnings Date | 10/29/2026 |
Income
VanEck Semiconductors ETF (SMH) Oct 30 $570 Short Put

| Additional Data: | |
| Ann. Static Return | 21.51% |
| Bid/Ask Spread | 8.12 |
| Delta | 24.85 |
| Gamma | -0.48 |
| Implied Volatility | 34.66% |
| Expiry Date | 31 |
| Earnings Date | - |
Daily Equity & Market Analysis
Loading, Please Wait...

