Most Requested Symbols

Participation is moving into in no man’s land, as most indicators have substantially weakened, yet not enough to move into oversold territory.
NDW Morning Pulse - September 29, 2026
Below are highlights from the NDW Morning Update Video for the morning of 09/28/2026. Access the video on the NDW Morning Update Video page.

Regular check-ups are an essential part of ensuring your health and longevity, and one of the best ways to check-up on market health is through participation indicators. Higher levels mean more stocks are “participating” or contributing to upward price action, which is a net positive for markets. Meanwhile, lower levels or a decrease in participation can signal weakening of strength. So far, it has been a tale of two halves this quarter, with participation pushing higher before plummeting to levels not seen in several months. With so much movement over the last few months, where do the major indicators stand, and should they be cause for concern as we enter the fourth quarter?
Among the most sensitive metrics NDW regularly uses are the Ten Week indicators, which look at the percentage of stocks in a universe trading above their ten-week moving average. The indicator is often the first domino to fall among our participation indicators but is more prone to head fakes given its sensitivity. Looking at the Ten Week for the S&P 500 (^TWSPX), participation pushed to its highest level since January to start off the quarter, peaking at around 70%. Since then, near-term participation has declined precipitously, with 36% of SPX members trading above their 50-day MA. Such a decline in near-term participation is a bit concerning, especially as major markets sit near all-time highs. When TWSPX has been in a column of Os between 20% and 30%, markets have performed slightly below their one-year average. That said, movement below 20% could signal potentially washed-out territory, with forward returns being constructive in that area, especially following reversals back into Xs from that area.

Due to their sensitivity, short-term indicators can signal initial changes but gain more significance when confirmed by the movement of intermediate-term indicators. To evaluate intermediate-term participation, NDW uses “bullish percent” charts (BPs), which measure the percentage of stocks in a universe trading on a PnF buy signal. Looking at the Bullish Percent for S&P 500 stocks (^BPSPX), the indicator peaked at 70% before falling to a below-average level at 34%, mirroring the rise and fall of the TWSPX. Forward returns for the market have historically been subdued when BPSPX is in Os between 30% and 40%, with SPX averaging a one-year return of only 5.2%. Additionally, reversals from this territory have seen some of the worst market returns, averaging a negative return over the next year. That said, movement or reversals from below 30% have been a very different story, often signaling oversold conditions that have been much better for the S&P 500.

To confirm the movement of intermediate-term indicators, we compare them with the movement of long-term indicators. NDW evaluates longer-term participation with the Positive Trend indicators (PTs), which measure the percent of stocks trading in a positive trend on their PnF charts. Like the BP, the Positive Trend Percent for the S&P 500 (^PTSPX) rose initially this quarter before falling to levels not seen since April, currently sitting around 50%. Most of the market’s gains occur when PTSPX is above 50%, so the market’s ability to maintain or improve upon current levels will be a crucial factor in whether it can deliver a strong performance through the remainder of 2026. That said, the magnitude of market upside has been higher when PTSPX is outside the no man’s land between 40% and 60%. When trading in a column of Os around current levels, the S&P 500 has averaged a one-year return of only 2.5%. In contrast, readings above 60% or below 30% have been much more constructive, often seeing above-average returns going forward.

The fourth quarter has historically been the best period for the market, especially during midterm election years. Regardless of whether stocks match or exceed their usual rally during this quarter, participation will play a large role in market performance. Movement into washed-out territory, a rally back into higher territory, or even better, a combination of the two, would be positive signs for the market’s end-of-year outlook. However, with participation still in no man’s land, investors should remain cautious and watch for further signs of deterioration.
Average Level
-24.32
| < - -100 | -100 - -80 | -80 - -60 | -60 - -40 | -40 - -20 | -20 - 0 | 0 - 20 | 20 - 40 | 40 - 60 | 60 - 80 | 80 - 100 | 100 - > |
|---|---|---|---|---|---|---|---|---|---|---|---|
|
Buy signalUSO
|
|||||||||||
|
Sell signalhyg
|
Buy signalijr
|
Buy signalVOOG
|
|||||||||
|
Sell signalagg
|
Sell signaldvy
|
Buy signaldx/y
|
|||||||||
|
Sell signalshy
|
Sell signaltlt
|
Buy signalONEQ
|
|||||||||
|
Buy signalicf
|
Buy signaliwm
|
Buy signalrsp
|
Buy signaldia
|
Buy signalefa
|
Buy signalSPY
|
Buy signalxlg
|
Buy signalGSG
|
||||
|
Sell signalief
|
Sell signallqd
|
Sell signalfxe
|
Buy signalIJH
|
Buy signalVOOV
|
Buy signalgld
|
Sell signalEEM
|
Buy signalQQQ
|
Buy signalgcc
|
|||
| < - -100 | -100 - -80 | -80 - -60 | -60 - -40 | -40 - -20 | -20 - 0 | 0 - 20 | 20 - 40 | 40 - 60 | 60 - 80 | 80 - 100 | 100 - > |
| AGG | iShares US Core Bond ETF |
| USO | United States Oil Fund |
| DIA | SPDR Dow Jones Industrial Average ETF |
| DVY | iShares Dow Jones Select Dividend Index ETF |
| DX/Y | NYCE U.S.Dollar Index Spot |
| EFA | iShares MSCI EAFE ETF |
| FXE | Invesco CurrencyShares Euro Trust |
| GLD | SPDR Gold Trust |
| GSG | iShares S&P GSCI Commodity-Indexed Trust |
| HYG | iShares iBoxx $ High Yield Corporate Bond ETF |
| ICF | iShares Cohen & Steers Realty ETF |
| IEF | iShares Barclays 7-10 Yr. Tres. Bond ETF |
| LQD | iShares iBoxx $ Investment Grade Corp. Bond ETF |
| IJH | iShares S&P 400 MidCap Index Fund |
| ONEQ | Fidelity Nasdaq Composite Index Track |
| QQQ | Invesco QQQ Trust |
| RSP | Invesco S&P 500 Equal Weight ETF |
| IWM | iShares Russell 2000 Index ETF |
| SHY | iShares Barclays 1-3 Year Tres. Bond ETF |
| IJR | iShares S&P 600 SmallCap Index Fund |
| SPY | SPDR S&P 500 Index ETF Trust |
| TLT | iShares Barclays 20+ Year Treasury Bond ETF |
| GCC | WisdomTree Continuous Commodity Index Fund |
| VOOG | Vanguard S&P 500 Growth ETF |
| VOOV | Vanguard S&P 500 Value ETF |
| EEM | iShares MSCI Emerging Markets ETF |
| XLG | Invesco S&P 500 Top 50 ETF |

| Symbol | Company | Sector | Current Price | Action Price | Target | Stop | Notes |
|---|---|---|---|---|---|---|---|
| FR | First Industrial Realty Trust | Real Estate | $61.17 | mid-to-hi 60s | 86 | 59 | 4 for 5'er, top 25% of REAL sector matrix, LT pos peer RS, spread sextuple top, R-R>2.0, 2.9% yield |
| AME | Ametek Inc | Electronics | $250.74 | mid 230s - mid 250s | 342 | 204 | 4 for 5'er, LT pos mkt RS, bullish catapult, buy on pullback, R-R>2.0 |
| WELL | Welltower Inc. | Real Estate | $231.37 | low 230s to low 250s | 366 | 194 | 5 for 5'er since Feb. '24, top quintile of Real Est. matrix, Pos. trend since Feb. '24, buy on pullback. |
| CENTA | Central Garden & Pet Company | Household Goods | $34.07 | mid-to-hi 30s | 48 | 31 | 4 for 5'er, favored HOUS sector, LT pos peer RS, spread quad top, buy on pullback |
| CLH | Clean Harbors Inc | Waste Management | $313.04 | 310s - 320s | 356 | 288 | 5 for 5'er, #3 of 22 in WAST sector matrix, LT pos peer & mkt RS |
| ASC | Ardmore Shipping Corporation | Transports/Non Air | $17.85 | 17 - 19 | 24 | 15.50 | 5 for 5'er, top 20% of favored TRAN sector matrix, triple top, good R-R, 7.5% yield |
| ASX | ASE Industrial Holding Co., Ltd. Sponsored ADR | Semiconductors | $44.31 | hi 30s | 52 | 31 | 5 for 5'er, top 10% of SEMI sector matrix, LT pos peer & mkt RS, triple top, R-R~2.0 |
| MTCH | Match Group, Inc. | Leisure | $40.56 | low-to-mid 40s | 55 | 36 | 4 for 5'er, top 20% of LEIS sector matrix, one box from RS buy, triple top, 1.8% yield |
| FTNT | Fortinet Inc. | Software | $173.46 | hi 160s - hi 170s | 226 | 142 | 5 for 5'er, top third of favored SOFT sector matrix, LT pos mkt RS, spread quad top |
| CSTL | Castle Biosciences, Inc. | Biomedics/Genetics | $35.81 | 32 - 35 | 63.50 | 28 | 4 for 5'er, top 10% of favored BIOM sector matrix, multiple buy signals, pos trend flip, R-R~4.0 |
| GH | Guardant Health, Inc. | Biomedics/Genetics | $177.25 | low 170s to mid 180s | 236 | 140 | 5 for 5'er since May '26, top quintile of Biomedics matrix, pos. trend, ATH on 9/17. |
| ANET | Arista Networks Inc | Telephone | $206.55 | 190s - mid 210s | 262 | 178 | 5 for 5'er, top quintile of Telephone matrix, pos. trend, matched ATH on 9/25. |
| Symbol | Company | Sector | Current Price | Action Price | Target | Stop | Notes |
|---|---|---|---|---|---|---|---|
| ADBE | Adobe Systems Incorporated | Software | $235.47 | (230s - 240s) | 192 | 268 | 2 for 5'er, bottom 25% of SOFT sector matrix, LT neg mkt & peer RS, spread triple bottom |
| Symbol | Company | Sector | Current Price | Action Price | Target | Stop | Notes |
|---|---|---|---|---|---|---|---|
| NET | Cloudflare Inc Class A | Internet | $349.02 | 308 - 336 | 408 | 268 | NET has fallen to a sell signal. OK to hold here. Raise stop to $300. |
| Comment | |||||||
|---|---|---|---|---|---|---|---|
|
|
|||||||
ADBE Adobe Systems Incorporated R ($230.99) - Software - ADBE is a 2 for 5'er that ranks in the bottom quartile of the software sector matrix and has been on market and peer RS sell signals since 2021 and 2024, respectively. On its default chart, ADBE fell to a negative trend earlier this month and gave a second consecutive sell signal last week when it broke a spread triple bottom at $240. Short exposure may be added in the $230s to $240s and we will set our initial stop at $268. We will use the bearish price objective, $192, as our target price.
| 292.00 | X | X | • | 292.00 | |||||||||||||||||||||||||
| 288.00 | • | X | O | X | O | • | 288.00 | ||||||||||||||||||||||
| 284.00 | • | X | O | X | O | • | 284.00 | ||||||||||||||||||||||
| 280.00 | • | X | 9 | O | 280.00 | ||||||||||||||||||||||||
| 276.00 | • | X | O | 276.00 | |||||||||||||||||||||||||
| 272.00 | X | • | X | X | X | O | 272.00 | ||||||||||||||||||||||
| 268.00 | X | O | • | X | O | X | O | X | O | 268.00 | |||||||||||||||||||
| 264.00 | 6 | O | • | X | X | O | X | O | X | O | X | 264.00 | |||||||||||||||||
| 260.00 | X | O | • | X | O | X | X | O | X | O | X | O | X | O | 260.00 | ||||||||||||||
| 256.00 | X | O | • | X | O | 8 | O | X | O | O | X | O | X | O | Mid | 256.00 | |||||||||||||
| 252.00 | X | O | • | X | O | X | O | X | O | O | X | O | 252.00 | ||||||||||||||||
| 248.00 | X | O | • | X | O | X | O | • | O | X | O | 248.00 | |||||||||||||||||
| 244.00 | X | O | • | X | O | • | O | O | 244.00 | ||||||||||||||||||||
| 240.00 | O | X | X | • | O | 240.00 | |||||||||||||||||||||||
| 236.00 | O | X | O | X | • | O | 236.00 | ||||||||||||||||||||||
| 232.00 | O | X | X | O | X | • | 232.00 | ||||||||||||||||||||||
| 228.00 | O | X | X | O | X | O | X | • | 228.00 | ||||||||||||||||||||
| 224.00 | O | X | O | X | O | X | O | X | • | 224.00 | |||||||||||||||||||
| 220.00 | O | X | O | X | O | O | X | • | 220.00 | ||||||||||||||||||||
| 216.00 | O | X | O | O | X | • | 216.00 | ||||||||||||||||||||||
| 212.00 | O | 7 | O | • | 212.00 | ||||||||||||||||||||||||
| 208.00 | O | X | X | • | 208.00 | ||||||||||||||||||||||||
| 204.00 | O | X | O | X | • | 204.00 | |||||||||||||||||||||||
| 200.00 | O | X | O | X | X | • | 200.00 | ||||||||||||||||||||||
| 198.00 | O | O | X | O | X | • | 198.00 | ||||||||||||||||||||||
| 196.00 | O | X | O | X | • | Bot | 196.00 | ||||||||||||||||||||||
| 194.00 | O | X | O | X | • | 194.00 | |||||||||||||||||||||||
| 192.00 | O | O | • | 192.00 |
| EGO Eldorado Gold Corporation ($39.83) - Precious Metals - EGO gave an initial sell signal Monday when it broke a double bottom at $39. The outlook for the stock remains positive, however, as EGO is a 4 for 5'er that ranks in the top quintile of the precious metals sector matrix. From here, the next level of support is EGO's trend line at $33. |
| FNV Franco-Nevada Corp. ($249.62) - Precious Metals - FNV fell to a sell signal Monday when it broke a triple bottom at $252. The technical outlook remains positive despite Monday's move as FNV is a 4 for 5'er and ranks in the top third of the precious metals sector matrix. From here, the next level of support sits at $232. |
| PAAS Pan American Silver Corp ($46.16) - Precious Metals - PAAS gave a second consecutive sell signal and fell to a negative trend Monday when it broke a spread triple bottom at $46. The outlook for the stock remains modestly positive as even with the negative trend change PAAS is an acceptable 3 for 5'er. From here, the next level of support sits at $42. |

The option suggestions featured here are pulled from the NDW Options Ideas tool. These are just a sample of the ideas that can be found there. The Options Idea tool contains numerous additional income and speculative plays. It also offers relative strength-based screens targeting the highest (and lowest) relative strength stocks and ETFs that have recently moved counter to their longer-term trend. To access or subscribe to the Options Ideas tool, click here.
Call
Chevron Corp (CVX) Dec 18 $200 Call

| Additional Data: | |
| Bid/Ask Spread | 1.45% |
| Delta | 65.86 |
| Gamma | 1.55 |
| Implied Volatility | 27.55% |
| Expiry Date | 81 |
| Earnings Date | 10/30/2026 |
Put
Rocket Companies (RKT) Dec $18 $12 Put

| Additional Data: | |
| Bid/Ask Spread | 2.08% |
| Delta | -46.05 |
| Gamma | 11.58 |
| Implied Volatility | 61.97% |
| Expiry Date | 81 |
| Earnings Date | 11/5/2026 |
Income
Palantir Technologies (PLTR) Oct 30 $172.50 Short Put
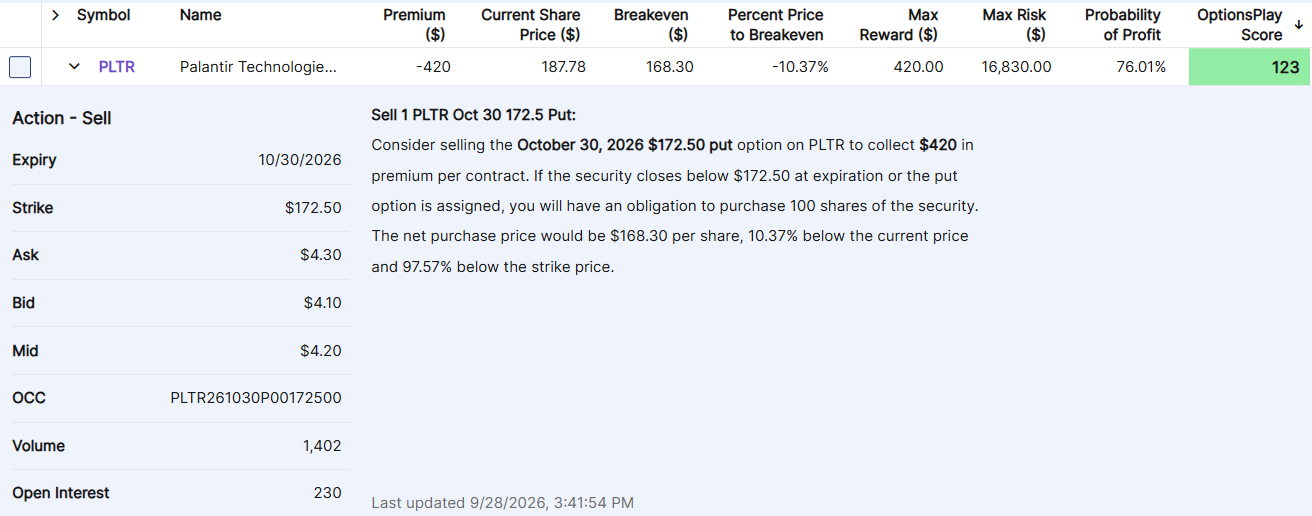
| Additional Data: | |
| Ann. Static Return | 28.45% |
| Bid/Ask Spread | 4.88 |
| Delta | 24.53 |
| Gamma | -1.17 |
| Implied Volatility | 46.97% |
| Expiry Date | 32 |
| Earnings Date | 11/2/2026 |
Daily Equity & Market Analysis
Loading, Please Wait...

