Most Requested Symbols

As Q3 nears a close, maybe surprisingly one of the worst performing sectors over the last few months has been industrials. Downside trading has brought the market relative strength chart into a column of Os, highlighting near-term underperformance by the fund relative to the broader market.
NDW Morning Pulse - September 25, 2026
Below are highlights from the NDW Morning Update Video for the morning of 09/25. Access the video on the NDW Morning Update Video page.

As Q3 nears a close, maybe surprisingly one of the worst performing sectors over the last few months has been industrials. The State Street Industrial Select Sector SDPR Fund (XLI) has fallen more than 8% during the third quarter (through 9/24), second worst only to utilities. This figure marks the worst quarter since June 2022 and worst Q3 performance since 2011. Much of the downside within the sector has come since mid-August, following a rally to all-time chart highs in the upper $180s. The trend chart returned to a sell signal at $174 to kick off September before falling into the upper $160s, taking out support that had been in place since May of this year. Downside trading has brought the market relative strength chart into a column of Os, highlighting near-term underperformance by the fund relative to the broader market.
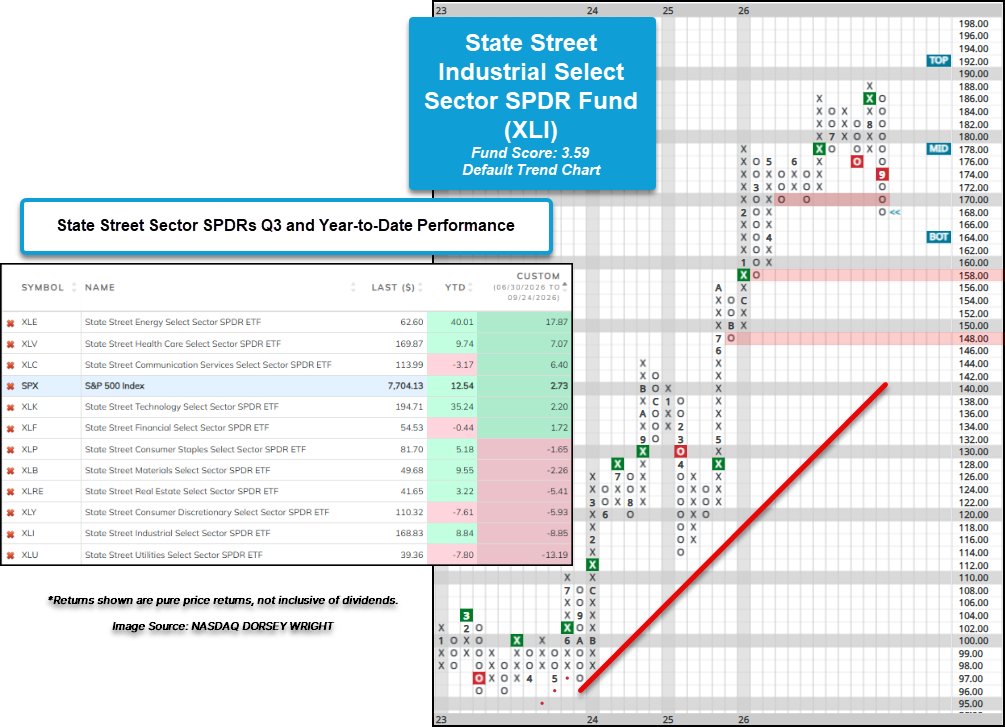
With the broader sector seeing downside, participation has seen a shift with many of the technical indicators for the broader sector seeing recent drops to their lowest levels since March or April of this year. When XLI was marking a new all-time chart high on the chart, it did so with roughly half (50%) of the stocks within the broader sector maintaining a point and figure buy signal. Trading since has brought the bullish percent for the sector (^BPECINDUST) down to the mid-30s to mark its lowest level since April this year, suggesting that just roughly 1/3rd of the stocks maintain a buy signal as of close on 9/24. Along with a decline in stocks maintaining buy signals, the long-term positive trend indicator for the broader sector (^PTECINDUST) has similarly fallen from 50% on the chart down to the upper 30% range. Bear in mind, both indicators mentioned have yet to reach oversold territory like the short-term 10-week, which has dropped below 30%. All still reside above extreme oversold territory last witnessed in early 2025, but the negative performance and participation deterioration has impacted the long-term relative strength picture for the sector as well.

On the Asset Class Group Scores page - which is used to measure intermediate-term relative strength and trending characteristic of asset groups consisting of ETFs and mutual funds – the industrials group has fallen to just above the all-important 3 score threshold (utilizing the fund score system range from 0 to 6). This comes after the group had scored above 4 for most of the last 12 months. Although the Asset Class Group Scores page places industrials on the cusp of maintaining a positive technical picture in the intermediate-term, the long-term relative strength sector rankings within the Dynamic Asset Level Investing (DALI) tool have seen a notable change in strength for industrials.

Following Monday’s (9/21) trading, the industrials sector fell to 6th (out of 11) within the DALI sector rankings, marking the first time since mid-2022 that the sector fell into the bottom half of overall rankings. Although, technology and communication services still reside within the top half of the DALI sector rankings, industrial’s move out of the top five gives the DALI sector rankings a more risk-off tilt with the likes of healthcare, energy, and financials among the upper echelon.

Given industrials fall into the bottom half of the DALI sector rankings, the tables below examine the forward performance of the State Street Industrial Select Sector SPDR Fund (XLI) whenever the sector moves above and below the bottom half of the rankings. Given the turning point the ranking serves, forward performance in the short-term tends to be mixed to negative. This highlights that the mid-point of the DALI sector rankings have historically served as either the beginning of long-term deterioration or a near-term floor, with the latter occurring more often in recent years when examining the sector ranking history back to the beginning of 2003. The main difference in forward returns is highlighted within the intermediate with 1- to 6-month forward returns, showing these periods prove to be the inflection point in whether improvement or deterioration continues. With most of the extended periods of industrials ranking low within the DALI occurring in the decade encompassing 2003 to 2013 and only one extending past a year within the past decade (2016 – present), investors may see the recent drop in the rankings as potentially a near-term floor for recent downside action. While recent history suggests that may the case, it will be important to check in roughly a month from now to see if industrials have continued lower or improved in the DALI rankings. A continued fall within the rankings may be signs of additional downside to come in 3 to 6 months, while improvement in the rankings is a sign the sector has found its footing.


| Symbol | Name | Price | Yield | PnF Trend | RS Signal | RS Col. | Fund Score | 200 Day MA | Weekly Mom |
|---|---|---|---|---|---|---|---|---|---|
| DIA | State Street SPDR Dow Jones Industrial Average ETF Trust | 512.68 | 1.38 | Positive | Sell | X | 3.77 | 501.82 | - 4W |
| EEM | iShares MSCI Emerging Markets ETF | 67.25 | 1.94 | Positive | Buy | X | 4.85 | 62.61 | - 1W |
| EFA | iShares MSCI EAFE ETF | 104.50 | 3.08 | Positive | Sell | X | 3.95 | 102.35 | - 3W |
| IJH | iShares S&P MidCap 400 Index Fund | 72.73 | 1.18 | Positive | Buy | O | 3.84 | 72.28 | - 5W |
| IJR | iShares S&P SmallCap 600 Index Fund | 137.78 | 1.14 | Positive | Sell | X | 3.72 | 135.28 | - 11W |
| QQQ | Invesco QQQ Trust | 741.10 | 0.46 | Positive | Buy | X | 5.71 | 664.99 | + 1W |
| RSP | Invesco S&P 500 Equal Weight ETF | 210.26 | 1.46 | Positive | Sell | O | 2.88 | 205.24 | - 4W |
| SPY | State Street SPDR S&P 500 ETF Trust | 767.18 | 0.98 | Positive | Buy | X | 5.34 | 718.01 | - 3W |
| XLG | Invesco S&P 500 Top 50 ETF | 63.92 | 0.67 | Positive | Sell | X | 4.35 | 60.11 | + 1W |

Average Level
-32.56
| < - -100 | -100 - -80 | -80 - -60 | -60 - -40 | -40 - -20 | -20 - 0 | 0 - 20 | 20 - 40 | 40 - 60 | 60 - 80 | 80 - 100 | 100 - > |
|---|---|---|---|---|---|---|---|---|---|---|---|
|
Sell signalief
|
|||||||||||
|
Sell signalagg
|
Buy signalicf
|
Buy signaliwm
|
Buy signalONEQ
|
||||||||
|
Sell signalshy
|
Buy signalijr
|
Sell signalfxe
|
Buy signalxlg
|
||||||||
|
Sell signalhyg
|
Sell signaltlt
|
Buy signalrsp
|
Buy signalVOOV
|
Sell signalEEM
|
Buy signalQQQ
|
||||||
|
Sell signallqd
|
Sell signaldvy
|
Buy signalIJH
|
Buy signaldia
|
Buy signalefa
|
Buy signalgld
|
Buy signalSPY
|
Buy signalVOOG
|
Buy signaldx/y
|
Buy signalUSO
|
Buy signalGSG
|
Buy signalgcc
|
| < - -100 | -100 - -80 | -80 - -60 | -60 - -40 | -40 - -20 | -20 - 0 | 0 - 20 | 20 - 40 | 40 - 60 | 60 - 80 | 80 - 100 | 100 - > |
| AGG | iShares US Core Bond ETF |
| USO | United States Oil Fund |
| DIA | SPDR Dow Jones Industrial Average ETF |
| DVY | iShares Dow Jones Select Dividend Index ETF |
| DX/Y | NYCE U.S.Dollar Index Spot |
| EFA | iShares MSCI EAFE ETF |
| FXE | Invesco CurrencyShares Euro Trust |
| GLD | SPDR Gold Trust |
| GSG | iShares S&P GSCI Commodity-Indexed Trust |
| HYG | iShares iBoxx $ High Yield Corporate Bond ETF |
| ICF | iShares Cohen & Steers Realty ETF |
| IEF | iShares Barclays 7-10 Yr. Tres. Bond ETF |
| LQD | iShares iBoxx $ Investment Grade Corp. Bond ETF |
| IJH | iShares S&P 400 MidCap Index Fund |
| ONEQ | Fidelity Nasdaq Composite Index Track |
| QQQ | Invesco QQQ Trust |
| RSP | Invesco S&P 500 Equal Weight ETF |
| IWM | iShares Russell 2000 Index ETF |
| SHY | iShares Barclays 1-3 Year Tres. Bond ETF |
| IJR | iShares S&P 600 SmallCap Index Fund |
| SPY | SPDR S&P 500 Index ETF Trust |
| TLT | iShares Barclays 20+ Year Treasury Bond ETF |
| GCC | WisdomTree Continuous Commodity Index Fund |
| VOOG | Vanguard S&P 500 Growth ETF |
| VOOV | Vanguard S&P 500 Value ETF |
| EEM | iShares MSCI Emerging Markets ETF |
| XLG | Invesco S&P 500 Top 50 ETF |
| Symbol | Company | Sector | Current Price | Action Price | Target | Stop | Notes |
|---|---|---|---|---|---|---|---|
| FR | First Industrial Realty Trust | Real Estate | $61.36 | mid-to-hi 60s | 86 | 59 | 4 for 5'er, top 25% of REAL sector matrix, LT pos peer RS, spread sextuple top, R-R>2.0, 2.9% yield |
| AME | Ametek Inc | Electronics | $247.74 | mid 230s - mid 250s | 342 | 204 | 4 for 5'er, LT pos mkt RS, bullish catapult, buy on pullback, R-R>2.0 |
| WELL | Welltower Inc. | Real Estate | $233.61 | low 230s to low 250s | 366 | 194 | 5 for 5'er since Feb. '24, top quintile of Real Est. matrix, Pos. trend since Feb. '24, buy on pullback. |
| CENTA | Central Garden & Pet Company | Household Goods | $34.18 | mid-to-hi 30s | 48 | 31 | 4 for 5'er, favored HOUS sector, LT pos peer RS, spread quad top, buy on pullback |
| CLH | Clean Harbors Inc | Waste Management | $316.07 | 310s - 320s | 356 | 288 | 5 for 5'er, #3 of 22 in WAST sector matrix, LT pos peer & mkt RS |
| ASC | Ardmore Shipping Corporation | Transports/Non Air | $17.83 | 17 - 19 | 24 | 15.50 | 5 for 5'er, top 20% of favored TRAN sector matrix, triple top, good R-R, 7.5% yield |
| ASX | ASE Industrial Holding Co., Ltd. Sponsored ADR | Semiconductors | $43.50 | hi 30s | 52 | 31 | 5 for 5'er, top 10% of SEMI sector matrix, LT pos peer & mkt RS, triple top, R-R~2.0 |
| NET | Cloudflare Inc Class A | Internet | $358.82 | 308 - 336 | 408 | 268 | 5 for 5'er, ranks 2nd in Internet sector matrix, pos. trend on 9/9, ATH on 9/17. |
| MTCH | Match Group, Inc. | Leisure | $40.79 | low-to-mid 40s | 55 | 36 | 4 for 5'er, top 20% of LEIS sector matrix, one box from RS buy, triple top, 1.8% yield |
| FTNT | Fortinet Inc. | Software | $178.67 | hi 160s - hi 170s | 226 | 142 | 5 for 5'er, top third of favored SOFT sector matrix, LT pos mkt RS, spread quad top |
| CSTL | Castle Biosciences, Inc. | Biomedics/Genetics | $35.15 | 32 - 35 | 63.50 | 28 | 4 for 5'er, top 10% of favored BIOM sector matrix, multiple buy signals, pos trend flip, R-R~4.0 |
| GH | Guardant Health, Inc. | Biomedics/Genetics | $176.44 | low 170s to mid 180s | 236 | 140 | 5 for 5'er since May '26, top quintile of Biomedics matrix, pos. trend, ATH on 9/17. |
| ANET | Arista Networks Inc | Telephone | $205.70 | 190s - mid 210s | 262 | 178 | 5 for 5'er, top quintile of Telephone matrix, pos. trend, matched ATH on 9/25. |
| Symbol | Company | Sector | Current Price | Action Price | Target | Stop | Notes |
|---|
| Comment | |||||||
|---|---|---|---|---|---|---|---|
|
|
|||||||
ANET Arista Networks Inc R ($208.87) - Telephone - ANET has been a 5 for 5’er since July after seeing the trend flip back to positive. The stock has maintained positive near-term relative strength against the market and its peer group since June this year, and the stock ranks within the top quintile of the Telephone sector matrix. ANET has sustained long-term market RS buy signal since August 2025 and was able to return to a peer RS buy signal at the beginning of July. After shifting the trend back to positive, ANET rallied to a new high in August before consolidating through the first half of September. ANET returned to a buy signal on 9/15 at $204 and this week’s trading brought the chart up to match the all-time chart high at $212. Okay to consider here in the lower $210s or on a pullback to the $190s. The bullish price objective of $262 will serve as the price target, while the initial stop loss will be set for $178, a potential violation of the bullish support line.
| 212.00 | X | 212.00 | |||||||||||||||||||||||||||
| 208.00 | X | O | X | X | 208.00 | ||||||||||||||||||||||||
| 204.00 | X | O | X | O | X | X | 204.00 | ||||||||||||||||||||||
| 200.00 | X | O | X | O | X | O | X | X | X | 200.00 | |||||||||||||||||||
| 198.00 | X | O | X | O | X | O | X | O | X | O | X | 198.00 | |||||||||||||||||
| 196.00 | X | O | X | O | X | O | X | O | X | O | X | 196.00 | |||||||||||||||||
| 194.00 | X | O | X | O | X | O | X | O | X | O | X | 194.00 | |||||||||||||||||
| 192.00 | X | O | X | O | X | 9 | X | O | X | O | X | 192.00 | |||||||||||||||||
| 190.00 | • | X | O | X | O | X | O | X | O | X | O | X | Mid | 190.00 | |||||||||||||||
| 188.00 | X | • | X | O | O | X | O | X | O | O | 188.00 | ||||||||||||||||||
| 186.00 | X | O | • | X | O | X | O | X | 186.00 | ||||||||||||||||||||
| 184.00 | X | O | • | 8 | O | O | X | 184.00 | |||||||||||||||||||||
| 182.00 | X | O | • | X | O | 182.00 | |||||||||||||||||||||||
| 180.00 | X | O | • | X | 180.00 | ||||||||||||||||||||||||
| 178.00 | X | O | X | X | • | 178.00 | |||||||||||||||||||||||
| 176.00 | X | X | O | X | X | O | X | • | 176.00 | ||||||||||||||||||||
| 174.00 | X | X | O | X | O | X | O | X | O | X | • | 174.00 | |||||||||||||||||
| 172.00 | X | O | X | X | O | X | O | X | O | X | O | X | • | 172.00 | |||||||||||||||
| 170.00 | X | O | X | X | O | X | O | X | O | X | O | O | X | • | 170.00 | ||||||||||||||
| 168.00 | O | X | O | X | O | X | O | X | O | X | O | X | O | X | • | 168.00 | |||||||||||||
| 166.00 | O | X | O | X | O | X | 7 | X | O | X | O | X | O | X | • | 166.00 | |||||||||||||
| 164.00 | O | O | X | O | X | O | X | O | O | X | O | X | • | 164.00 | |||||||||||||||
| 162.00 | O | X | O | X | O | X | • | O | X | O | X | • | 162.00 | ||||||||||||||||
| 160.00 | O | O | X | O | X | • | O | X | O | X | • | 160.00 | |||||||||||||||||
| 158.00 | O | X | O | • | O | O | • | 158.00 | |||||||||||||||||||||
| 156.00 | O | • | • | • | 156.00 |

| AMD Advanced Micro Devices, Inc. ($630.59) - Semiconductors - Shares of AMD set all-time highs on Friday, breaking a double top at $632 for its third consecutive buy signal. The 5 for 5'er continues to burn bright, with it remaining an extremely high relative strength name. That said, it is moving into heavily overbought territory, so investors should wait for pullback or consolidation before looking to add. Initial support lies at $600. |
| GCT GigaCloud Technology, Inc. Class A ($54.18) - Retailing - GCT broke a double top at $55 for a second buy signal and to bring the stock within one box of its all-time chart high. The stock has been a 4 for 5'er since July this year and currently ranks within the top quintile of the Retailing sector matrix. Okay to consider here on the breakout. Initial support lies at $50, while additional can be found at $47 and $44, the bullish support line. |
The option suggestions featured here are pulled from the NDW Options Ideas tool. These are just a sample of the ideas that can be found there. The Options Idea tool contains numerous additional income and speculative plays. It also offers relative strength-based screens targeting the highest (and lowest) relative strength stocks and ETFs that have recently moved counter to their longer-term trend. To access or subscribe to the Options Ideas tool, click here.
Call
AbbVie Inc. (ABBV) Dec $18 $260 Call

| Additional Data: | |
| Bid/Ask Spread | 3.86% |
| Delta | 59.95 |
| Gamma | 1.11 |
| Implied Volatility | 28.88% |
| Expiry Date | 84 |
| Earnings Date | 10/29/2026 |
Put
Cadence Design Systems, Inc. (CDNS) Dec 18 $330 Put

| Additional Data: | |
| Bid/Ask Spread | 10.11% |
| Delta | -46.81 |
| Gamma | 0.58 |
| Implied Volatility | 43.75% |
| Expiry Date | 84 |
| Earnings Date | 10/26/2026 |
Income
Cheniere Energy, Inc. (LNG) Oct 23 $290 Covered Call

| Additional Data: | |
| Ann. Static Return | 17.17% |
| Bid/Ask Spread | 18.75% |
| Delta | 75.85 |
| Gamma | -1.21 |
| Implied Volatility | 33.78% |
| Expiry Date | 28 |
| Earnings Date | 10/29/2026 |
Daily Equity & Market Analysis
Loading, Please Wait...

