Most Requested Symbols

Investors have a longstanding love-hate relationship with the month of October, which is sometimes called the "bear killer" but has also seen some of the largest market meltdowns.
NDW Morning Pulse - September 25, 2026
Below are highlights from the NDW Morning Update Video for the morning of 09/24. Access the video on the NDW Morning Update Video page.
Performance was led by crude oil (CL/), which gained 1.81% over the past day. On the downside, emerging markets (EEM) declined 2.10%, while the Russell 2000 (RUT) and S&P 500 (SPX) fell 1.77% and 0.75%, respectively.
Domestic equities improved over the past week, though gains remained concentrated in large caps. The Russell 2000 Index (RUT) broke below 2900 earlier this month and is now testing support near 2840, potentially setting up for another sell signal.
Although the healthcare sector still sits in first place in our DALI sector rankings, the bullish percent for healthcare sector (^BPECHEALTH) continues to tick lower and now maintains a chart level of 30%, indicating that less than one third of stocks in the sector trade on a PnF buy signal.
On the earnings front, two major companies are expected to report later this month: Micron Technology Inc. (MU 5/5 TA Score on 9/30), Costco Wholesale Corporation (COST 3/5 TA Score on 9/24).
Yesterday’s research focused on the momentum outlook for Q4. Despite a weak Q3, momentum remains a market leader in 2026, with MTUM up over 26% YTD and maintaining a strong technical trend. The key question for Q4 is whether market leadership broadens again, supporting a renewed expansion in momentum opportunities.

Investors have a longstanding love-hate relationship with the month of October. Some of the more notorious market meltdowns have occurred, or at least escalated, in October; including 1978 (-9%), 1987 (-22%), and 2008 (-17%). And several of the largest one-day market declines, including Black Monday (1987) and Black Tuesday (1929), happened in October. Still, the S&P 500 (SPX) has had more double-digit gains in October than it has double-digit losses since 1950. In fact, October is often referred to as the "bear killer," as its end ushers in the beginning of the seasonally strong six months of the year. Highlighting the feast-or-famine outcomes October has become known for, amid the 2022 bear market, the S&P bottomed in October and rallied to finish the month with an 8% gain. The next year, the S&P finished the month down more than 3%, before reversing sharply in early November to finish the fourth quarter with a double-digit gain.

October has offered some of the more meaningful buying opportunities since Global Financial Crisis, including 2011 and 2015, when the S&P 500 rallied over 8% during the month. However, we don’t have to look back too far to see the negative side of the love-hate relationship with October. In 2018, the S&P 500 recorded its worst October since 2008, falling nearly 7%, the beginning of a 15% fourth quarter slide. Historically speaking, October has been positive more often than not, as the S&P 500 has logged gains in 59% of the Octobers between 1950 and 2025. The average return for the month during that period is +0.86%.
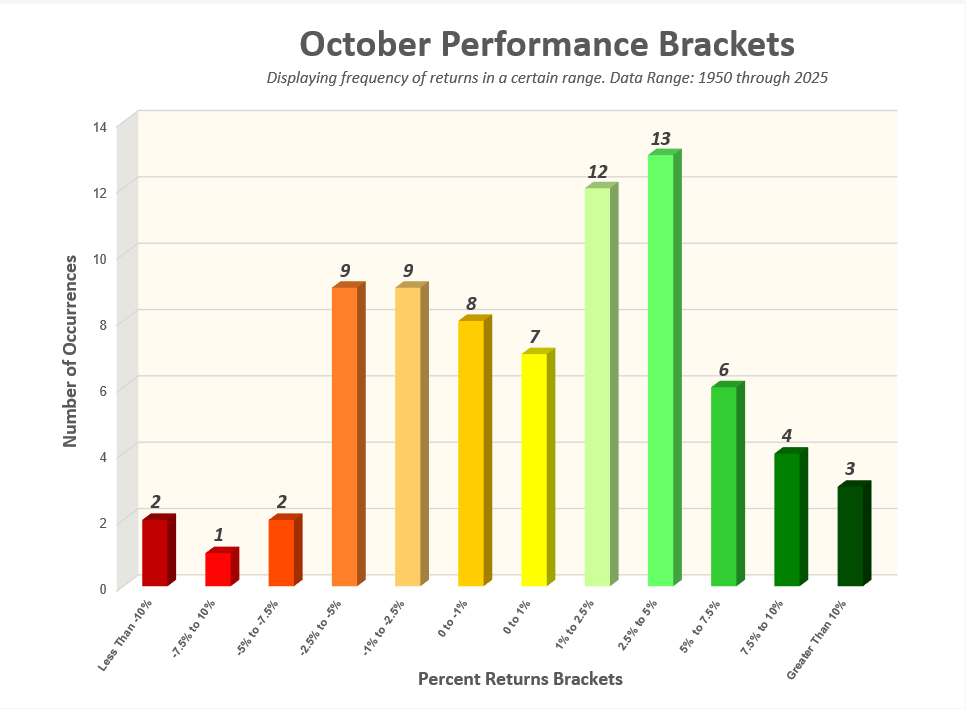
The histogram below is another visual that helps us wrap our heads around October's past behavior. It categorizes each October's return into a performance bracket, allowing us not only to see that there have been more up Octobers than down Octobers, but also the magnitude of returns. If we look at the extremes, notice that only five Octobers since 1950 have experienced a decline of more than -5%. The most common experience in October has been a gain in the range of 2.5% - 5%.
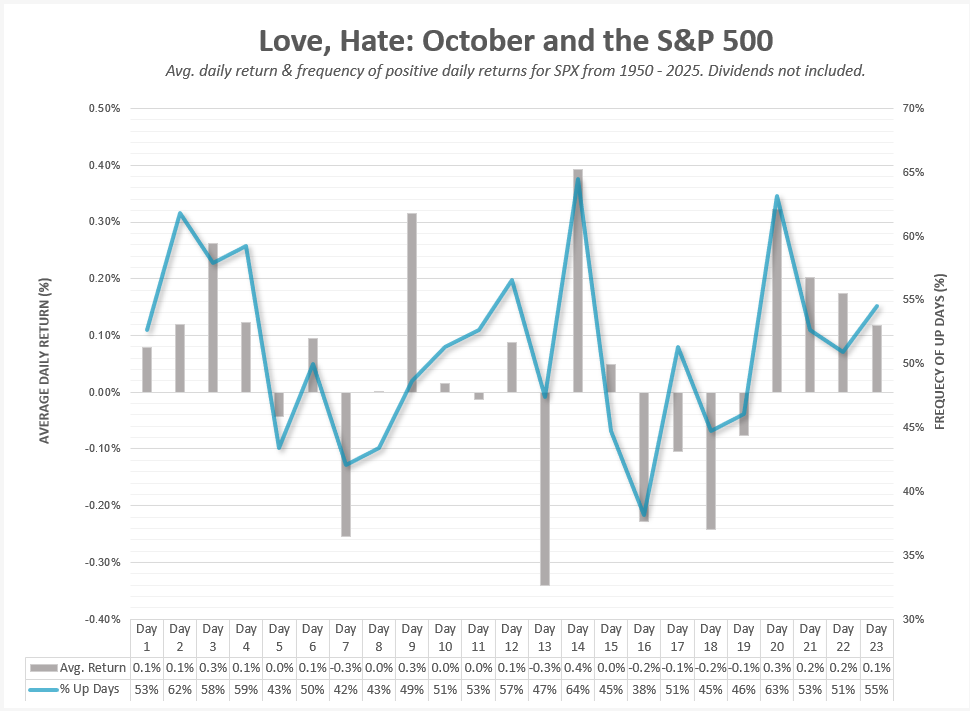
Finally, the graphic below illustrates the average daily returns of the S&P 500 Index in October going back to 1950, as well as the frequency of positive daily returns for each trading day. Historically, the month has both started and ended well, with the last four trading days of the month producing gains more times than not. The days in between have tended to produce a very different experience, with more substantial moves in both directions.
As we close out the third quarter, the S&P is up more than 10% for the year, possibly on track to notch its fourth consecutive year with a double-digit gain for the first time since the late 1990s. Whether it reaches that milestone may hinge on whether this October is one to love or hate.
Average Level
-26.47
| < - -100 | -100 - -80 | -80 - -60 | -60 - -40 | -40 - -20 | -20 - 0 | 0 - 20 | 20 - 40 | 40 - 60 | 60 - 80 | 80 - 100 | 100 - > |
|---|---|---|---|---|---|---|---|---|---|---|---|
|
Sell signaldvy
|
|||||||||||
|
Buy signaliwm
|
Buy signalONEQ
|
||||||||||
|
Sell signalief
|
Sell signalfxe
|
Buy signalxlg
|
|||||||||
|
Sell signalshy
|
Buy signalicf
|
Buy signalIJH
|
Buy signalSPY
|
Buy signaldx/y
|
|||||||
|
Sell signalhyg
|
Buy signalijr
|
Sell signaltlt
|
Buy signalVOOV
|
Sell signalEEM
|
Buy signalQQQ
|
||||||
|
Sell signalagg
|
Sell signallqd
|
Buy signalrsp
|
Buy signaldia
|
Buy signalefa
|
Buy signalgld
|
Buy signalVOOG
|
Buy signalUSO
|
Buy signalGSG
|
Buy signalgcc
|
||
| < - -100 | -100 - -80 | -80 - -60 | -60 - -40 | -40 - -20 | -20 - 0 | 0 - 20 | 20 - 40 | 40 - 60 | 60 - 80 | 80 - 100 | 100 - > |
| AGG | iShares US Core Bond ETF |
| USO | United States Oil Fund |
| DIA | SPDR Dow Jones Industrial Average ETF |
| DVY | iShares Dow Jones Select Dividend Index ETF |
| DX/Y | NYCE U.S.Dollar Index Spot |
| EFA | iShares MSCI EAFE ETF |
| FXE | Invesco CurrencyShares Euro Trust |
| GLD | SPDR Gold Trust |
| GSG | iShares S&P GSCI Commodity-Indexed Trust |
| HYG | iShares iBoxx $ High Yield Corporate Bond ETF |
| ICF | iShares Cohen & Steers Realty ETF |
| IEF | iShares Barclays 7-10 Yr. Tres. Bond ETF |
| LQD | iShares iBoxx $ Investment Grade Corp. Bond ETF |
| IJH | iShares S&P 400 MidCap Index Fund |
| ONEQ | Fidelity Nasdaq Composite Index Track |
| QQQ | Invesco QQQ Trust |
| RSP | Invesco S&P 500 Equal Weight ETF |
| IWM | iShares Russell 2000 Index ETF |
| SHY | iShares Barclays 1-3 Year Tres. Bond ETF |
| IJR | iShares S&P 600 SmallCap Index Fund |
| SPY | SPDR S&P 500 Index ETF Trust |
| TLT | iShares Barclays 20+ Year Treasury Bond ETF |
| GCC | WisdomTree Continuous Commodity Index Fund |
| VOOG | Vanguard S&P 500 Growth ETF |
| VOOV | Vanguard S&P 500 Value ETF |
| EEM | iShares MSCI Emerging Markets ETF |
| XLG | Invesco S&P 500 Top 50 ETF |

| Symbol | Company | Sector | Current Price | Action Price | Target | Stop | Notes |
|---|---|---|---|---|---|---|---|
| FR | First Industrial Realty Trust | Real Estate | $61.07 | mid-to-hi 60s | 86 | 59 | 4 for 5'er, top 25% of REAL sector matrix, LT pos peer RS, spread sextuple top, R-R>2.0, 2.9% yield |
| AME | Ametek Inc | Electronics | $246.45 | mid 230s - mid 250s | 342 | 204 | 4 for 5'er, LT pos mkt RS, bullish catapult, buy on pullback, R-R>2.0 |
| WELL | Welltower Inc. | Real Estate | $229.87 | low 230s to low 250s | 366 | 194 | 5 for 5'er since Feb. '24, top quintile of Real Est. matrix, Pos. trend since Feb. '24, buy on pullback. |
| CENTA | Central Garden & Pet Company | Household Goods | $34.15 | mid-to-hi 30s | 48 | 31 | 4 for 5'er, favored HOUS sector, LT pos peer RS, spread quad top, buy on pullback |
| CLH | Clean Harbors Inc | Waste Management | $313.15 | 310s - 320s | 356 | 288 | 5 for 5'er, #3 of 22 in WAST sector matrix, LT pos peer & mkt RS |
| ASC | Ardmore Shipping Corporation | Transports/Non Air | $17.61 | 17 - 19 | 24 | 15.50 | 5 for 5'er, top 20% of favored TRAN sector matrix, triple top, good R-R, 7.5% yield |
| ASX | ASE Industrial Holding Co., Ltd. Sponsored ADR | Semiconductors | $43.93 | hi 30s | 52 | 31 | 5 for 5'er, top 10% of SEMI sector matrix, LT pos peer & mkt RS, triple top, R-R~2.0 |
| NET | Cloudflare Inc Class A | Internet | $352.33 | 308 - 336 | 408 | 268 | 5 for 5'er, ranks 2nd in Internet sector matrix, pos. trend on 9/9, ATH on 9/17. |
| MTCH | Match Group, Inc. | Leisure | $40.48 | low-to-mid 40s | 55 | 36 | 4 for 5'er, top 20% of LEIS sector matrix, one box from RS buy, triple top, 1.8% yield |
| FTNT | Fortinet Inc. | Software | $178.74 | hi 160s - hi 170s | 226 | 142 | 5 for 5'er, top third of favored SOFT sector matrix, LT pos mkt RS, spread quad top |
| CSTL | Castle Biosciences, Inc. | Biomedics/Genetics | $34.90 | 32 - 35 | 63.50 | 28 | 4 for 5'er, top 10% of favored BIOM sector matrix, multiple buy signals, pos trend flip, R-R~4.0 |
| GH | Guardant Health, Inc. | Biomedics/Genetics | $176.39 | low 170s to mid 180s | 236 | 140 | 5 for 5'er since May '26, top quintile of Biomedics matrix, pos. trend, ATH on 9/17. |
| Symbol | Company | Sector | Current Price | Action Price | Target | Stop | Notes |
|---|
| Symbol | Company | Sector | Current Price | Action Price | Target | Stop | Notes |
|---|---|---|---|---|---|---|---|
| AU | AngloGold Ashanti Limited (South Africa) ADR | Precious Metals | $98.74 | 100s - low 110s | 144 | 92 | Sell signal at $98 on 9/24. Maintain $92 stop loss. |
| Comment | |||||||
|---|---|---|---|---|---|---|---|
|
|
|||||||
GH Guardant Health, Inc. R ($175.77) - Biomedics/Genetics - GH has been a 5 for 5’er since May 2026 after seeing the trend shift back to positive and the market and peer RS charts shift into Xs, highlighting positive near-term strength for the stock. Additionally, GH ranks within the top quintile of the Biomedics/Genetics sector matrix and has maintained positive long-term RS against the market and its peer group since 2025. The stock returned to a buy signal on 9/15 at $168 before rallying to a new all-time chart high at $182. After pulling back briefly to the lower $170s, GH reversed back into Xs this week and rallied to $180. Okay to consider in the lower $170 to mid-$180 range. The bullish price objective of $236 will serve as the price target, while the initial stop loss will be set for $140.
| 182.00 | X | 182.00 | |||||||||||||||||||||||||||
| 180.00 | X | O | 180.00 | ||||||||||||||||||||||||||
| 178.00 | X | O | X | 178.00 | |||||||||||||||||||||||||
| 176.00 | X | X | O | X | 176.00 | ||||||||||||||||||||||||
| 174.00 | X | X | O | X | O | X | 174.00 | ||||||||||||||||||||||
| 172.00 | X | O | X | O | X | X | O | 172.00 | |||||||||||||||||||||
| 170.00 | X | O | X | 8 | X | X | X | O | X | 170.00 | |||||||||||||||||||
| 168.00 | X | O | X | O | X | O | X | O | X | O | X | X | 168.00 | ||||||||||||||||
| 166.00 | X | O | X | O | X | O | X | O | X | O | X | O | X | X | 166.00 | ||||||||||||||
| 164.00 | X | O | X | X | X | O | X | X | O | X | O | X | O | X | O | X | O | X | 164.00 | ||||||||||
| 162.00 | X | O | X | O | X | O | X | O | X | O | X | O | X | O | O | 9 | O | X | O | X | Mid | 162.00 | |||||||
| 160.00 | X | O | X | O | X | O | X | O | X | O | X | O | X | O | X | O | X | O | X | 160.00 | |||||||||
| 158.00 | X | O | X | O | X | O | X | O | X | O | O | X | O | X | O | X | O | X | 158.00 | ||||||||||
| 156.00 | X | O | X | O | O | X | O | O | O | O | X | O | 156.00 | ||||||||||||||||
| 154.00 | 7 | O | O | X | X | O | 154.00 | ||||||||||||||||||||||
| 152.00 | X | O | X | O | X | 152.00 | |||||||||||||||||||||||
| 150.00 | X | O | X | O | X | 150.00 | |||||||||||||||||||||||
| 148.00 | X | O | X | O | X | 148.00 | |||||||||||||||||||||||
| 146.00 | X | O | O | X | 146.00 | ||||||||||||||||||||||||
| 144.00 | X | O | X | 144.00 | |||||||||||||||||||||||||
| 142.00 | X | O | 142.00 | ||||||||||||||||||||||||||
| 140.00 | X | • | 140.00 | ||||||||||||||||||||||||||
| 138.00 | X | • | 138.00 | ||||||||||||||||||||||||||
| 136.00 | X | • | 136.00 | ||||||||||||||||||||||||||
| 134.00 | X | • | 134.00 | ||||||||||||||||||||||||||
| 132.00 | O | X | • | 132.00 | |||||||||||||||||||||||||
| 130.00 | O | X | • | 130.00 | |||||||||||||||||||||||||
| 128.00 | O | X | • | 128.00 | |||||||||||||||||||||||||
| 126.00 | O | • | 126.00 |
| AMT American Tower REIT ($168.25) - Real Estate - AMT fell Thursday to break a triple bottom at $170 before falling to $168 intraday. This 0 for 5'er moved to a negative trend in June and sits near the bottom of the real estate sector RS matrix. The weight of the technical evidence is weak and continues to deteriorate. Long exposure should be avoided. Further support may be seen at $164. |
| DHR Danaher Corporation ($224.58) - Healthcare - DHR inched higher to complete a double top break at $224, marking its third consecutive buy signal. The 3 for 5'er moved up from a 2 after reversing back into Xs against its peers. Additionally, the stock ranks in the top half of the healthcare sector matrix. DHR is still rated hold, so continue monitoring for further improvement. Initial support is at $200, with additional strong support at $194. |
| LOW Lowe's Companies Inc. ($188.24) - Building - LOW printed fresh 2026 lows with today's action. It remains a low attribute name and should be avoided for the time being. Bounces back to $196 should be taken advantage of to trim allocation. |

The option suggestions featured here are pulled from the NDW Options Ideas tool. These are just a sample of the ideas that can be found there. The Options Idea tool contains numerous additional income and speculative plays. It also offers relative strength-based screens targeting the highest (and lowest) relative strength stocks and ETFs that have recently moved counter to their longer-term trend. To access or subscribe to the Options Ideas tool, click here.
Call
Chevron Corporation (CVX) Dec $18 $200 Call

| Additional Data: | |
| Bid/Ask Spread | 5.47% |
| Delta | 63.94 |
| Gamma | 1.47 |
| Implied Volatility | 27.03% |
| Expiry Date | 85 |
| Earnings Date | 10/30/2026 |
Put
The Boeing Company (BA) Dec 18 $200 Put

| Additional Data: | |
| Bid/Ask Spread | 5.93% |
| Delta | -48.78 |
| Gamma | 1.3 |
| Implied Volatility | 33.69% |
| Expiry Date | 85 |
| Earnings Date | 10/28/2026 |
Income
J.P. Morgan Chase & Co. (JPM) Nov 6 $320 Short Put

| Additional Data: | |
| Ann. Static Return | 15.72% |
| Bid/Ask Spread | 33.00% |
| Delta | 26.15 |
| Gamma | -0.93 |
| Implied Volatility | 25.66% |
| Expiry Date | 43 |
| Earnings Date | 10/13/2026 |
Daily Equity & Market Analysis
Loading, Please Wait...

