Today we review how momentum has fared so far in Q3 and what you need to know as we move towards the close of 2026.
As the end of the third quarter approaches, we are offered an opportunity to look underneath the hood of momentum strategies and their overall position as we rapidly approach the end of 2026. After all, gauging the health/intensity of trend following can be quite useful as we build our expectations for Q4, particularly as we construct a gameplan with clients in end of year discussions. Just like any factor, momentum can go through fits and spurts as natural rotation occurs across the investment landscape. However, it is important to remember that momentum is also a self-correcting factor: it will naturally rotate to areas of leadership over time and avoid points of identified weakness. In this way momentum is a particularly unique factor- value will always be value, even if the area struggles for years at a time, same for growth, low volatility, etc. With that said, momentum has put together a particularly productive year in 2026… but you wouldn’t know that if you just looked at performance throughout the last few months. Despite falling nearly 8% since the start of Q3 (6/30-9/21), factor proxy MTUM has still picked up over 26% so far in 2026. This is nearly double that of the broad market, which has advanced nearly 13.5% on a YTD basis. Again, Q3 has been quite unproductive for MTUM, which has quickly fallen off 2026 highs on its default chart.
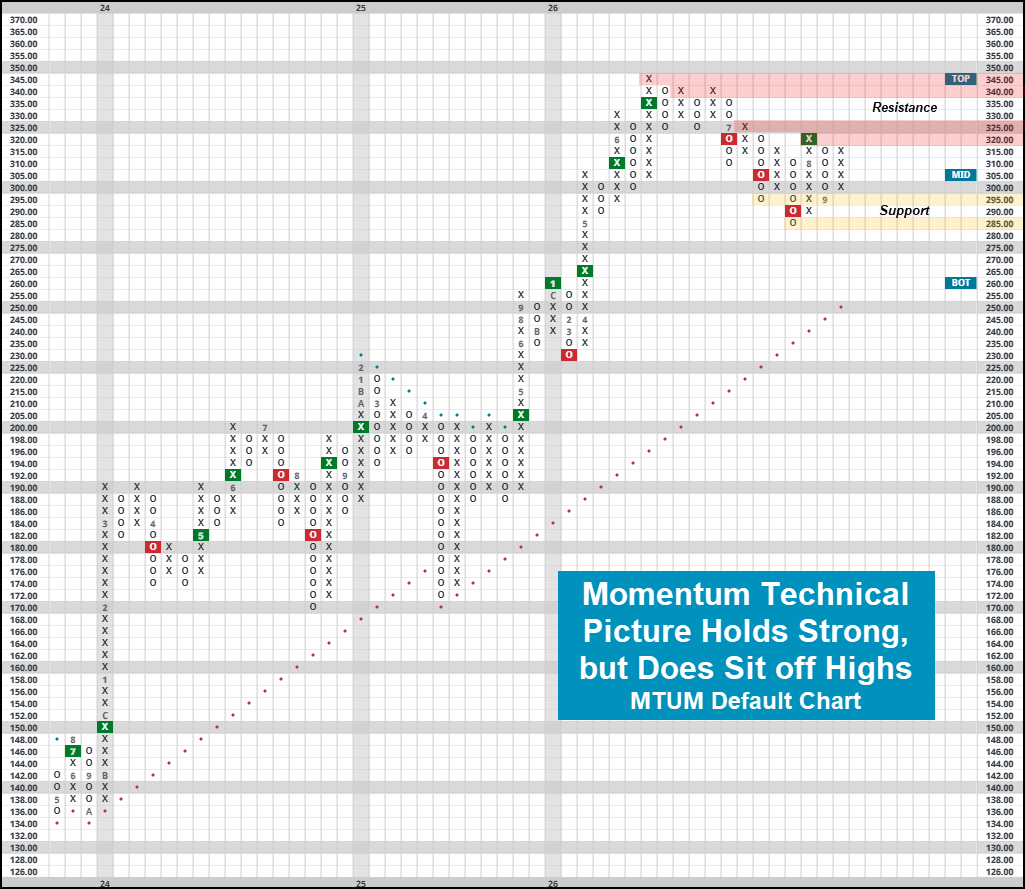
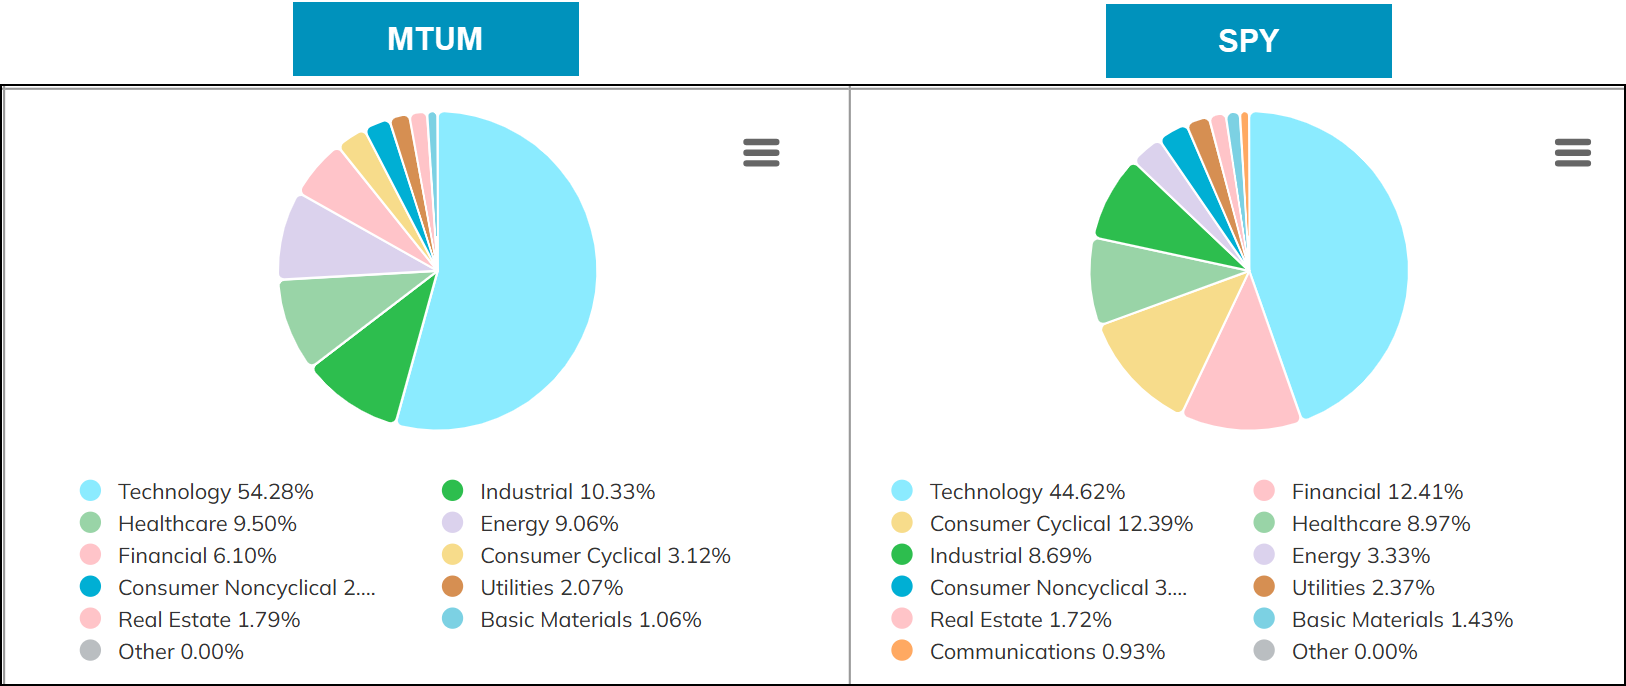
Despite the retreat off all-time highs above, the technical posture for MTUM is still quite strong. Earning a 5.0/6.0 fund score as of 9/21, the fund maintains a strong uptrend and relative favor against broad benchmark SPXEWI. While the period of consolidation between current levels and highs at $345 is certainly notable, the silver lining for trend followers looks to be the somewhat strong support below, ranging from $285-$295. Heading into Q4, we will look for a continued expansion from current leadership to push the factor towards highs to close out the year. Speaking of current leadership, it can be useful to analyze current holdings of the fund to help identify where momentum is picking up leaders and avoiding laggards. Using NDW’s fund comparison tool, we can observe a handful of noticeable differences in sector exposure. Of note includes comparatively large overweights towards technology (54% vs.44%) energy (9% vs. 3%) with small overweights to the likes of healthcare and industrials. On the flip side, observable differences in exposure to consumer discretionary (3% vs. 12%) & financials (6% vs. 12%). Remember, momentum strategies typically rely on consistent winners and losers, taking advantage of the spread between these groups. Heading into Q4, we will look for this spread to expand.
Knowing a spread between high and low performing assets exists is one thing, quantifying it is another. At NDW, we typically chart the spread between winners and losers via Point and Figure chart RSSPREAD. Higher values signal a wide spread between high RS assets and low RS assets, an environment typically productive for momentum strategies. As you would expect due to its poor performance in Q3, this spread has dissipated over the last few months, now sitting well off 2026 highs as rotation has tightened the spread between strong & weak assets. While this certainly doesn’t ensure an unproductive landscape for trend following, knowing RSSPREAD has declined can help confirm the idea that asset leadership is in flux- an important point to keep in the back of your mind heading into Q4. Despite Q3 being largely unproductive, YTD values still point to an expansion of leadership that momentum has been able to take advantage of. The charts below highlight performance of different momentum quintiles over the course of 2026, with our “top” representing high RS assets and “bot” representing low RS assets. Across the globe, we have seen these high strength names outperform the majority of other buckets. As we discussed in yesterday’s feature this has led to a productive environment for trend followers, particularly on the international front.

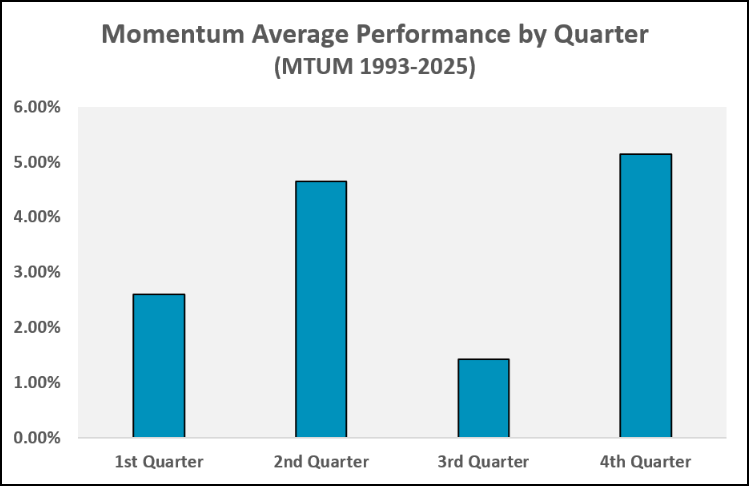
Quickly wrapping up, there are also some seasonal tailwinds in play. Like broader markets, momentum representative MTUM has historically been quite positive in Q4, seeing the fund positive in nearly 75% of Q4’s since 1993. While we can’t be sure exactly why this occurs, we can playfully chalk it up to a generally good mood of money managers around the holiday season or the tendency to stuff client assets into what has worked that year ahead of end of year reviews. While seasonal tendencies are anything but a guarantee, we will certainly take what we can get as we rocket towards the end of the year.