Most Requested Symbols

Highlights from the NDW Morning Update Video from the morning of 6/22.
Now in the red for the year, gold and silver have shed significant strength over the last few months. We talk about the signals the asset gave you along the way in hopes of learning more for next time.
NDW Morning Update Video - June 23, 2026
Morning Highlights:
Below are highlights from the NDW Morning Update Video for the morning of 6/22. Access the the video on the NDW Morning Update Video page.

Gone are the days of watching silver and gold advance 1%+ each day. In fact, since its highs at the end of January, gold representative GLD has fallen over 20% on its default chart. This 20% decline seems bad… but is actually quite “productive” when compared to the near 45% decline for silver (SLV, SI/) over that same time frame. Of course, the question readers will have is, “How could I have known that this was going to occur?” before the massive decline comes down the pipeline. While the true answer is the sad reality that there is no way to know for sure, there are several tools in the toolbox investors could look towards to help identify a weakening asset in real time. Take, for instance, the default chart for GLD, pictured below. After moving to multi-decade levels of overbought on the weekly distribution curve to open 2026, the fund quickly fell back down to earth over the next month or so before trying to get back to those same highs. Unfortunately, buyers were uninterested in reclaiming that point to open March - the first sign of possible weakness on the horizon. Since that point, a broadening supply dynamic has continued to drive prices lower to close out the front half of 2026, seeing GLD now in the red for the year. While not every asset that fails to reclaim highs is bound for a precipitous decline, it can often be a first sign that demand for the asset has contracted meaningfully.

Of course, the astute investor will consider much more than just the absolute technical picture on its own. Taking into consideration relative performance against broader markets (SPXEWI), the fund score can also provide valuable insights into the strength of an asset’s technical picture. Remember, NDW’s fund score system ranges from 0-6, with a “technically acceptable” score coming in above 3.0. Falling below a score of 3.0 on 4/21, someone following the fund score system would have gotten the signal a tad later than someone who noticed the assets inability to reclaim highs in March… but the fund has still declined significantly since then. Point being, those wanting to give positions a bit longer of a leash might focus more on the fund score/technical attribute scoring system than trying to play a more near-term picture like our initial test of its absolute technical stance.

Knowing that GLD has underperformed a broader benchmark like SPXEWI is one thing, but commodities are oftentimes a more unique asset class investors may be apprehensive to simply replace with beta exposure if there are other, technically stronger assets in play. To judge this, we can utilize the continuous commodities matrix, which pits 20 different commodities against each other in a relative strength arm wrestling contest. After ranking towards the top of the matrix just a few months ago, both gold and silver have fallen into the bottom half of the rankings when measured by their long-term buy signals. In their place, a wide variety of assets surfaced in 2026, spanning from energy-dominated leadership as turmoil in the middle east raged onwards in Q1, to the more agriculture-focused leaders as we wrap up Q2. Those looking for a faster experience by ranking assets by a combo of long-term buy signals and short-term X's compared to other commodities might be interested to see that gold fell into the bottom half of the rankings in the middle of March, somewhere between our initial absolute test on the trend chart and our longer-term fund score test.

All that to say, no matter how you slice it, precious metals is an area that deserves less of a place in your portfolio than just a few months ago. A dwindling number of precious metals focused names earn technical attribute scores of 3 or higher. For those of you entering mid-year conversations with clients, take the TA/fund scoring system as an easy way to pick the weeds that might have emerged as the space lost relative strength in Q2. Depending on the technical picture, selling calls against outstanding positions can give you an opportunity to get paid to exit positions while waiting for a slight bounce from positions that have been beaten down recently. Remember, writing covered calls is still technically a bullish position, which may not make sense for every name - keep this in mind when you are reviewing your allocation heading into Q3.
Average Level
5.15
| < - -100 | -100 - -80 | -80 - -60 | -60 - -40 | -40 - -20 | -20 - 0 | 0 - 20 | 20 - 40 | 40 - 60 | 60 - 80 | 80 - 100 | 100 - > |
|---|---|---|---|---|---|---|---|---|---|---|---|
|
Buy signalVOOV
|
|||||||||||
|
Buy signalSPY
|
|||||||||||
|
Buy signalONEQ
|
Buy signaldia
|
||||||||||
|
Buy signalicf
|
Sell signalagg
|
Buy signaltlt
|
Buy signaliwm
|
||||||||
|
Buy signalfxe
|
Buy signaldvy
|
Buy signalhyg
|
Buy signalVOOG
|
Buy signalijr
|
|||||||
|
Sell signalgld
|
Sell signalief
|
Sell signallqd
|
Buy signalIJH
|
Buy signalQQQ
|
|||||||
|
Buy signalGCC
|
Sell signalgsg
|
Sell signaluso
|
Sell signalshy
|
Buy signalXLG
|
Buy signalefa
|
Buy signalrsp
|
Buy signalEEM
|
Sell signaldx/y
|
|||
| < - -100 | -100 - -80 | -80 - -60 | -60 - -40 | -40 - -20 | -20 - 0 | 0 - 20 | 20 - 40 | 40 - 60 | 60 - 80 | 80 - 100 | 100 - > |
| AGG | iShares US Core Bond ETF |
| USO | United States Oil Fund |
| DIA | SPDR Dow Jones Industrial Average ETF |
| DVY | iShares Dow Jones Select Dividend Index ETF |
| DX/Y | NYCE U.S.Dollar Index Spot |
| EFA | iShares MSCI EAFE ETF |
| FXE | Invesco CurrencyShares Euro Trust |
| GLD | SPDR Gold Trust |
| GSG | iShares S&P GSCI Commodity-Indexed Trust |
| HYG | iShares iBoxx $ High Yield Corporate Bond ETF |
| ICF | iShares Cohen & Steers Realty ETF |
| IEF | iShares Barclays 7-10 Yr. Tres. Bond ETF |
| LQD | iShares iBoxx $ Investment Grade Corp. Bond ETF |
| IJH | iShares S&P 400 MidCap Index Fund |
| ONEQ | Fidelity Nasdaq Composite Index Track |
| QQQ | Invesco QQQ Trust |
| RSP | Invesco S&P 500 Equal Weight ETF |
| IWM | iShares Russell 2000 Index ETF |
| SHY | iShares Barclays 1-3 Year Tres. Bond ETF |
| IJR | iShares S&P 600 SmallCap Index Fund |
| SPY | SPDR S&P 500 Index ETF Trust |
| TLT | iShares Barclays 20+ Year Treasury Bond ETF |
| GCC | WisdomTree Continuous Commodity Index Fund |
| VOOG | Vanguard S&P 500 Growth ETF |
| VOOV | Vanguard S&P 500 Value ETF |
| EEM | iShares MSCI Emerging Markets ETF |
| XLG | Invesco S&P 500 Top 50 ETF |

| Symbol | Company | Sector | Current Price | Action Price | Target | Stop | Notes |
|---|---|---|---|---|---|---|---|
| GRMN | Garmin Ltd. | Leisure | $234.20 | mid 230s - mid 260s | 364 | 196 | 5 TA rating, LT pos trend and mkt RS buy, top 33% of LEIS sector matrix, buy-on-pullback |
| IBOC | International Bancshares Corporation | Banks | $73.56 | low-to-mid 70s | 93 | 63 | 4 for 5'er, favored BANK sector, LT pos peer & mkt RS, bearish signal reversal, R-R~2.0, 1.95% yield |
| LYV | Live Nation Entertainment Inc. | Leisure | $171.24 | low 160s to mid 170s | 202 | 142 | 4 for 5'er; Pos. Trend; Top Half of Leisure Matrix; Within one box of ATH. |
| MO | Altria Group Inc. | Food Beverages/Soap | $69.12 | low-to-mid 70s | 91 | 62 | 4 for 5'er, top quartile of FOOD sector matrix, one box from RS buy, bullish triangle, 5.9% yield |
| CTRE | CareTrust REIT Inc | Real Estate | $37.06 | $38 - $43 | 62.50 | 34 | 5/5'er since Apr. '25, top quintile of Real Estate Matrix, pos. trend and buy signal since Jul. '23. |
| BTI | British American Tobacco Sp-Adr (United Kingdom) ADR | Food Beverages/Soap | $58.91 | hi 50s - low 60s | 92 | 51 | 4 for 5'er, top 25% of FOOD sector matrix, one box from mkt RS buy, buy on pullback, R-R~3.0, 5.3% yield |
| LAMR | Lamar Advertising Company | Media | $149.65 | mid 140 to mid 150 | 228 | 122 | 5 for 5'er, top third of Media Matrix, pos. trend, Reward-Risk > 11, current yield > 4%. |
| CM | Canadian Imperial Bank of Commerce | Banks | $111.69 | 100s | 165 | 90 | 5 for 5'er, top 10% of favored BANK sector matrix, LT pos peer RS, bearish signal reversal, R-R>3.0, 2.9% yield |
| JCI | Johnson Controls International PLC | Building | $144.82 | upper 130s to lower 150s | 182 | 124 | 4 for 5'er since Apr. '25, top 25% of Building sector matrix, pos. trend, ATH on 6/3. |
| EBAY | eBay Inc. | Retailing | $108.24 | mid 100s - low 110s | 161 | 93 | 5 for 5'er, top 10% of RETA sector matrix, buy on pullback, R-R~3.0 |
| F | Ford Motor Company | Autos and Parts | $14.06 | 14.50 - 16 | 27 | 12.50 | 5 for 5'er, top 20% of AUTO sector matrix, RS buy signal, spread triple top, R-R~5, 3.9% yield |
| HLT | Hilton Worldwide Holdings Inc | Leisure | $348.84 | low 320 - low 340 | 452 | 284 | 5 for 5'er since Nov. '23, top half of Leisure sector matrix, pos. trend since Nov. '23, buy since April. |
| CFG | Citizens Financial Group Inc | Banks | $67.08 | low to hi 60s | 87 | 54 | 5 for 5'er, top quintile of Banks matrix, LT pos. trend, Reward-Risk > 4, Earn. 7/16. |
| SPHR | Sphere Entertainment Co. | Leisure | $157.33 | 140s - 150s | 204 | 122 | 5 for 5'er, top 20% of LEIS sector matrix, spread quintuple top, good R-R |
| USFD | US Foods Holding Corp. | Food Beverages/Soap | $91.91 | 90s | 123 | 79 | 4 for 5'er, top half of FOOD sector matrix, LT pos peer & mkt RS, pos trend flip, R-R~2.0 |
| IRM | Iron Mountain Inc. | Business Products | $127.83 | mid 120s to mid 130s | 167 | 108 | 5 for 5'er, top quintile of Bus. Prod. matrix, Mkt RS buy since 6/24, pos. trend, Reward-Risk > 9. |
| BVN | Minas Buenaventura (Peru) ADR | Precious Metals | $32.58 | mid 30s | 492 | 296 | 4 for 5'er, top 20% of PREC sector matrix, LT pos peer & mkt RS, 3.3% yield |
| ESI | Element Solutions Inc. | Chemicals | $45.97 | low to mid 40s | 66 | 38 | 5 for 5'er, top decile of the Chemicals matrix, buy signal since 1/26, Reward-Risk > 3. |
| AFRM | Affirm Holdings, Inc. Class A | Finance | $73.92 | low 70s | 108 | 59 | 5 for 5'er, top 10% of FINA sector matrix, pos trend flip, R-R>2.0 |
| Symbol | Company | Sector | Current Price | Action Price | Target | Stop | Notes |
|---|
| Comment | |||||||
|---|---|---|---|---|---|---|---|
|
|
|||||||
AFRM Affirm Holdings, Inc. Class A R ($72.45) - Finance - AFRM is a 5 for 5'er that ranks in the top decile of the finance sector matrix. After giving three consecutive sell signals, AFRM gave a buy signal last week when it broke a double top at $69 and continued higher to $77, returning to a positive trend in the process. Long exposure may be added in the low $70s and we will set our initial stop at $59, which would take out multiple levels of support on AFRM's chart and violate its trend line. We will use the bullish price objective, $108, as our target price, giving us a reward-to-risk ratio north of 2.0.
| 77.00 | X | 77.00 | |||||||||||||||||||||||||||
| 76.00 | • | X | O | 76.00 | |||||||||||||||||||||||||
| 75.00 | 6 | • | X | O | 75.00 | ||||||||||||||||||||||||
| 74.00 | X | O | • | X | O | 74.00 | |||||||||||||||||||||||
| 73.00 | X | O | • | X | O | 73.00 | |||||||||||||||||||||||
| 72.00 | X | O | • | X | O | 72.00 | |||||||||||||||||||||||
| 71.00 | X | X | O | • | X | 71.00 | |||||||||||||||||||||||
| 70.00 | X | O | X | O | X | 70.00 | |||||||||||||||||||||||
| 69.00 | X | O | X | X | O | X | X | 69.00 | |||||||||||||||||||||
| 68.00 | X | X | X | O | X | X | O | X | O | X | O | X | X | 68.00 | |||||||||||||||
| 67.00 | X | O | X | O | X | O | X | O | X | X | O | X | O | X | O | X | O | X | Mid | 67.00 | |||||||||
| 66.00 | • | X | O | 5 | O | X | O | X | O | X | O | X | O | O | X | O | X | O | X | 66.00 | |||||||||
| 65.00 | • | X | O | X | X | O | O | X | O | X | O | X | O | O | X | O | X | 65.00 | |||||||||||
| 64.00 | • | X | O | X | O | X | O | X | O | X | O | X | O | X | O | X | 64.00 | ||||||||||||
| 63.00 | • | X | O | X | O | X | O | X | O | X | O | O | • | O | X | • | 63.00 | ||||||||||||
| 62.00 | X | O | O | O | O | X | • | • | O | • | 62.00 | ||||||||||||||||||
| 61.00 | X | O | X | • | • | 61.00 | |||||||||||||||||||||||
| 60.00 | X | O | • | 60.00 | |||||||||||||||||||||||||
| 59.00 | X | • | 59.00 | ||||||||||||||||||||||||||
| 58.00 | X | • | 58.00 | ||||||||||||||||||||||||||
| 57.00 | X | • | 57.00 | ||||||||||||||||||||||||||
| 56.00 | X | • | 56.00 | ||||||||||||||||||||||||||
| 55.00 | X | • | 55.00 | ||||||||||||||||||||||||||
| 54.00 | X | • | 54.00 | ||||||||||||||||||||||||||
| 53.00 | X | X | • | 53.00 | |||||||||||||||||||||||||
| 52.00 | X | O | X | • | 52.00 | ||||||||||||||||||||||||
| 51.00 | X | O | X | • | 51.00 | ||||||||||||||||||||||||
| 50.00 | X | O | X | • | 50.00 | ||||||||||||||||||||||||
| 49.00 | X | O | X | • | 49.00 | ||||||||||||||||||||||||
| 48.00 | X | O | • | 48.00 | |||||||||||||||||||||||||
| 47.00 | 4 | X | • | 47.00 | |||||||||||||||||||||||||
| 46.00 | X | O | X | • | 46.00 | ||||||||||||||||||||||||
| 45.00 | X | O | X | • | 45.00 | ||||||||||||||||||||||||
| 44.00 | X | O | • | Bot | 44.00 |
| GOOGL Alphabet Inc. Class A ($348.80) - Internet - GOOGL struggled today, falling over 5% on the news that a key AI mind in John Jumper is leaving the firm to join Anthropic. The name is still a 5/5'er, although the near-term is a bit more of a concern as the media giant trades off some relevant highs established earlier in 2026. Don't panic for now, but do keep an eye on old resistance from earlier this year in the mid $340's. |
| TTWO Take-Two Interactive Software, Inc. ($238.63) - Leisure - TTWO broke a double top at $248 for a fifth buy signal since April and to bring the chart to levels not seen since January. The stock is a 4 for 5'er that has maintained positive long-term relative strength since 2023. Okay to consider here on the breakout or on a pullback to the $220 to $230 range. Initial support lies at $208, the bullish support line, while additional can be found in the mid $190s. |

The option suggestions featured here are pulled from the NDW Options Ideas tool. These are just a sample of the ideas that can be found there. The Options Idea tool contains numerous additional income and speculative plays. It also offers relative strength-based screens targeting the highest (and lowest) relative strength stocks and ETFs that have recently moved counter to their longer-term trend. To access or subscribe to the Options Ideas tool, click here.
Call
Merck & Co (MRK) Sept 18 $110 Call

| Additional Data: | |
| Bid/Ask Spread | 8.85% |
| Delta | 67.61 |
| Gamma | 2.16 |
| Implied Volatility | 30.47% |
| Expiry Date | 88 |
| Earnings Date | 8/4/2026 |
Put
Workday Inc (WDAY) Sept 18 $130 Put
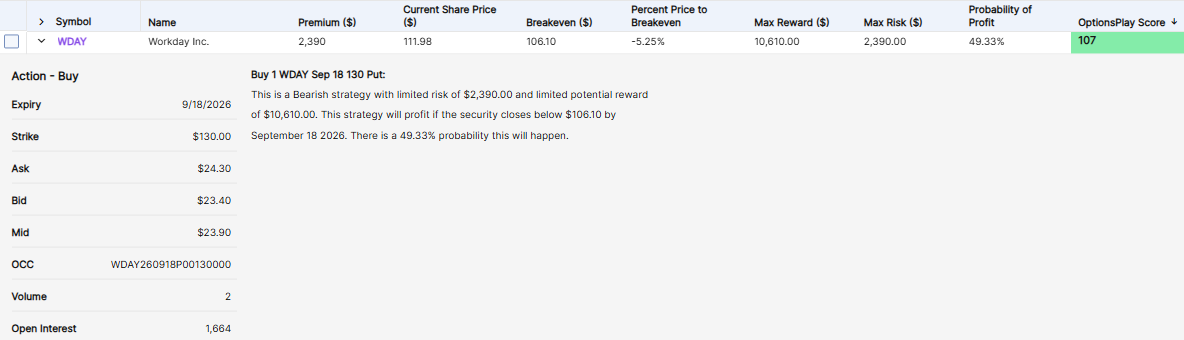
| Additional Data: | |
| Bid/Ask Spread | 3.85% |
| Delta | -63.4 |
| Gamma | 1.16 |
| Implied Volatility | 61.73% |
| Expiry Date | 88 |
| Earnings Date | 8/20/2026 |
Income (Short Put)
Live Nation Entertainment (LYV) July 24 $160 Short Put

| Additional Data: | |
| Ann. Static Return | 23.62% |
| Bid/Ask Spread | 45.83% |
| Delta | 25.9 |
| Gamma | -1.81 |
| Implied Volatility | 33.30% |
| Expiry Date | 32 |
| Earnings Date | 8/6/2026 |
Daily Equity & Market Analysis
Loading, Please Wait...
