Most Requested Symbols

With the reported end of the war with Iran over the weekend, several energy focused areas deteriorated materially with trading on 6/15. We focus on energy today.
Is your custom model killing it? Do you have a great model idea that you haven’t road tested yet? Put it to the test in the NDW Custom Model Competition.
The count of extreme daily moves for SPX is lower than usual.
Weekly Rundown Video – June 10, 2026
Weekly Rundown Video – June 10, 2026
Weekly Rundown Video – June 10, 2026
Markets gained ground over the course of trading Monday (6/15) as news of a peace deal between the US and Iran surfaced over the weekend. Broader domestic equity indices advanced swiftly on the news, with the S&P 500 picking up nearly 2% for the day. Assuming this current agreement sticks, the deal will end a nearly 4 month conflict, during which SPX gained roughly 10% (2/28/26-6/15/26). The tech focused Nasdaq 100 (NDX), which gained roughly 3% during Monday’s trading, picked up over 20% during that same time frame as a semiconductor focused AI rally pushed markets to new all time highs. Monday’s move fell largely in line with that one might “expect” on news of the deal, seeing equity markets advance while parts of the energy complex declined. Crude oil fell back down into the upper $70’s/low $80's , moving back down below a range of seemingly key support established since the beginning of the conflict at the end of February. The 2-point chart (different than the default 1-point chart) for CL/ below has rattled off a series of four consecutive sell signals, putting together a pretty convincing onslaught of lower highs since 2026 highs up around $118. From a conversational perspective, a convincing break of the $78-$80 mark signals the idea that markets are convinced that the war in the Middle East is over…. At least for now.
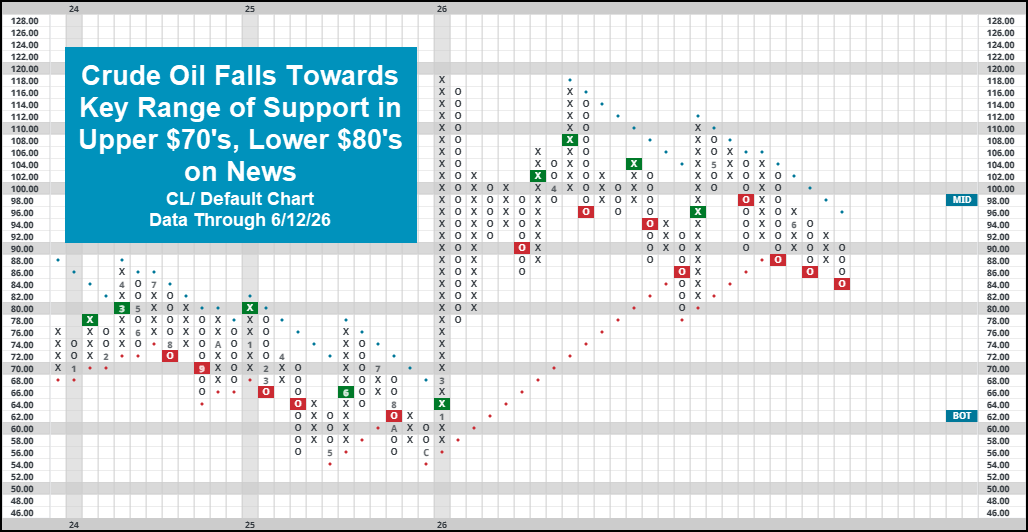
While energy still ranks towards the top of our rankings either by DALI (dynamic asset level investing) or the asset class group scores page, the writing on the wall has been quite clear that its leadership has been fading. Energy is historically the most susceptible to rapid price swings based on supply/demand developments, and this most recent conflict was no different. Since cresting at a staggering 240+ signal count in the DALI sector rankings throughout March/April, the sector has shed strength, now earning just 217 signals as of 6/15. While this does still leave it in second place behind technology, it was quite clear that said strength was largely dependent on continued conflict around the Strait of Hormuz rather than some organic technical leadership. While it is still “defendable” to hold exposure to the broader energy complex, just keep this idea in mind as we move towards the end of Q2. For an area that was largely based around a supply shock “story”, the dissipation of that tailwind could spell trouble for space. The Asset Class Group Scores page reveals a similar type of commentary- the group remains in “acceptable territory”, but the near negative 1.0 score direction suggests a wane in price leadership.

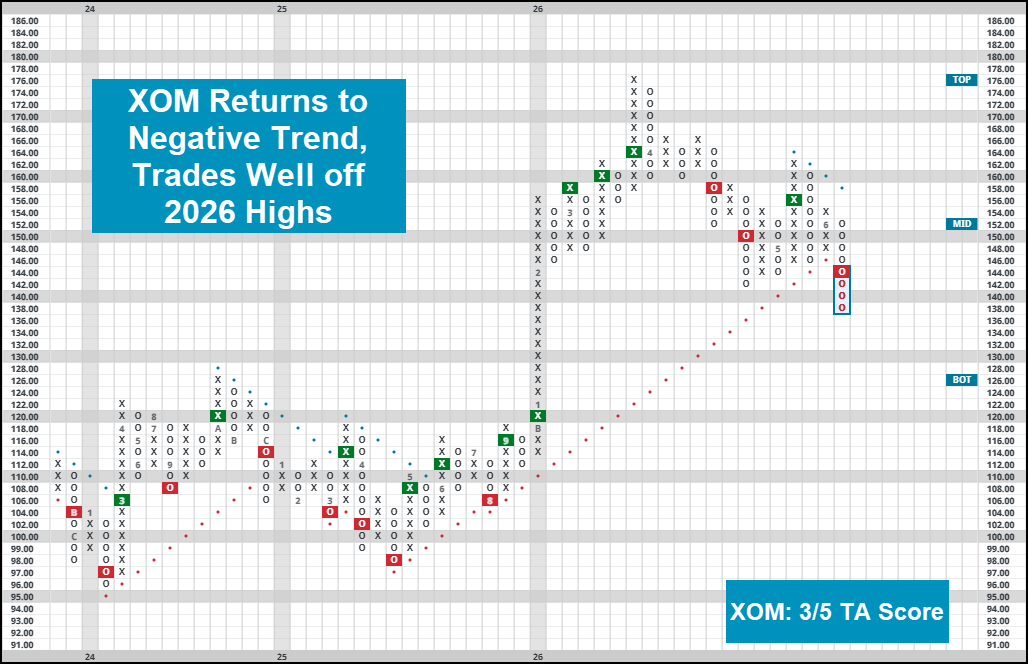
As anticipated, the decline in crude prices also affects the likes of energy-focused equities, an area more likely you or your clients would have direct exposure to. XLE reversed back into O’s on its default chart on 6/15, but its absolute picture remains acceptable. What is more concerning for the space, is the return to a relative strength sell signal for the fund against benchmark SPXEWI, a development which will ding the fund score quite substantially. Other more focused names saw deterioration of their own. XOM, pictured below, declined as much as 4% on the day, returning to a negative trend in the process. All else equal, it will drop the energy giant to a technically acceptable 3/5’er. CVX put in a similar decline, moving back to a negative trend in the process.
Remember, our job is to help contextualize movement as it occurs, helping look through noise clients see on their phones or news channels. In this case, material movement happens to coincide with news headlines, giving us a sign that it is time to watch your exposure to the energy sector rather closely. As always, to do so keep an eye on the charts, using the bell icon to be alerted of major shifts over time.

Is your custom model killing it? Do you have a great model idea that you haven’t road tested yet? Put it to the test in the NDW Custom Model Competition.
NDW Custom Model Competition

July 1 – October 1, 2026
Winners receive three months of NDW Elite Access
All submissions must be received by 4:00 PM EDT on Tuesday, June 30, 2026
NDW Custom Model Competition Rules
Model Construction Rules
Scoring
Submissions & Deadlines
Three months of NDW Elite access will be credited to the NDW account of the first-place finishers in the overall and risk-adjusted categories.
The daily market action has been normal so far in 2026, even if it hasn’t always felt that way. The S&P 500 Index (SPX) has gained 8.56% through last Friday (6/12). If we were flat for the rest of the year, we already would have surpassed the annualized return dating back to 1950 (8.12%), but we would trail the annualized return since 2019 (13.78%). The default chart of SPX currently sits in a positive trend, on a sell signal, and in a column of Xs. We saw the chart move to a sell signal after retracting from overbought territory, but we are back within a box of matching all-time highs from earlier this month. It would certainly be great to see the chart go back to a buy signal at fresh highs, but the current technical picture is still healthy.
Another way to look at market action is through our SPX Volatility Study, which measures the percentage of “extreme” market days. Our study simply tracks all the days where SPX either gains or loses 1% in value, then looks at the percentage of those days relative to the total trading days in the year. In 2025, there were 56 days when the market moved at least 1%, equating to about 22% of the annual trading days. The average percentage of extreme days annually sits at about 26% going back to April 1987. This year, we are sitting at 24% of days producing a 1% move, slightly higher than last year but still below the historical average. There were 15 extreme days in the first quarter and another 13 so far in the second quarter (including Monday, 6/15).
Another point to watch is the expectation of reduced volatility in the summer. On average, June and July show the lowest average counts of “extreme” days. August shows an uptick in average volatility that dips back down in September.


This year’s relative calmness becomes clearer if we only look at days when SPX showed a 2% move. There have only been four 2% days in 2026. The core market benchmark has averaged eight such days in the first half of any year back to 1987, but the median sits at four days. There are some large outliers that sway the averages, including 12 days in 2025 and 25 days in 2022. We have actually seen 25 out of the 40 years examined show four or fewer 2% days through the first six months. There have been several long stretches of relative calmness where SPX went years without more than four 2% days in the first half, including 1989 through 1996, 2004 through 2007, and 2011 through 2016.

It can be easy to get caught up in the daily headlines touting risks in the marketplace. One of the current risks is the fear of an AI-induced market bubble. Many have drawn comparisons to the dawn of the internet age in the late 1990s that ultimately led to a bear market when the bubble burst in the early 2000s. Looking strictly at historical performance, there are certainly similarities. We saw five straight years of 15%+ gains for SPX from 1995 through 1999. Currently, we are on pace to mark our fourth consecutive year of 15%+ gains. However, this performance has not been accompanied by the same level of day-to-day volatility. The annual percentage of 1% daily moves reached 32% in 1997 and did not move back below 30% until 2004. That stretch also saw substantially more 2% days. While the count of extreme days has been advancing for three years, we are not at levels that would suggest irrational behavior from market participants.

Average Level
12.08
| < - -100 | -100 - -80 | -80 - -60 | -60 - -40 | -40 - -20 | -20 - 0 | 0 - 20 | 20 - 40 | 40 - 60 | 60 - 80 | 80 - 100 | 100 - > |
|---|---|---|---|---|---|---|---|---|---|---|---|
|
Buy signalVOOG
|
Buy signalicf
|
||||||||||
|
Buy signalONEQ
|
Buy signaliwm
|
||||||||||
|
Sell signalief
|
Buy signalefa
|
Buy signaldia
|
|||||||||
|
Sell signalshy
|
Sell signalagg
|
Sell signaldx/y
|
Buy signalQQQ
|
Buy signalijr
|
|||||||
|
Sell signalgld
|
Buy signalfxe
|
Buy signalhyg
|
Buy signaltlt
|
Buy signalEEM
|
Buy signalIJH
|
Buy signalrsp
|
|||||
|
Buy signalGCC
|
Sell signalgsg
|
Sell signaluso
|
Buy signalXLG
|
Sell signallqd
|
Buy signalSPY
|
Buy signalVOOV
|
Buy signaldvy
|
||||
| < - -100 | -100 - -80 | -80 - -60 | -60 - -40 | -40 - -20 | -20 - 0 | 0 - 20 | 20 - 40 | 40 - 60 | 60 - 80 | 80 - 100 | 100 - > |
| AGG | iShares US Core Bond ETF |
| USO | United States Oil Fund |
| DIA | SPDR Dow Jones Industrial Average ETF |
| DVY | iShares Dow Jones Select Dividend Index ETF |
| DX/Y | NYCE U.S.Dollar Index Spot |
| EFA | iShares MSCI EAFE ETF |
| FXE | Invesco CurrencyShares Euro Trust |
| GLD | SPDR Gold Trust |
| GSG | iShares S&P GSCI Commodity-Indexed Trust |
| HYG | iShares iBoxx $ High Yield Corporate Bond ETF |
| ICF | iShares Cohen & Steers Realty ETF |
| IEF | iShares Barclays 7-10 Yr. Tres. Bond ETF |
| LQD | iShares iBoxx $ Investment Grade Corp. Bond ETF |
| IJH | iShares S&P 400 MidCap Index Fund |
| ONEQ | Fidelity Nasdaq Composite Index Track |
| QQQ | Invesco QQQ Trust |
| RSP | Invesco S&P 500 Equal Weight ETF |
| IWM | iShares Russell 2000 Index ETF |
| SHY | iShares Barclays 1-3 Year Tres. Bond ETF |
| IJR | iShares S&P 600 SmallCap Index Fund |
| SPY | SPDR S&P 500 Index ETF Trust |
| TLT | iShares Barclays 20+ Year Treasury Bond ETF |
| GCC | WisdomTree Continuous Commodity Index Fund |
| VOOG | Vanguard S&P 500 Growth ETF |
| VOOV | Vanguard S&P 500 Value ETF |
| EEM | iShares MSCI Emerging Markets ETF |
| XLG | Invesco S&P 500 Top 50 ETF |
| Symbol | Company | Sector | Current Price | Action Price | Target | Stop | Notes |
|---|---|---|---|---|---|---|---|
| GRMN | Garmin Ltd. | Leisure | $238.10 | mid 230s - mid 260s | 364 | 196 | 5 TA rating, LT pos trend and mkt RS buy, top 33% of LEIS sector matrix, buy-on-pullback |
| OSW | OneSpaWorld Holdings Ltd. | Leisure | $25.79 | 22 - 24 | 30.50 | 19 | 5 for 5'er, top half of LEIS sector matrix, LT pos peer & mkt RS, spread quintuple top |
| IBOC | International Bancshares Corporation | Banks | $76.53 | low-to-mid 70s | 93 | 63 | 4 for 5'er, favored BANK sector, LT pos peer & mkt RS, bearish signal reversal, R-R~2.0, 1.95% yield |
| LYV | Live Nation Entertainment Inc. | Leisure | $172.51 | low 160s to mid 170s | 202 | 142 | 4 for 5'er; Pos. Trend; Top Half of Leisure Matrix; Within one box of ATH. |
| MO | Altria Group Inc. | Food Beverages/Soap | $71.94 | low-to-mid 70s | 91 | 62 | 4 for 5'er, top quartile of FOOD sector matrix, one box from RS buy, bullish triangle, 5.9% yield |
| MPC | Marathon Petroleum Corp. | Oil Service | $263.58 | 240 - 260 | 360 | 208 | 4 for 5'er, pos. trend, top third of Oil Services matrix, pos. L-T Mkt and Peer RS. |
| C | Citigroup, Inc. | Banks | $139.83 | low 120s - low 130s | 188 | 102 | 5 for 5'er since July '25; top decile of Banks matrix; pos. trend since May '25. |
| CTRE | CareTrust REIT Inc | Real Estate | $36.85 | $38 - $43 | 62.50 | 34 | 5/5'er since Apr. '25, top quintile of Real Estate Matrix, pos. trend and buy signal since Jul. '23. |
| BTI | British American Tobacco Sp-Adr (United Kingdom) ADR | Food Beverages/Soap | $62.32 | hi 50s - low 60s | 92 | 51 | 4 for 5'er, top 25% of FOOD sector matrix, one box from mkt RS buy, buy on pullback, R-R~3.0, 5.3% yield |
| LAMR | Lamar Advertising Company | Media | $154.37 | mid 140 to mid 150 | 228 | 122 | 5 for 5'er, top third of Media Matrix, pos. trend, Reward-Risk > 11, current yield > 4%. |
| CM | Canadian Imperial Bank of Commerce | Banks | $113.46 | 100s | 165 | 90 | 5 for 5'er, top 10% of favored BANK sector matrix, LT pos peer RS, bearish signal reversal, R-R>3.0, 2.9% yield |
| JCI | Johnson Controls International PLC | Building | $144.96 | upper 130s to lower 150s | 182 | 124 | 4 for 5'er since Apr. '25, top 25% of Building sector matrix, pos. trend, ATH on 6/3. |
| EBAY | eBay Inc. | Retailing | $108.61 | mid 100s - low 110s | 161 | 93 | 5 for 5'er, top 10% of RETA sector matrix, buy on pullback, R-R~3.0 |
| F | Ford Motor Company | Autos and Parts | $14.84 | 14.50 - 16 | 27 | 12.50 | 5 for 5'er, top 20% of AUTO sector matrix, RS buy signal, spread triple top, R-R~5, 3.9% yield |
| HLT | Hilton Worldwide Holdings Inc | Leisure | $345.95 | low 320 - low 340 | 452 | 284 | 5 for 5'er since Nov. '23, top half of Leisure sector matrix, pos. trend since Nov. '23, buy since April. |
| IBM | International Business Machines Corp. | Computers | $272.24 | 260s - 270s | 364 | 270 | 4 for 5'er, top half of favored COMP sector matrix, LT pos peer RS, buy on pullback, good R-R, 2.4% yield |
| CFG | Citizens Financial Group Inc | Banks | $67.65 | low to hi 60s | 87 | 54 | 5 for 5'er, top quintile of Banks matrix, LT pos. trend, Reward-Risk > 4, Earn. 7/16. |
| SPHR | Sphere Entertainment Co. | Leisure | $153.25 | 140s - 150s | 204 | 122 | 5 for 5'er, top 20% of LEIS sector matrix, spread quintuple top, good R-R |
| USFD | US Foods Holding Corp. | Food Beverages/Soap | $93.32 | 90s | 123 | 79 | 4 for 5'er, top half of FOOD sector matrix, LT pos peer & mkt RS, pos trend flip, R-R~2.0 |
| Symbol | Company | Sector | Current Price | Action Price | Target | Stop | Notes |
|---|
| Symbol | Company | Sector | Current Price | Action Price | Target | Stop | Notes |
|---|---|---|---|---|---|---|---|
| VLO | Valero Energy Corp | Oil Service | $258.67 | mid 230s - hi 250s | 328 | 212 | VLO has fallen to a sell signal. OK to hold here. Maintain $212 stop. |
| TT | Trane Technologies PLC | Building | $458.25 | 420s - 470s | 652 | 380 | TT has fallen to a sell signal. OK to hold here. Raise stop to $388. |
| Comment | |||||||
|---|---|---|---|---|---|---|---|
|
|
|||||||
USFD US Foods Holding Corp. R ($93.59) - Food Beverages/Soap - USFD is a 4 for 5'er that ranks in the top half of the food beverages/soap sector matrix and has been on peer and market RS buy signals since 2020. After giving three consecutive sell signals, USFD returned to a buy signal last week when it broke a double top at $87 and continued higher, moving to a positive trend when it hit $90. Long exposure may be added in the $90s and we will set our initial stop at $79, a potential spread triple bottom break on USFD's chart. We will use the bullish price objective, $123, as our target price, giving us a reward-to-risk ratio north of 2.0.
| 102.00 | X | 102.00 | |||||||||||||||||||||||||||
| 100.00 | X | O | Top | 100.00 | |||||||||||||||||||||||||
| 99.00 | X | O | 99.00 | ||||||||||||||||||||||||||
| 98.00 | X | O | 98.00 | ||||||||||||||||||||||||||
| 97.00 | X | O | 97.00 | ||||||||||||||||||||||||||
| 96.00 | X | O | • | 96.00 | |||||||||||||||||||||||||
| 95.00 | X | O | X | 5 | • | • | 95.00 | ||||||||||||||||||||||
| 94.00 | X | O | X | O | X | X | O | X | • | 94.00 | |||||||||||||||||||
| 93.00 | X | 3 | X | O | X | 4 | X | X | O | X | O | X | O | • | X | 93.00 | |||||||||||||
| 92.00 | X | O | X | O | X | X | O | X | O | X | O | X | O | X | O | X | O | • | X | 92.00 | |||||||||
| 91.00 | X | O | X | O | X | O | X | O | X | O | X | O | X | O | X | O | • | O | • | X | 91.00 | ||||||||
| 90.00 | X | O | X | O | X | O | X | O | O | X | O | X | O | • | • | O | • | X | 90.00 | ||||||||||
| 89.00 | X | O | X | O | X | O | O | O | • | O | X | 89.00 | |||||||||||||||||
| 88.00 | X | X | O | X | O | • | O | X | 88.00 | ||||||||||||||||||||
| 87.00 | X | O | X | O | • | O | X | X | Mid | 87.00 | |||||||||||||||||||
| 86.00 | X | O | X | • | O | X | O | X | X | 86.00 | |||||||||||||||||||
| 85.00 | 2 | O | • | O | X | O | X | O | X | 85.00 | |||||||||||||||||||
| 84.00 | O | X | • | O | O | X | O | X | 84.00 | ||||||||||||||||||||
| 83.00 | O | X | • | O | O | 6 | 83.00 | ||||||||||||||||||||||
| 82.00 | O | X | • | O | X | 82.00 | |||||||||||||||||||||||
| 81.00 | O | X | • | O | X | 81.00 | |||||||||||||||||||||||
| 80.00 | O | • | O | • | 80.00 |

| AA Alcoa Inc. ($64.18) - Metals Non Ferrous - AA gave a second consecutive sell signal and violated its trend line Monday when it broke a double bottom at $65. The negative trend change will drop the stock to a 3 for 5'er. From here, the next level of support sits at $61, |
| AAL American Airlines Group Inc. ($15.50) - Aerospace Airline - AAL broke a spread triple top at $15.50 for a second buy signal. The stock improved to a 3 for 5'er following a reversal back into Xs on both the market and peer RS chart and shifting the long-term trend back to positive. Note resistance at $16.50, the January 2026 rally high. Initial support lies at $13.50, while the bullish support line resdies at $12.50. |
| BKR Baker Hughes Company ($62.64) - Oil Service - BKR fell to a sell signal Monday when it broke a triple bottom at $62. The technical picture for the stock remains positive, however, as BKR is a 5 for 5'er that ranks near the middle of the oil service sector matrix. From here, the next level of support on BKR's chart sits at $59. |
| COF Capital One Financial Corporation ($195.46) - Finance - COF shares moved higher today to break a double top at $188 to mark its first buy signal and enter a positive trend. This 3 for 5'er has been in on an RS buy signal versus the market since December 2020. COF shares are trading in normalized territory near the middle of their ten-week trading band. From here, support is offered at $176. |
| CVX Chevron Corporation ($181.17) - Oil - CVX fell to a sell signal and a negative trend Monday when it broke a double bottom at $180. The negative trend change will drop CVX to an unfavorable 2 for 5'er. CVX now sits against support at $178. However, beyond this level, the chart shows no further support until $156. |
| DAL Delta Air Lines Inc. ($84.29) - Aerospace Airline - DAL broke a double top at $84 for a second buy signal as shares rallied to $87, marking a new all-time chart high. DAL maintains a 4 technical attribute rating and currently ranks within the top quintile of the Aerospace Airline sector matrix. Okay to consider on a pullback to the low $80s or upper $70s. Initial support resides at $77, while the bullish support line sits at $70. |
| DVN Devon Energy Corporation ($43.70) - Oil - DVN gave a second consecutive sell signal and violated its trend line Monday when it broke a triple bottom at $43. The negative trend change will drop DVN to an unfavorable 2 for 5'er. From here, the next level of support sits at $42. |
| EOG EOG Resources, Inc. ($132.31) - Oil - EOG fell to a sell signal and a negative trend Monday when it broke a double bottom at $134. The negative trend change will drop the stock to a weak 1 for 5'er. EOG now sits against support at $130. |
| FDX FedEx Corporation ($340.72) - Aerospace Airline - FDX pushed to new highs today, posting its second consecutive buy signal in the process. The technical picture for this 4/5'er is quite strong, seeing the name establish some localized support just above the middle of the trading band at $320. This support also comes in around a range of old resistance, suggesting that buyers are confident in the names ability to push higher from here. FDX ranks 11th out of 58 within the aerospace airlines sector matrix. |
| PII Polaris Inc. ($70.63) - Leisure - PII broke a triple top at $72 for a second buy signal as shares rallied to $73. The stock has been a 4 for 5'er since April and currently ranks within the top quartile of the Leisure sector matrix. Note resistance in the mid $70s dating to late 2025. Initial support lies in the $66 to $67 range, while additional resides at in the $58 to $60 range. |
| SHEL Shell PLC Sponsored ADR ($82.81) - Oil - SHEL gave a fourth consecutive sell signal and violated its trend line in Monday's trading. The negative trend change will drop the stock to a 3 for 5'er. From here, the next level of support on SHEL's chart sits at $77. |
| VLO Valero Energy Corp ($249.08) - Oil Service - VLO gave an initial sell signal Monday when it broke a double bottom at $244, where it now sits against its bullish support line. The outlook for the stock remains positive despite Monday's move as VLO is a 4 for 5'er that ranks in the top quartile of the oil service sector matrix. |
| XOM Exxon Mobil Corporation ($141.46) - Oil - XOM fell to a sell signal and a negative trend Monday when it broke a double bottom at $144 and continued lower taking out additional support at $144 and $142. The negative trend change will drop XOM to a still-acceptable 3 for 5'er. However, those with long exposure should note that XOM shows no additional support on its chart $112. |
The option suggestions featured here are pulled from the NDW Options Ideas tool. These are just a sample of the ideas that can be found there. The Options Idea tool contains numerous additional income and speculative plays. It also offers relative strength-based screens targeting the highest (and lowest) relative strength stocks and ETFs that have recently moved counter to their longer-term trend. To access or subscribe to the Options Ideas tool click here.
Call
The TJX Companies Inc (TJX) September 18 $160 Call

| Additional Data: | |
| Bid/Ask Spread | 7.56% |
| Delta | 68.96 |
| Gamma | 1.82 |
| Implied Volatility | 23.57% |
| Expiry Days | 95 |
| Earnings Date | 8/19/2026 |
Put
Pan American Silver Corp (PAAS) Oct 16 $50 Put

| Additional Data: | |
| Bid/Ask Spread | 13.46% |
| Delta | -40.26 |
| Gamma | 2.43% |
| Implied Volatility | 55.85% |
| Expiry Days | 123 |
| Earnings Date | 8/5/2026 |
Income (Covered Call)
International Business Machines (IBM) July 31 $310 Covered Call

| Additional Data: | |
| Ann. Static Return | 20.50% |
| Bid/Ask Spread | 25.45% |
| Delta | 76.2 |
| Gamma | -0.64 |
| Implied Volatility | 49.33% |
| Expiry Days | 46 |
| Earnings Date | 7/22/2026 |
Daily Equity & Market Analysis
Loading, Please Wait...
