With the reported end of the war with Iran over the weekend, several energy focused areas deteriorated materially with trading on 6/15. We focus on energy today.
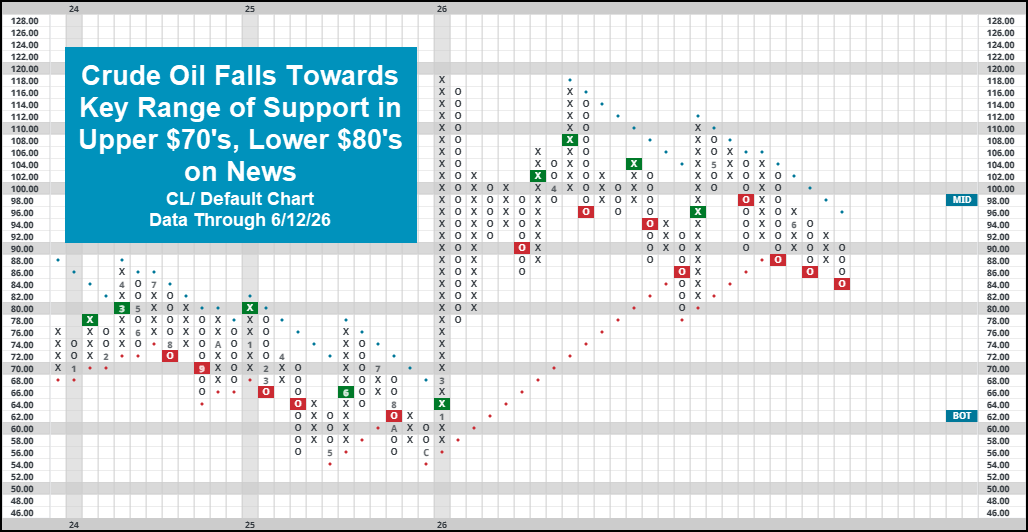
Markets gained ground over the course of trading Monday (6/15) as news of a peace deal between the US and Iran surfaced over the weekend. Broader domestic equity indices advanced swiftly on the news, with the S&P 500 picking up nearly 2% for the day. Assuming this current agreement sticks, the deal will end a nearly 4 month conflict, during which SPX gained roughly 10% (2/28/26-6/15/26). The tech focused Nasdaq 100 (NDX), which gained roughly 3% during Monday’s trading, picked up over 20% during that same time frame as a semiconductor focused AI rally pushed markets to new all time highs. Monday’s move fell largely in line with that one might “expect” on news of the deal, seeing equity markets advance while parts of the energy complex declined. Crude oil fell back down into the upper $70’s/low $80's , moving back down below a range of seemingly key support established since the beginning of the conflict at the end of February. The 2-point chart (different than the default 1-point chart) for CL/ below has rattled off a series of four consecutive sell signals, putting together a pretty convincing onslaught of lower highs since 2026 highs up around $118. From a conversational perspective, a convincing break of the $78-$80 mark signals the idea that markets are convinced that the war in the Middle East is over…. At least for now.
While energy still ranks towards the top of our rankings either by DALI (dynamic asset level investing) or the asset class group scores page, the writing on the wall has been quite clear that its leadership has been fading. Energy is historically the most susceptible to rapid price swings based on supply/demand developments, and this most recent conflict was no different. Since cresting at a staggering 240+ signal count in the DALI sector rankings throughout March/April, the sector has shed strength, now earning just 217 signals as of 6/15. While this does still leave it in second place behind technology, it was quite clear that said strength was largely dependent on continued conflict around the Strait of Hormuz rather than some organic technical leadership. While it is still “defendable” to hold exposure to the broader energy complex, just keep this idea in mind as we move towards the end of Q2. For an area that was largely based around a supply shock “story”, the dissipation of that tailwind could spell trouble for space. The Asset Class Group Scores page reveals a similar type of commentary- the group remains in “acceptable territory”, but the near negative 1.0 score direction suggests a wane in price leadership.

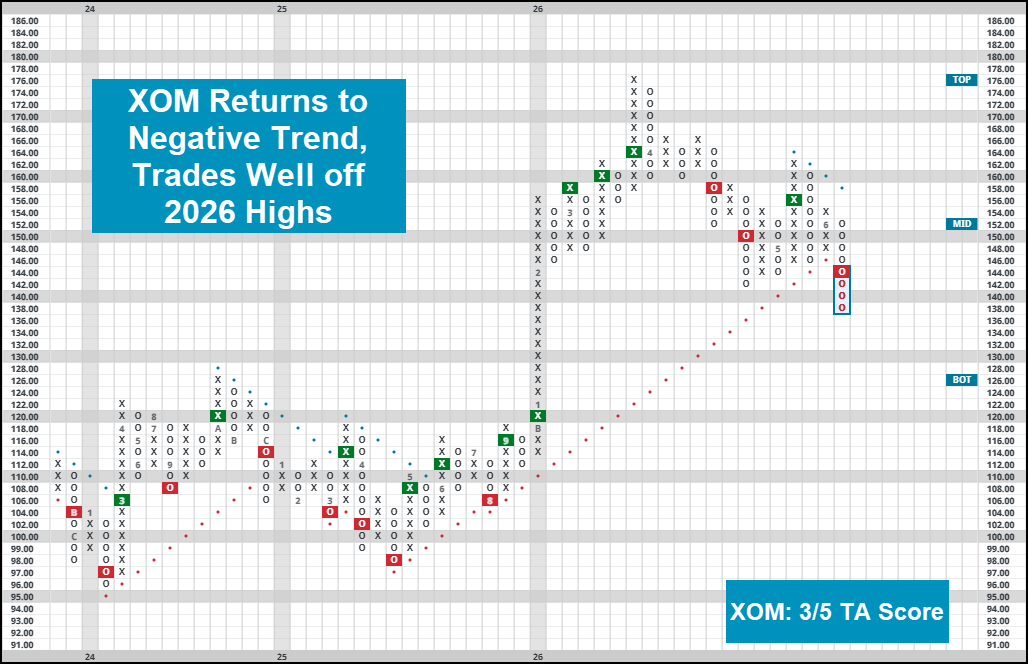
As anticipated, the decline in crude prices also affects the likes of energy-focused equities, an area more likely you or your clients would have direct exposure to. XLE reversed back into O’s on its default chart on 6/15, but its absolute picture remains acceptable. What is more concerning for the space, is the return to a relative strength sell signal for the fund against benchmark SPXEWI, a development which will ding the fund score quite substantially. Other more focused names saw deterioration of their own. XOM, pictured below, declined as much as 4% on the day, returning to a negative trend in the process. All else equal, it will drop the energy giant to a technically acceptable 3/5’er. CVX put in a similar decline, moving back to a negative trend in the process.
Remember, our job is to help contextualize movement as it occurs, helping look through noise clients see on their phones or news channels. In this case, material movement happens to coincide with news headlines, giving us a sign that it is time to watch your exposure to the energy sector rather closely. As always, to do so keep an eye on the charts, using the bell icon to be alerted of major shifts over time.