Most Requested Symbols

Commodities have continued to see shifts in leadership through 2026 as industrial metals overtook energy for the top spot within the NDW DALI Commodity rankings to close out the month of May.
Despite rising oil prices driving headline inflation higher, housing inflation continues to head lower.
NDW Morning Update Video - June 10, 2026
Morning Update Video
Commodities have continued to see shifts in leadership through 2026. After beginning the year with precious metals carrying the leadership baton, industrial metals spent a brief period as the top commodity in February before energy raced out to take the top spot in early March. While the energy space continues to garner the headlines, industrial metals overtook energy for the top spot within the NDW DALI Commodity rankings to close out the month of May. Though the focus is often on leadership and participation in those trends, monitoring action within laggard areas is equally as important for portfolio allocation.

The major industrial commodity, copper, has been the primary driver in the sub-asset’s recent ascension. Back in early May, an article in Daily Equity Report noted the relative gain the United States Copper Index Fund (CPER) against the SPDR Gold Trust (GLD). Since then, CPER gave a second buy signal and flipped the trend back to positive on the default point and figure trend chart as the fund rallied to a new chart high at $40.50 by mid-May. The push to highs and maintaining near those highs to cap off May led to CPER showing positive long-term relative strength against the likes of oil representative Invesco DB Oil Fund (DBO). After matching the chart high early last week to kick off June, Friday’s (6/5) trading brought the trend chart back into Os, towards the middle of the 10-week trading, and actionable territory.

As mentioned, maintaining exposure to leadership like copper within a commodity’s sleeve and understanding the implications of long-term strength from the industrial metals space can help guide a portfolio elsewhere in other assets. Additionally, understanding weakness within laggard areas can have similar effects. While inflation protection, among other factors, saw the SPDR Gold Trust (GLD) push higher the past two years, action in 2026 has seen the commodity consolidate. After a brief rally in the latter part of March and early April saw a couple buy signals given on the trend chart, GLD returned to a sell signal in mid-April before giving additional sell signals. Friday’s (6/5) trading culminated in GLD giving a third sell signal as the fund tested long-term support at $400 before seeing intraday action Tuesday violate that support GLD fell to $390 on the chart. Support can be found in the $365 and $370 range before getting down to support in the lower $300 range. While a tactical portfolio may be avoiding or underweighting precious metals portfolio, continued weakness from the space – like continued strength from industrial metals – can have notable implications on potential portfolio allocations in other assets.


There has been plenty of talk about inflation over the last few years. That conversation has had its moments of being hot or cold, but recently it’s been hot as oil prices rose significantly following the start of the Iranian conflict. Headline inflation has ticked up; however, the housing market has cooled off. According to Zillow’s Observed Rent Index (ZORI), YoY rental rate growth has been less than 2% for four consecutive months. Over the last twenty years, there have been only four other periods when YoY % in ZORI was less than 2% for four consecutive months: 2020, 2014-2015, and 2009-2012. The 2020 covid environment was due to the exogenous circumstances of the period rather than underlying weakness in the housing market like the other two periods. Nonetheless, this is the weakest housing market we’ve seen in terms of rental rate growth in over a decade and is not supportive of higher inflation once/if oil prices begin to come down.

The price action in homebuilder stocks suggests the market has been anticipating shrinking margins for some time. The State Street SPDR S&P Homebuilders ETF (XHB) has not made a new all-time high since November 2024 and underperformed the S&P 500 by over 40% since then. XHB has rallied back to its negative trend line, but the technical picture is overwhelmingly weak. With both builder price action and rental rate growth in a poor state, the backdrop for the housing market is not conducive to higher inflation from that section of the market.

The immediate takeaway from this information is that homebuilders should generally be avoided for now. If we look at a comparison between YoY % changes in the Zillow Observed Rent Index and Headline CPI they are usually correlated. Headline CPI is a bit more volatile with things like food and energy, but historically tracks well with rental rate growth at least directionally. The divergence between the two recently is clear on the chart below as rental rate growth has headed lower for over a year now. Headline CPI was tracking along with rental rate growth for most of the last year until the recent oil price shock. If or when we get a resolution of that conflict, it can be expected that headline CPI will begin to track back down to where rental rate growth has been heading. This would open up interesting opportunities on the fixed income side which has been an out of favor asset class for some time. While it will not compete with equities until there’s some relative strength, there could be more viable use cases for fixed income in the near future.

Average Level
4.89
| < - -100 | -100 - -80 | -80 - -60 | -60 - -40 | -40 - -20 | -20 - 0 | 0 - 20 | 20 - 40 | 40 - 60 | 60 - 80 | 80 - 100 | 100 - > |
|---|---|---|---|---|---|---|---|---|---|---|---|
|
Buy signalEEM
|
|||||||||||
|
Sell signalagg
|
Buy signalIJH
|
Buy signalVOOV
|
|||||||||
|
Buy signalGCC
|
Buy signalXLG
|
Buy signalVOOG
|
|||||||||
|
Sell signaltlt
|
Buy signaliwm
|
Buy signalrsp
|
|||||||||
|
Sell signalgld
|
Sell signallqd
|
Buy signalefa
|
Buy signalijr
|
Buy signalSPY
|
|||||||
|
Sell signalief
|
Buy signalhyg
|
Buy signaldvy
|
Sell signaldx/y
|
Buy signaldia
|
|||||||
|
Sell signalshy
|
Buy signalfxe
|
Buy signalGSG
|
Sell signaluso
|
Buy signalicf
|
Buy signalONEQ
|
Buy signalQQQ
|
|||||
| < - -100 | -100 - -80 | -80 - -60 | -60 - -40 | -40 - -20 | -20 - 0 | 0 - 20 | 20 - 40 | 40 - 60 | 60 - 80 | 80 - 100 | 100 - > |
| AGG | iShares US Core Bond ETF |
| USO | United States Oil Fund |
| DIA | SPDR Dow Jones Industrial Average ETF |
| DVY | iShares Dow Jones Select Dividend Index ETF |
| DX/Y | NYCE U.S.Dollar Index Spot |
| EFA | iShares MSCI EAFE ETF |
| FXE | Invesco CurrencyShares Euro Trust |
| GLD | SPDR Gold Trust |
| GSG | iShares S&P GSCI Commodity-Indexed Trust |
| HYG | iShares iBoxx $ High Yield Corporate Bond ETF |
| ICF | iShares Cohen & Steers Realty ETF |
| IEF | iShares Barclays 7-10 Yr. Tres. Bond ETF |
| LQD | iShares iBoxx $ Investment Grade Corp. Bond ETF |
| IJH | iShares S&P 400 MidCap Index Fund |
| ONEQ | Fidelity Nasdaq Composite Index Track |
| QQQ | Invesco QQQ Trust |
| RSP | Invesco S&P 500 Equal Weight ETF |
| IWM | iShares Russell 2000 Index ETF |
| SHY | iShares Barclays 1-3 Year Tres. Bond ETF |
| IJR | iShares S&P 600 SmallCap Index Fund |
| SPY | SPDR S&P 500 Index ETF Trust |
| TLT | iShares Barclays 20+ Year Treasury Bond ETF |
| GCC | WisdomTree Continuous Commodity Index Fund |
| VOOG | Vanguard S&P 500 Growth ETF |
| VOOV | Vanguard S&P 500 Value ETF |
| EEM | iShares MSCI Emerging Markets ETF |
| XLG | Invesco S&P 500 Top 50 ETF |

| Symbol | Company | Sector | Current Price | Action Price | Target | Stop | Notes |
|---|---|---|---|---|---|---|---|
| BPOP | Popular, Inc. | Banks | $153.66 | hi 130s - low 150s | 200 | 120 | 5 for 5'er, 18 of 174 in favored BANK sector matrix, LT pos peer & mkt RS, triple top, good R-R, 2% yield |
| GRMN | Garmin Ltd. | Leisure | $235.23 | mid 230s - mid 260s | 364 | 196 | 5 TA rating, LT pos trend and mkt RS buy, top 33% of LEIS sector matrix, buy-on-pullback |
| OSW | OneSpaWorld Holdings Ltd. | Leisure | $24.28 | 22 - 24 | 30.50 | 19 | 5 for 5'er, top half of LEIS sector matrix, LT pos peer & mkt RS, spread quintuple top |
| SKT | Tanger Inc. | Real Estate | $37.04 | mid-to-hi 30s | 48 | 31 | 5 for 5'er, top 25% of REAL sector matrix, LT pos peer & mkt RS, R-R~2.0, 3.2% yield |
| IBOC | International Bancshares Corporation | Banks | $73.49 | low-to-mid 70s | 93 | 63 | 4 for 5'er, favored BANK sector, LT pos peer & mkt RS, bearish signal reversal, R-R~2.0, 1.95% yield |
| MSGE | Madison Square Garden Entertainment Corp. | Leisure | $72.22 | 63 to 69 | 98 | 53 | 5 for 5'er since Nov. 2025; Top Decile of Leisure Matrix; Pos. Trend since May 2025; ATH 5/7. |
| LYV | Live Nation Entertainment Inc. | Leisure | $159.51 | low 160s to mid 170s | 202 | 142 | 4 for 5'er; Pos. Trend; Top Half of Leisure Matrix; Within one box of ATH. |
| MO | Altria Group Inc. | Food Beverages/Soap | $71.29 | low-to-mid 70s | 91 | 62 | 4 for 5'er, top quartile of FOOD sector matrix, one box from RS buy, bullish triangle, 5.9% yield |
| MPC | Marathon Petroleum Corp. | Oil Service | $266.17 | 240 - 260 | 360 | 208 | 4 for 5'er, pos. trend, top third of Oil Services matrix, pos. L-T Mkt and Peer RS. |
| VLO | Valero Energy Corp | Oil Service | $258.39 | mid 230s - hi 250s | 328 | 212 | 4 TA rating, top 50% of OILS sector matrix, LT pos trend, buy-on-pullback |
| C | Citigroup, Inc. | Banks | $133.28 | low 120s - low 130s | 188 | 102 | 5 for 5'er since July '25; top decile of Banks matrix; pos. trend since May '25. |
| CTRE | CareTrust REIT Inc | Real Estate | $36.92 | $38 - $43 | 62.50 | 34 | 5/5'er since Apr. '25, top quintile of Real Estate Matrix, pos. trend and buy signal since Jul. '23. |
| TT | Trane Technologies PLC | Building | $458.92 | 420s - 470s | 652 | 380 | 5 TA rating, LT pos trend and mkt RS buy, top 50% of Building sector matrix, buy-on-pullback |
| BTI | British American Tobacco Sp-Adr (United Kingdom) ADR | Food Beverages/Soap | $59.69 | hi 50s - low 60s | 92 | 51 | 4 for 5'er, top 25% of FOOD sector matrix, one box from mkt RS buy, buy on pullback, R-R~3.0, 5.3% yield |
| LAMR | Lamar Advertising Company | Media | $149.69 | mid 140 to mid 150 | 228 | 122 | 5 for 5'er, top third of Media Matrix, pos. trend, Reward-Risk > 11, current yield > 4%. |
| CM | Canadian Imperial Bank of Commerce | Banks | $109.52 | 100s | 165 | 90 | 5 for 5'er, top 10% of favored BANK sector matrix, LT pos peer RS, bearish signal reversal, R-R>3.0, 2.9% yield |
| JCI | Johnson Controls International PLC | Building | $144.05 | upper 130s to lower 150s | 182 | 124 | 4 for 5'er since Apr. '25, top 25% of Building sector matrix, pos. trend, ATH on 6/3. |
| EBAY | eBay Inc. | Retailing | $108.44 | mid 100s - low 110s | 161 | 93 | 5 for 5'er, top 10% of RETA sector matrix, buy on pullback, R-R~3.0 |
| F | Ford Motor Company | Autos and Parts | $15.00 | 14.50 - 16 | 27 | 12.50 | 5 for 5'er, top 20% of AUTO sector matrix, RS buy signal, spread triple top, R-R~5, 3.9% yield |
| HLT | Hilton Worldwide Holdings Inc | Leisure | $340.63 | low 320 - low 340 | 452 | 284 | 5 for 5'er since Nov. '23, top half of Leisure sector matrix, pos. trend since Nov. '23, buy since April. |
| Symbol | Company | Sector | Current Price | Action Price | Target | Stop | Notes |
|---|
| Comment | |||||||
|---|---|---|---|---|---|---|---|
|
|
|||||||
HLT Hilton Worldwide Holdings Inc. R ($342.15) - Leisure - HLT has been at least a 3 technical attribute stock since November 2020 and maintained its current 5 TA rating since November 2023. On a relative strength basis, HLT has shown near and long-term positive market RS since October 2022 and near and long-term positive peer RS since October 2021. Within the Leisure sector matrix, the stock has remained within the top of the matrix since November last year. On the trend chart, HLT has maintained a positive trend since November 2023 and returned to a buy signal at the beginning of April this year. Recent action led to a third buy signal at $340, completing a bullish catapult, as shares rallied to match the all-time chart high at $344. Okay to consider in the lower $320 to lower $340 range. The current bullish price objective is $452, giving the stock a reward to risk ratio north of 5. The initial stop loss will be set at $284.
| 26 | |||||||||||||||||||||||||||||
| 344.00 | X | X | 344.00 | ||||||||||||||||||||||||||
| 340.00 | X | O | X | 340.00 | |||||||||||||||||||||||||
| 336.00 | X | O | X | X | 336.00 | ||||||||||||||||||||||||
| 332.00 | X | X | O | X | O | X | 332.00 | ||||||||||||||||||||||
| 328.00 | X | O | X | O | X | O | X | 328.00 | |||||||||||||||||||||
| 324.00 | X | O | X | O | X | X | X | 6 | 324.00 | ||||||||||||||||||||
| 320.00 | X | O | X | O | X | O | X | O | X | • | Mid | 320.00 | |||||||||||||||||
| 316.00 | X | O | X | O | X | O | X | O | X | • | 316.00 | ||||||||||||||||||
| 312.00 | X | O | X | O | 5 | O | • | 312.00 | |||||||||||||||||||||
| 308.00 | X | O | X | 4 | • | • | 308.00 | ||||||||||||||||||||||
| 304.00 | X | 2 | 3 | X | O | X | X | X | • | 304.00 | |||||||||||||||||||
| 300.00 | X | O | X | O | X | O | X | O | X | O | X | • | 300.00 | ||||||||||||||||
| 296.00 | 1 | O | X | O | O | X | O | X | O | X | • | 296.00 | |||||||||||||||||
| 292.00 | X | O | X | O | O | O | • | 292.00 | |||||||||||||||||||||
| 288.00 | X | O | • | • | 288.00 | ||||||||||||||||||||||||
| 284.00 | X | X | • | 284.00 | |||||||||||||||||||||||||
| 280.00 | X | O | X | • | 280.00 | ||||||||||||||||||||||||
| 276.00 | X | X | X | O | X | • | Bot | 276.00 | |||||||||||||||||||||
| 272.00 | O | X | O | X | O | X | C | X | • | 272.00 | |||||||||||||||||||
| 268.00 | O | X | O | B | O | X | O | • | 268.00 | ||||||||||||||||||||
| 264.00 | 9 | X | O | X | O | • | 264.00 | ||||||||||||||||||||||
| 260.00 | O | X | O | X | • | 260.00 | |||||||||||||||||||||||
| 256.00 | A | O | • | 256.00 | |||||||||||||||||||||||||
| 26 |
| AA Alcoa Inc. ($72.06) - Metals Non Ferrous - AA gave an initial sell signal Tuesday when it broke a double bottom at $71. The technical picture for the stock remains positive as AA is a 4 for 5'er. From here, the next level of support is AA's trend line at $66. However, beyond that level, the stock shows no further support until $61. |
| ARM ARM Holdings PLC ADR ($319.84) - Semiconductors - Shares of ARM fell have fallen sharply over the last several days, breaking a double bottom at $336 and moving to a sell signal. Today's move also saw the stock lose its near-term market relative strength, bringing it down to a 4 for 5'er. That said, the stock remains more of a buy given its long-term relative strength, so investors should continue holding. |
| ASH Ashland Inc. ($62.19) - Chemicals - ASH gave an initial buy signal and moved to a positive trend Tuesday when it broke a triple top at $60. The outlook for the stock remains unfavorable, however, as even with the positive trend change ASH is a weak 1 for 5'er. From here, ASH faces overhead resistance at $65. Meanwhile, support can be found at $49. |
| AXP American Express Company ($318.04) - Finance - AXP shares broke a double top at $320 to mark its second consecutive buy signal. This 4 for 5'er has been in a positive trend since April and on an RS buy signal versus the market since February 2022. AXP shares are trading near the middle of their ten-week trading band with a weekly overbought/oversold reading of -6%. From here, support is offered at $304. |
| CCEP Coca-Cola Europacific Partners PLC ($96.59) - Food Beverages/Soap - CCEP inched higher to complete a double top break at $96. The 4 for 5'er moved up from a 3 with its latest move, after reversing back into a positive trend. Additionally, the stock ranks in the top half of the food beverage/soap sector matrix and offers a yield of 2.5%. Long exposure can be made here. Initial strong support is at $90, with additional support at $85. |
| CENX Century Aluminum Co ($61.33) - Metals Non Ferrous - CENX gave a second consecutive sell signal and fell to a negative trend Tuesday when it broke a double bottom at $59. The negative trend change will drop CENX to an unfavorable 2 for 5'er. From here, the next level of support sits at $54. |
| CNR Core Natural Resources Inc. ($90.43) - Oil - CNR gave an initial sell signal Tuesday when it broke a double bottom at $92. The move adds to an already weak technical picture as CNR Is a 2 for 5'er. From here, the next level of support sits at $88. |
| DD DuPont de Nemours Inc. ($46.96) - Chemicals - DD fell to a sell signal Tuesday when it broke a double bottom at $46. The outlook for the stock remains positive, however, as DD is a 5 for 5'er that ranks in the top quartile of the chemicals sector matrix. From here, the next level of support on DD's chart sits at $45. |
| GM General Motors ($83.68) - Autos and Parts - GM broke a double top at $85 for a second buy signal. The breakout occurs after the trend flipped back to positive to finish off May, increasing the stock up to a 5 for 5'er. Okay to consider here on the breakout. Note the stock's all-time high form earlier this year at $87. Initial support lies at $81, while the bullish support line sits at $75. |
| HXL Hexcel Corporation ($92.22) - Aerospace Airline - HXL posted its second consecutive buy signal on its default chart today, gaining roughly 3.5% for the day. The 3/5'er, having recently broken back into a positive trend, is looking to sustain price action between current levels and all time highs back from April of this year. While we aren't sitting at a technically "strong" rating based purely on the technical attribute score, the trend break and series of higher lows between $77 and the middle of the trading band at $88 is constructive. |
| RIO Rio Tinto PLC (United Kingdom) ADR ($101.20) - Metals Non Ferrous - RIO gave an initial sell signal Tuesday when it broke a double bottom at $99. Tuesday's move adds to an unfavorable overall technical picture as RIO is a 2 for 5'er. From here, the next level of support on RIO's chart sits at $97. However, beyond this level it shows no further support until $83. |
| WSM Williams-Sonoma, Inc. ($214.04) - Retailing - WSM broke a spread triple top at $212 for a second buy signal and to bring the stock to its highest chart level since February. The break follows the stock shifting back into a positive trend to cap off May's trading, increasing the stock to a 3 for 5'er. Okay to consider here on the breakout. Note the stock's all-time chart high at $220. Initial support lies at $198, while the bullish support line sits at $170. |

The option suggestions featured here are pulled from the NDW Options Ideas tool. These are just a sample of the ideas that can be found there. The Options Idea tool contains numerous additional income and speculative plays. It also offers relative strength-based screens targeting the highest (and lowest) relative strength stocks and ETFs that have recently moved counter to their longer-term trend. To access or subscribe to the Options Ideas tool click here.
Call
The TJX Companies (TJX) September 18 $160 Call
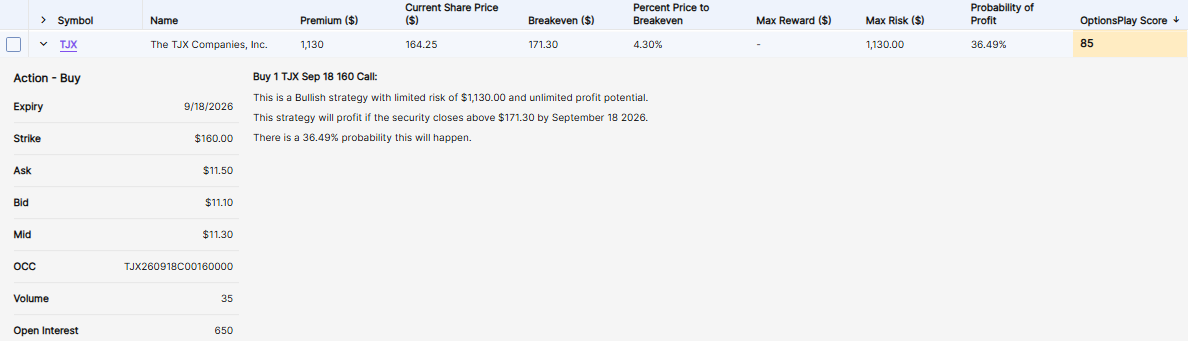
| Additional Data: | |
| Bid/Ask Spread | 3.60% |
| Delta | 63.76 |
| Gamma | 1.83 |
| Implied Volatility | 24.13% |
| Expiry Days | 101 |
| Earnings Date | 8/19/2026 |
Put
Honeywell International Inc (HON) September 18 $220 Put

| Additional Data: | |
| Bid/Ask Spread | 46.15% |
| Delta | -56.56 |
| Gamma | 2.52 |
| Implied Volatility | 37.26% |
| Expiry Days | 101 |
| Earnings Date | 7/23/2026 |
Income (Short Put)
Citigroup, Inc. (C) July 10 $131 Put

| Additional Data: | |
| Ann. Static Return | 34.99% |
| Bid/Ask Spread | 12.90% |
| Delta | 34.9 |
| Gamma | -2.78 |
| Implied Volatility | 31.87% |
| Expiry Days | 31 |
| Earnings Date | 7/14/2026 |
Daily Equity & Market Analysis
Loading, Please Wait...
