
Micron went from an impressive $500 billion market cap to over $1 trillion at record pace. Today, we examine other instances of companies joining the "trillion club"
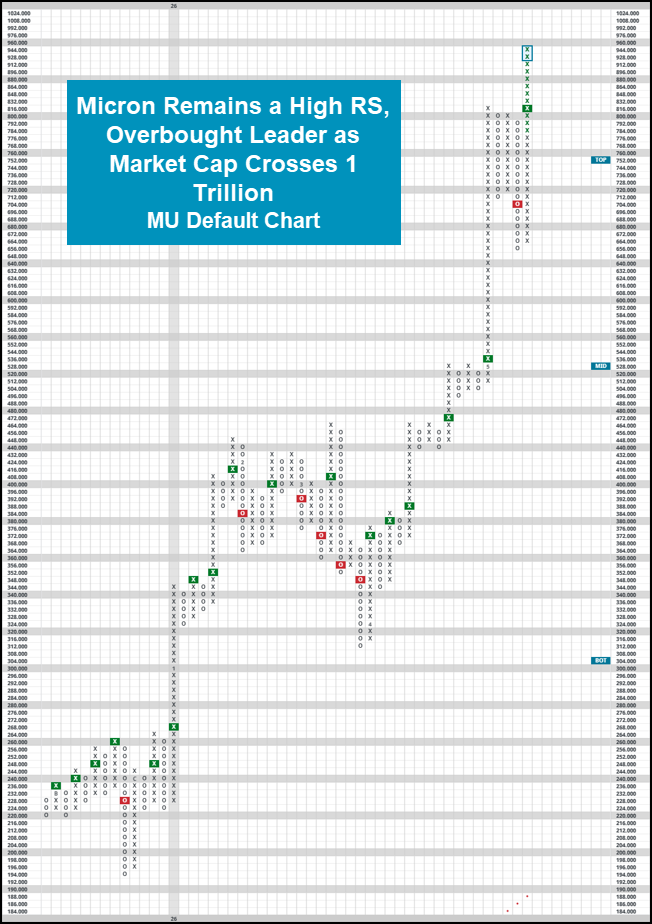
The appreciation of semiconductors has been dizzying, a topic which we have touched on heavily over the last few months’ worth of daily equity reports. What has been less featured, however, are attempts to quantify just how rapid the acceleration has been. Most often, the NDW analyst team will utilize our weekly OBOS values to judge where a name sits in relation to its respective 50-day moving average… with higher values suggesting an asset is more overbought. Outside of that, the astute chartist will utilize a whole host of tools, whether that be performance spreads over some benchmark, other fundamental price justification models/metrics, or maybe even just a “gut” feeling. Today’s feature will utilize market capitalization growth to quantify how semiconductor leader Micron has appreciated relative to other 1 trillion dollar US-listed companies. As of 5/22/2026, Micron joined the “1-trillion dollar club”, the company of 11 other US companies (listed below) that have ever seen their market cap close above 1 trillion dollars. Before a deeper analysis into the rapid uptick in strength for MU, we will offer a brief technical comment on the name for those of you lucky enough to have been a part of this historical right-tail run for the computer memory manufacturer. Up over 210% so far in 2026, MU has obviously been a point of high RS, even when compared to an extraordinarily strong semiconductors sector. It goes without saying that the name lies in heavily overbought territory…. But as evidenced during this run overbought assets are often quite good at getting even more overbought. All that to say, be tactical with adding to new positions, but don’t feel a particular rush in exiting current holdings if you don’t need to reallocate. Momentum is built on harnessing extreme right tail events.
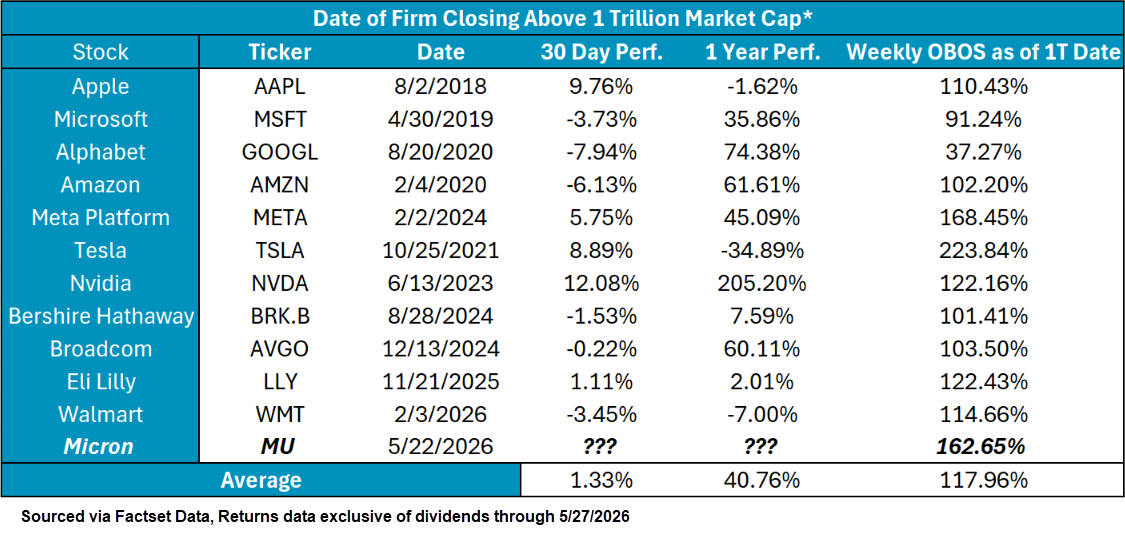
Getting back to the speed at which Micron (and largely semiconductors) have accelerated, we can journey back to our market cap conversation with the table below. The dataset (sourced via FactSet closing data) breaks down each of the 12 companies that have breached the $1 trillion market cap mark over time. From there, we calculated the 30-day and 1-year performance following each company’s close above that point. On average, it is interesting to note that in most circumstances, forward performance continues to accelerate, seeing our 1T club members gain another ~40% in the following year on average (~36% median) and 1.33% in the next 30-days. While Micron is on what we would consider the higher end of each firm’s observed weekly OBOS reading, it isn’t the highest…. That crown goes to TSLA from late 2021. All this to say, history doesn’t suggest that crossing $1,000,000,000,000 means an immediate slowdown is in store. Do note, that the timing of our dataset is admittedly quite narrow- all instances come over the last ten years which for the most part have been quite kind to domestic markets.
That isn’t to say that Micron’s assent to stardom has been “normal” by any means. The next question quickly becomes- how quickly did each of the companies included above move from another notable landmark- say, 500 billion- to 1 trillion in overall market cap? The chart below looks to quantify that, simply by counting the number of trading days it took for each firm to move from one point to the next. You’ll notice companies all along the spectrum up to the 1,670-trading day gap for (BRK.B). Before Micron, previously mentioned TSLA held the record, having moved from one metric to the next in a comparatively minuscule 230 trading days from November 2020-October 2021. Then, enter the March 17-May 22 run for MU- all in 2026 alone. For those not counting, that’s a mere 48 trading days. For context, to move from one mark to the next, MU had to gain over 10b in overall market cap per day on average, not too bad for roughly two months of trading days. Put this way, a slowdown in upside feels almost inevitable.
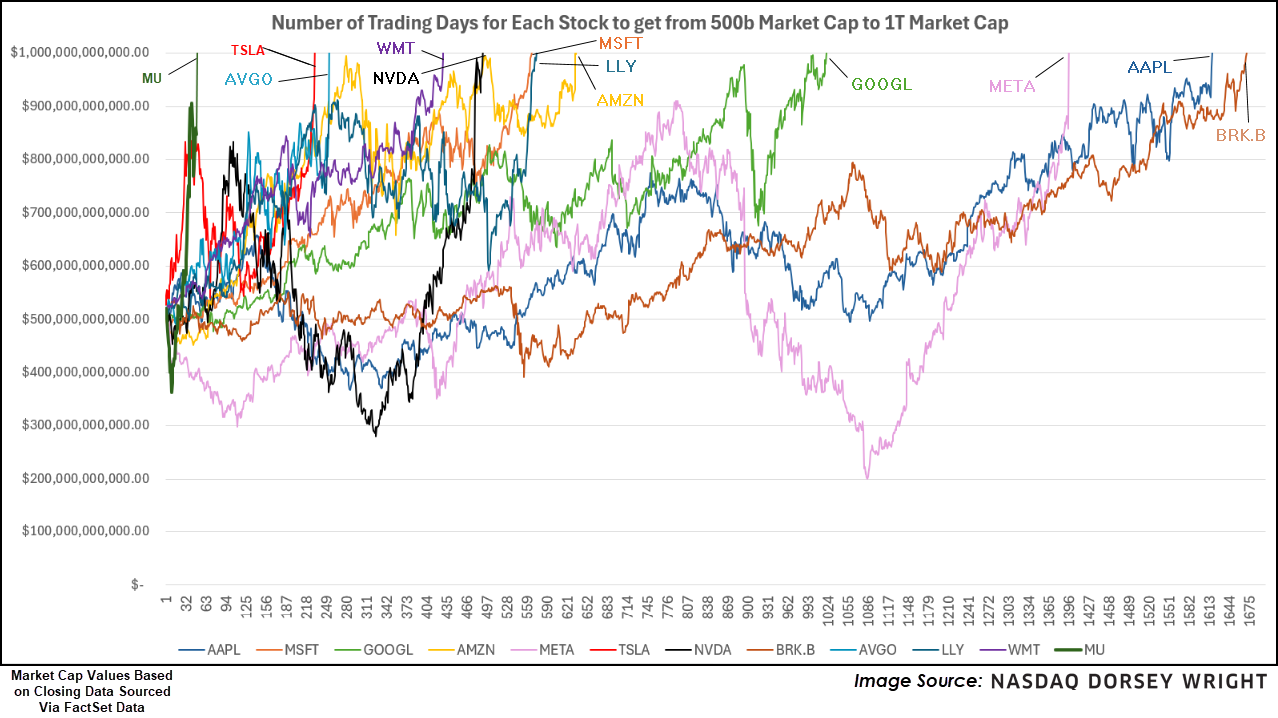
Of course, just because it “feels” as such, doesn’t mean that a pullback is required by any means. Markets can stay irrational for much longer than you can typically stay solvent betting on a turnaround in strength. In fact, most of momentum’s winners have similar return profiles, just not to the magnitude of absolute value created from a market cap perspective. All that to say, continue to watch the charts for signs of slowdown. Price will clue us in as to when things have gotten too extreme and will guide our hand with current allocation… after all, at this rate a $2T valuation is only 48 trading days away.
