International Equities moved into first place on the DALI page for the first time since mid-2025, beating out domestic equities via tiebreaker. Today we look at other instances of when internationals led and try to answer the question... what does this mean for your portfolio?
One of the most well-known pages on the NDW platform is the Dynamic Asset Level Investing (DALI) tool. Using relative strength matrices as a guide, the DALI tool brings visual simplicity to a rather complex question: What parts of the global marketplace earn long-term relative strength? For that reason, the DALI tool and subsequent changes in overall rankings are closely watched by the analyst team as they bring potential for important shifts in leadership worth acting on. For those of you already familiar with the DALI framework and how overall rankings are calculated, feel free to skip ahead. At its core, the DALI tool utilizes a tally matrix scoring system, a proprietary NDW matrix filled with representatives from each broad asset group (or sub asset class). From there, the mathematics are rather simple: tally (add up) the total number of signals each group earns against the rest of the pack. By nature, stronger groups will earn more buy signals, pushing them higher in the rankings as groups you want to pay attention to. Ties in buy signal count (like the one witnessed today) are broken by whichever group earns more near-term strength as evidenced by the total number of X’s counted. While we run this calculation daily, overall rankings are designed to capture long-term trends. There is, of course, no silver bullet to pinpointing strength, but focusing on the top asset class (and avoiding the bottom) has been additive over time.

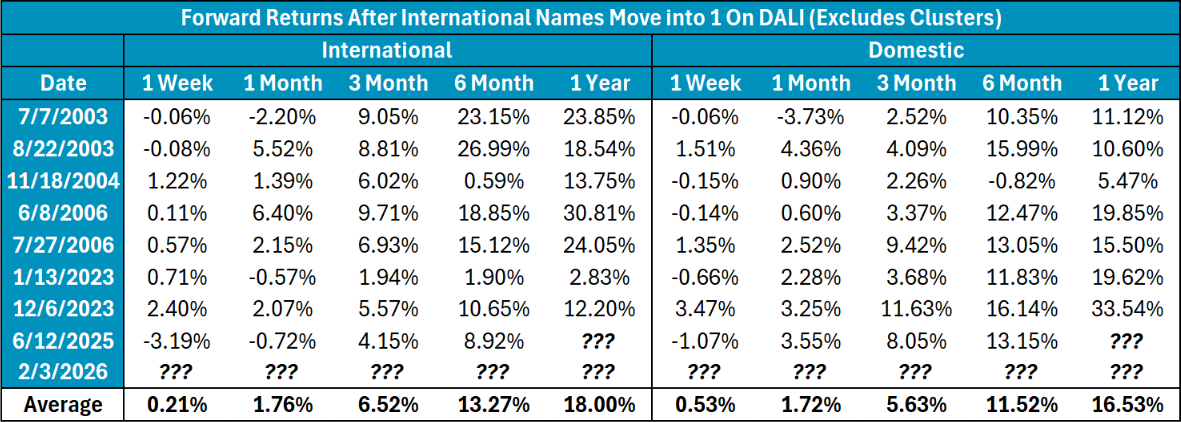
With our DALI update on 2/4, international equities overtook domestic equities for the first overall position in the broad ranks. This marks the highest point for the asset class since a brief stint last June, during which the top three groups of domestic equities, commodities and international equities all earned the top position for some period of time before domestic equities ultimately reclaimed the top position. It is worth noting that the recent shift comes as a result of a tie in buy signal count… so we could see some continued jockeying for position in the near-term as overall strength for the top groups remains close knit. The table below details other instances of international equity dominance, excluding clusters over a 30-day period. You’ll note somewhat consistent leadership throughout the lost decade while domestic markets were struggling with the GFC- but otherwise broader leadership shifts have been largely unproductive. While it remains to be seen if this period of international outperformance is truly more than a one-year fling, the emergence of the space is certainly notable… particularly in historical context which has only seen the group lead a handful of times. In terms of average performance, both domestic and international representatives (ACWX & SPY have shown strong performance following the day of internationals moving into the first position…. But the elephant in the room is that international leadership preceded large domestic drawdowns throughout the 2000’s.
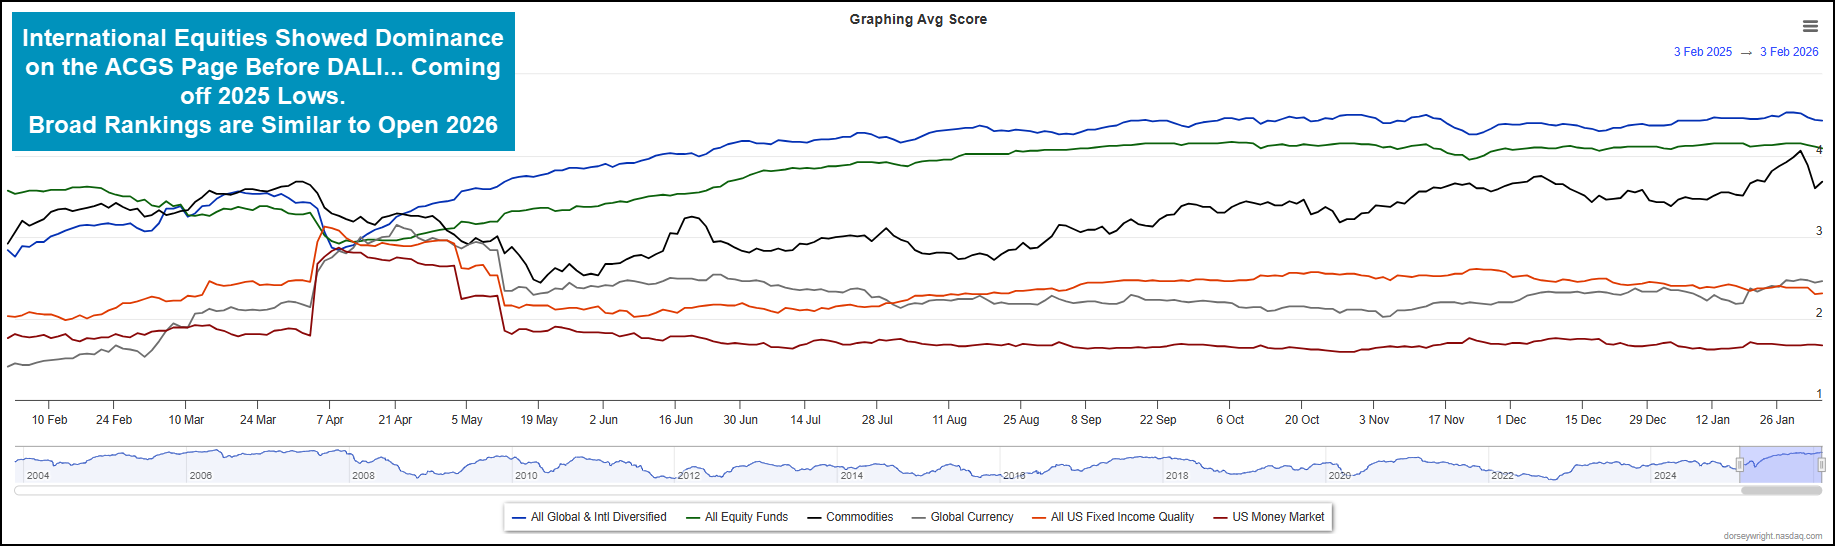
DALI is just one way to observe strength across asset classes. Some of you may prefer to utilize the Asset Class Group Scores (ACGS) page to pinpoint emerging strength/weakness. The ACGS page is typically a bit quicker moving than DALI, a fact that can be helpful in some market environments and damaging in others. Regardless, the ACGS rankings of the six broad groups are featured below. You’ll note that international equities have maintained the first position in the overall rankings since coming off the April 2025 lows, followed closely by domestic equities and then commodities.
Zooming out of pure international equity vs. domestic equity conversation, an analysis of either ranking system confirms further dominance of the top three groups (international & domestic equities and commodities) over the bottom three groups (fixed income, cash and currencies) quite handedly. The difference between commodities in 3rd and cash in fourth sits at 110 signals, suggesting that these risk-on areas of the market maintain their long-term leadership. This could always shift as the recent market exhale continues, but until that point the technicals point to an otherwise constructive environment for broader equities. As always, you can set alerts to be notified of changes on either the ACGS or DALI pages over time.