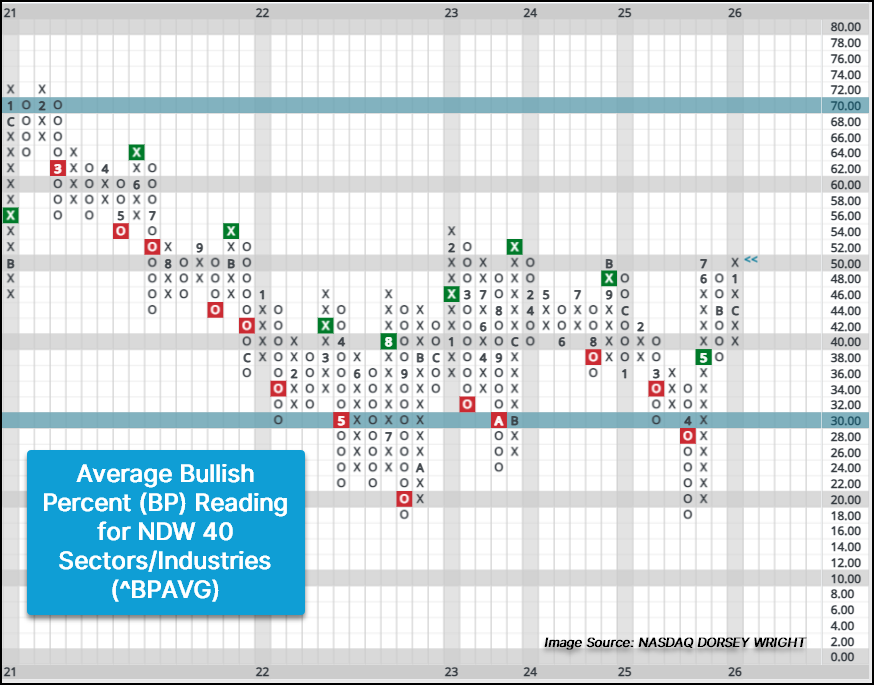
The average bullish percent reading for the NDW 40 sectors/industry groups has reached an intrguing inflection point.
Through the end of last week, U.S. Equities were off to a furious and fast start to 2026, leading to an uptick in participation when examining the bullish percent indicators on the platform. While Tuesday’s (1/20) action may have an impact on recent increases in participation, we have already seen many of those indicators reach notable inflection points. One of the best ways to visualize participation and movement within technical indicators is through the Distribution Curves located under the Allocation Tab.
Utilizing the normal distribution curve from statistics that many are familiar with, NDW users can monitor indicator movements over time and identify areas of high or improving participation as well as areas of low or deteriorating participation. While there are distribution curves for a few different universes as well as a variety of indicators ranging from short to long-term, today’s piece will focus on recent action within the NDW 40 sectors’ bullish percents (BPs), which measure the percentage of stocks that maintain a buy signal on their default point and figure chart.
As of Friday’s (1/16) close, 30 of the NDW 40 sectors BPs maintain a column of Xs, indicating sectors that have seen increases in stocks maintaining buy signals. While the distribution curve can and has been skewed, the current market environment presents a fairly normal distribution with leadership coming from sectors/industries like Banks and Aerospace, along with the broader Industrials and Materials sectors. While users can identify leaders and laggards from the current lay of the land, so to speak, graphing the average BP reading from the NDW 40 sectors on a point and figure chart reveals an intriguing point.

After moving above 50% on the point and figure chart toward the end of last week, the average reading has reached its high mark from recent years, with the last visits coming in July 2025 and November 2024. It is worth noting that the average reading for the NDW 40 BPs hasn’t moved into the lower to mid-50% range since 2023 and hasn’t been above 60% since 2021. While this highlights that concentrated, cap-weighted tilt that market has maintained, it is also the longest streak between trips above 60% for the ^BPAVG indicator. Based on calendar days, the current streak is more than 600 days longer than the second longest streak between trips above 60% that persisted for more than 1000 calendar days from May 1998 to May 2001.
This chart is not only helpful in explaining the concentrated nature of the equity market to clients, but more importantly, a breakout above recent years’ high mark around 50% would be an actionable point for investors to understand that the market’s dynamics are changing. NDW users can utilize the alerts systems for not only reversals on the chart but moves above or below certain thresholds by clicking on the Clock Icon in the upper left-hand corners next to the chart’s main header.