Most Requested Symbols

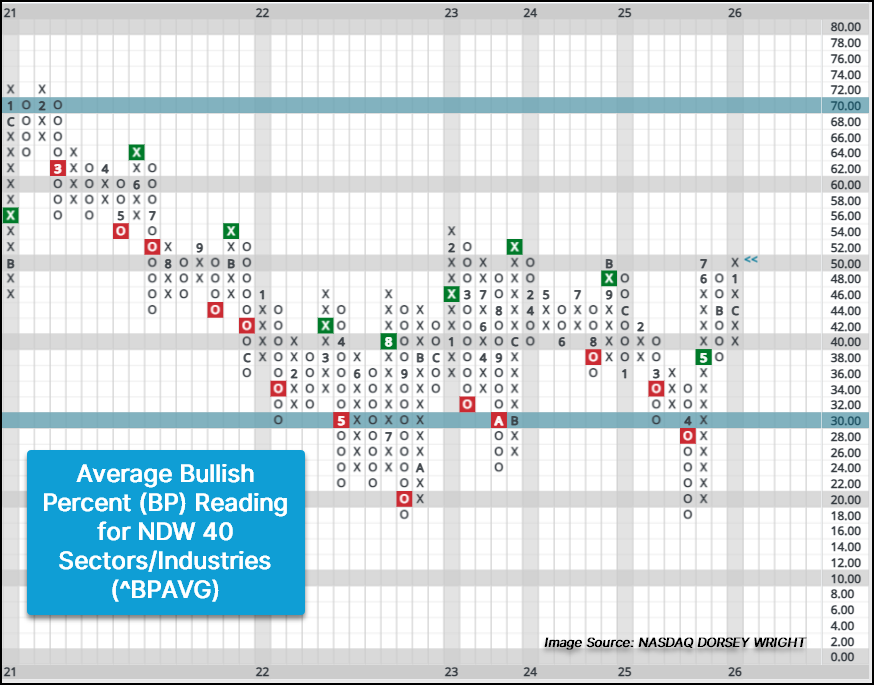
The average bullish percent reading for the NDW 40 sectors/industry groups has reached an intrguing inflection point.
Momentum has beaten SPX through the first half of January each of the last three years.
Weekly Rundown Video – Jan 14, 2026
Weekly rundown with NDW analyst team covering all major asset classes.
Weekly rundown with NDW analyst team covering all major asset classes.
Through the end of last week, U.S. Equities were off to a furious and fast start to 2026, leading to an uptick in participation when examining the bullish percent indicators on the platform. While Tuesday’s (1/20) action may have an impact on recent increases in participation, we have already seen many of those indicators reach notable inflection points. One of the best ways to visualize participation and movement within technical indicators is through the Distribution Curves located under the Allocation Tab.
Utilizing the normal distribution curve from statistics that many are familiar with, NDW users can monitor indicator movements over time and identify areas of high or improving participation as well as areas of low or deteriorating participation. While there are distribution curves for a few different universes as well as a variety of indicators ranging from short to long-term, today’s piece will focus on recent action within the NDW 40 sectors’ bullish percents (BPs), which measure the percentage of stocks that maintain a buy signal on their default point and figure chart.
As of Friday’s (1/16) close, 30 of the NDW 40 sectors BPs maintain a column of Xs, indicating sectors that have seen increases in stocks maintaining buy signals. While the distribution curve can and has been skewed, the current market environment presents a fairly normal distribution with leadership coming from sectors/industries like Banks and Aerospace, along with the broader Industrials and Materials sectors. While users can identify leaders and laggards from the current lay of the land, so to speak, graphing the average BP reading from the NDW 40 sectors on a point and figure chart reveals an intriguing point.

After moving above 50% on the point and figure chart toward the end of last week, the average reading has reached its high mark from recent years, with the last visits coming in July 2025 and November 2024. It is worth noting that the average reading for the NDW 40 BPs hasn’t moved into the lower to mid-50% range since 2023 and hasn’t been above 60% since 2021. While this highlights that concentrated, cap-weighted tilt that market has maintained, it is also the longest streak between trips above 60% for the ^BPAVG indicator. Based on calendar days, the current streak is more than 600 days longer than the second longest streak between trips above 60% that persisted for more than 1000 calendar days from May 1998 to May 2001.
This chart is not only helpful in explaining the concentrated nature of the equity market to clients, but more importantly, a breakout above recent years’ high mark around 50% would be an actionable point for investors to understand that the market’s dynamics are changing. NDW users can utilize the alerts systems for not only reversals on the chart but moves above or below certain thresholds by clicking on the Clock Icon in the upper left-hand corners next to the chart’s main header.

Momentum strategies have been off to a great start through the first half of January. The iShares MSCI USA Momentum Factor ETF (MTUM) has outpaced the S&P 500 Index (SPX) by 1.84% through January 16th. In fact, this is the third year in a row that MTUM has outperformed SPX in the first half of January. While the first half of January is a relatively short time frame, it does seem to indicate whether MTUM or SPX will win out the rest of the year. Going back to 1993, the winner of the first half of January went on to outperform on an annual basis nearly 75% of the time. Therefore, a strong start by momentum is usually a positive sign that the rest of the year will be a good one on a relative basis. Over the last decade, the winner of the first two weeks of January went on to have the better year eight out of ten times and has been correct the last four years (2022 – 2025). MTUM has beaten SPX in the first half of January the last three years (2024 – 2026). While basing investment decisions purely on the first two weeks of January would be ill-advised, the historical tendencies point to backing the strong horse even if it is just out of the gate.

Looking elsewhere, momentum stiffened back up after cooling off at the end of 2025. The RS Spread Index (RSSPREAD) tested its positive trend line in December but has since reversed higher and is one box away from marking a new all-time high. For those unfamiliar, RSSPREAD tracks the dispersion between a basket of high momentum stocks versus a basket of low momentum stocks. If the indicator is moving higher, then high momentum stocks are outperforming low momentum stocks, an ideal environment for any momentum or trend following strategy. RSSPREAD has been in a positive trend since early 2024, and despite some rough patches, continued to push higher in 2025.
There is plenty of other positive evidence as well like MTUM having a fund score above 4.0 since January 2024 or the Percent Positive Trend for the S&P 500 (^PTSPX) being above 50%. Until we start to see the evidence change, the domestic equity market is in a supportive environment, especially for momentum and relative strength strategies. With the strong start to the year, it’s usually a good idea to stick with the best horse until proven otherwise.

Average Level
30.88
| < - -100 | -100 - -80 | -80 - -60 | -60 - -40 | -40 - -20 | -20 - 0 | 0 - 20 | 20 - 40 | 40 - 60 | 60 - 80 | 80 - 100 | 100 - > |
|---|---|---|---|---|---|---|---|---|---|---|---|
|
Buy signaldvy
|
|||||||||||
|
Buy signalVOOG
|
Buy signalijr
|
||||||||||
|
Buy signalshy
|
Buy signalQQQ
|
Buy signalhyg
|
Buy signalrsp
|
||||||||
|
Buy signalagg
|
Buy signalONEQ
|
Buy signaldia
|
Buy signalefa
|
Buy signalEEM
|
|||||||
|
Buy signalfxe
|
Buy signalXLG
|
Buy signaluso
|
Buy signalSPY
|
Buy signalVOOV
|
Buy signaliwm
|
Buy signalgcc
|
|||||
|
Sell signalief
|
Buy signaltlt
|
Sell signallqd
|
Sell signaldx/y
|
Buy signalgsg
|
Sell signalicf
|
Buy signalIJH
|
Buy signalGLD
|
||||
| < - -100 | -100 - -80 | -80 - -60 | -60 - -40 | -40 - -20 | -20 - 0 | 0 - 20 | 20 - 40 | 40 - 60 | 60 - 80 | 80 - 100 | 100 - > |
| AGG | iShares US Core Bond ETF |
| USO | United States Oil Fund |
| DIA | SPDR Dow Jones Industrial Average ETF |
| DVY | iShares Dow Jones Select Dividend Index ETF |
| DX/Y | NYCE U.S.Dollar Index Spot |
| EFA | iShares MSCI EAFE ETF |
| FXE | Invesco CurrencyShares Euro Trust |
| GLD | SPDR Gold Trust |
| GSG | iShares S&P GSCI Commodity-Indexed Trust |
| HYG | iShares iBoxx $ High Yield Corporate Bond ETF |
| ICF | iShares Cohen & Steers Realty ETF |
| IEF | iShares Barclays 7-10 Yr. Tres. Bond ETF |
| LQD | iShares iBoxx $ Investment Grade Corp. Bond ETF |
| IJH | iShares S&P 400 MidCap Index Fund |
| ONEQ | Fidelity Nasdaq Composite Index Track |
| QQQ | Invesco QQQ Trust |
| RSP | Invesco S&P 500 Equal Weight ETF |
| IWM | iShares Russell 2000 Index ETF |
| SHY | iShares Barclays 1-3 Year Tres. Bond ETF |
| IJR | iShares S&P 600 SmallCap Index Fund |
| SPY | SPDR S&P 500 Index ETF Trust |
| TLT | iShares Barclays 20+ Year Treasury Bond ETF |
| GCC | WisdomTree Continuous Commodity Index Fund |
| VOOG | Vanguard S&P 500 Growth ETF |
| VOOV | Vanguard S&P 500 Value ETF |
| EEM | iShares MSCI Emerging Markets ETF |
| XLG | Invesco S&P 500 Top 50 ETF |

| Symbol | Company | Sector | Current Price | Action Price | Target | Stop | Notes |
|---|---|---|---|---|---|---|---|
| CME | CME Group, Inc. | Wall Street | $279.50 | 260s - 270s | 312 | 224 | 4 for 5'er, middle of WALL sector matrix, triple top breakout, 1.8% yield, Earn. 2/4 |
| AFL | AFLAC Incorporated | Insurance | $109.51 | 108 - 115 | 143 | 95 | 4 for 5'er, top half of INSU sector matrix, LT pos peer & mkt RS, spread triple top, 2% yield, Earn. 2/4 |
| LAMR | Lamar Advertising Company | Media | $132.26 | 120s - low 130s | 158 | 110 | 4 for 5'er, top half of MEDI sector matrix, LT pos peer & mkt RS, spread triple top 4.8% yield |
| HLT | Hilton Worldwide Holdings Inc | Leisure | $300.85 | hi 260s - low 280s | 328 | 240 | 5 for 5'er, top half of LEIS sector matrix LT pos peer & mkt RS, quintuple top, Earn. 2/11 |
| THC | Tenet Healthcare Corporation | Healthcare | $196.74 | 190 - mid 200s | 286 | 170 | 5 TA rating, top 50% of HEAL sector matrix, LT RS buy, buy-on-pullback, Earn. 2/11 |
| FLS | Flowserve Corporation | Machinery and Tools | $77.17 | hi 60s - lo 70s | 91 | 54 | 5 TA rating, top 10% of MACH sector matrix, LT RS buy, buy-on-pullback |
| BCO | The Brink's Company | Protection Safety Equipment | $125.72 | mid 110s - low 120s | 152 | 104 | 5 for 5'er, top half of PROT sector matrix, LT pos peer & mkt RS, spread triple top, R-R>2.0 |
| RL | Ralph Lauren | Textiles/Apparel | $363.05 | 352 - 380s | 472 | 296 | 5 TA rating, LT RS buy, consec buy signals, buy-on-pullback, Earn. 2/5 |
| CBRE | CBRE Group, Inc. | Real Estate | $171.59 | hi 150s - lo 170s | 188 | 134 | 5 TA rating, top 10% of REAL sector matrix, LT RS buy, consec buy signals, Earn. 2/12 |
| RJF | Raymond James Financial Inc | Wall Street | $171.78 | 160s | 186 | 142 | 5 for 5'er, top half of WALL sector matrix, LT pos mkt & peer RS, triple top, pos trend flip, Earn. 1/28 |
| IMAX | Imax Corporation | Media | $37.43 | 33 - hi 30s | 53 | 26 | 5 TA rating, top 20% of Media sector matrix, LT pos trend, consec buy signals, buy-on-pullback |
| GIL | Gildan Activewear | Textiles/Apparel | $63.22 | 62 - 66 | 86 | 52 | 5 for 5'er, top third of favored TEXT sector matrix, LT pos peer & mkt RS, spread triple top, buy on pullback, R-R>2.0 |
| FIX | Comfort Systems U.S.A. | Building | $1119.98 | 960 - mid 1100s | 1376 | 864 | 5 TA rating, top 10% of BUIL sector matrix, LT mkt RS buy, consec buy signals |
| WFC | Wells Fargo & Company | Banks | $88.38 | mid 80s - low 90s | 128 | 76 | 5 for 5'er, top 25% of BANK sector matrix, LT pos peer & mkt RS, buy on pullback, R-R~3.0 |
| JPM | J.P. Morgan Chase & Co. | Banks | $312.47 | lo 300s - mid 320s | 380 | 256 | 5 TA rating, top 25% of favored BANK sector matrix, LT RS buy, LT pos trend, buy-on-pullback |
| AER | AerCap Holdings NV | Aerospace Airline | $142.81 | mid 130 - mid 140 | 167 | 118 | 5/5'er since 4/25, LT pos. mkt and peer RS since '22, buy on pullback, Earn. 2/6 |
| SPHR | Sphere Entertainment Co. | Leisure | $96.36 | 94-lo 100s | 114 | 80 | 5 TA rating, top 10% of LEIS sector matrix, LT pos trend, consec, buy signals, buy-on-pullback |
| Symbol | Company | Sector | Current Price | Action Price | Target | Stop | Notes |
|---|
SPHR Sphere Entertainment Co. ($95.62) R - Leisure - SPHR has a 5 for 5 TA rating and sits in the top quintile of the leisure sector RS matrix. The stock has maintained a positive trend since June and been on an RS buy signal against the market since September. The recent chart action saw SPHR notch a new all-time high at $100 before retracting back to the current position. The weight of the technical evidence is favorable, allowing this to serve as a buy-on-pullback opportunity. Exposure can be considered from $94 to the low $100s. Our initial stop will be positioned at $80, which would violate multiple support levels. The bullish price objective of $114 will serve as our price target.
| 26 | |||||||||||||||||||||||||||||
| 100.00 | X | 100.00 | |||||||||||||||||||||||||||
| 99.00 | X | O | 99.00 | ||||||||||||||||||||||||||
| 98.00 | X | O | 98.00 | ||||||||||||||||||||||||||
| 97.00 | X | X | X | O | 97.00 | ||||||||||||||||||||||||
| 96.00 | X | X | O | X | O | X | O | 96.00 | |||||||||||||||||||||
| 95.00 | X | O | X | O | X | X | O | X | 95.00 | ||||||||||||||||||||
| 94.00 | X | O | X | 1 | X | O | X | O | 94.00 | ||||||||||||||||||||
| 93.00 | X | X | O | O | X | O | X | 93.00 | |||||||||||||||||||||
| 92.00 | X | O | X | O | X | O | X | 92.00 | |||||||||||||||||||||
| 91.00 | X | O | X | O | O | X | 91.00 | ||||||||||||||||||||||
| 90.00 | X | O | X | O | X | 90.00 | |||||||||||||||||||||||
| 89.00 | X | O | X | O | 89.00 | ||||||||||||||||||||||||
| 88.00 | X | O | X | Mid | 88.00 | ||||||||||||||||||||||||
| 87.00 | X | O | X | 87.00 | |||||||||||||||||||||||||
| 86.00 | X | O | 86.00 | ||||||||||||||||||||||||||
| 85.00 | X | 85.00 | |||||||||||||||||||||||||||
| 84.00 | X | X | 84.00 | ||||||||||||||||||||||||||
| 83.00 | X | O | X | 83.00 | |||||||||||||||||||||||||
| 82.00 | X | O | X | 82.00 | |||||||||||||||||||||||||
| 81.00 | X | X | X | C | 81.00 | ||||||||||||||||||||||||
| 80.00 | X | O | X | O | X | 80.00 | |||||||||||||||||||||||
| 79.00 | X | O | X | O | X | 79.00 | |||||||||||||||||||||||
| 78.00 | X | O | X | O | X | 78.00 | |||||||||||||||||||||||
| 77.00 | X | O | X | O | X | 77.00 | |||||||||||||||||||||||
| 76.00 | X | O | X | O | X | 76.00 | |||||||||||||||||||||||
| 75.00 | X | O | X | O | X | 75.00 | |||||||||||||||||||||||
| 74.00 | X | O | O | 74.00 | |||||||||||||||||||||||||
| 73.00 | X | 73.00 | |||||||||||||||||||||||||||
| 72.00 | X | 72.00 | |||||||||||||||||||||||||||
| 71.00 | X | 71.00 | |||||||||||||||||||||||||||
| 70.00 | X | 70.00 | |||||||||||||||||||||||||||
| 69.00 | X | X | Bot | 69.00 | |||||||||||||||||||||||||
| 68.00 | X | X | X | O | X | 68.00 | |||||||||||||||||||||||
| 67.00 | X | O | X | O | X | O | X | 67.00 | |||||||||||||||||||||
| 66.00 | X | O | X | O | X | B | X | 66.00 | |||||||||||||||||||||
| 65.00 | X | O | X | O | X | O | X | 65.00 | |||||||||||||||||||||
| 64.00 | A | O | X | O | X | O | 64.00 | ||||||||||||||||||||||
| 63.00 | X | O | X | X | O | 63.00 | |||||||||||||||||||||||
| 62.00 | X | O | X | O | X | 62.00 | |||||||||||||||||||||||
| 61.00 | X | O | X | O | X | 61.00 | |||||||||||||||||||||||
| 60.00 | X | O | X | O | X | 60.00 | |||||||||||||||||||||||
| 59.00 | X | O | X | O | • | 59.00 | |||||||||||||||||||||||
| 58.00 | X | O | • | 58.00 | |||||||||||||||||||||||||
| 26 |
| EXPE Expedia Group Inc. ($272.21) - Leisure - EXPE broke a double bottom at $280 to end a series of buy signals that began back in November last year as shares fell to $276. The stock continues to maintain a 5 technical attribute rating and rank within the top decile of the Leisure sector matrix. From here, support on the default point and figure trend chart lies at $236, while support closer to current prices can be found on the more sensitive 2 point per box chart at $258 |
| GEHC GE Healthcare Technologies Inc. ($78.39) - Healthcare - GEHC inched lower and completed a double bottom break at $81. The 2 for 5'er is down almost 5% year-to-date. A sell can be considered here. given the weight of the evidence. Initial resistance can be seen at $89. Strong support can be seen between $70-$71. |
| GM General Motors ($77.59) - Autos and Parts - GM broke a double bottom at $79 to end a series of seven buy signals that began back in April 2025 as shares fell to $78. The stock continues to maintain a 5 technical attribute rating and rank within the top decile of the Autos and Parts sector matrix. From here, support on the default point and figure trend chart lies in the $67 to $68 range, while support closer to current prices can be found on the more sensitive 0.50 point per box chart at $75.50. |
| LEU Centrust Energy Corp. ($318.91) - Metals Non Ferrous - LEU returned to a buy signal Tuesday with a triple top break at $336 but finished the fay down more than 3%. The return to a buy signal adds to a modestly positive technical picture as LEU is a 3 for 5'er. From here, the first level of support sits at $288. |
| ORCL Oracle Corporation ($180.53) - Software - ORCL moved lower Tuesday to break a double bottom at $186 before falling to $182 intraday. This 2 for 5'er moved to a negative trend in December and sits near the bottom of the software sector RS matrix. The weight of the technical evidence is weak and deteriorating. Avoid long exposure. Further support can be seen at $178. Overhead resistance may be seen at $204. |
| SHOP Shopify Inc ($144.59) - Retailing - SHOP broke a double bottom at $152 for a second sell signal as shares fell to $146, violating the bullish support line in the process. This will drop the stock down to a 3 for 5'er trading in a negative trend, and the stock has already fallen into the bottom half of the Retailing sector matrix. From here, support for the stock now lies at $144, while additional can be found at $138 and $134. |
| TSN Tyson Foods, Inc. ($61.20) - Food Beverages/Soap - Shares of TSN broke a double top at $61 for its second consecutive buy signal. The stock also returned to a positive trend in December but remains a 2 for 5'er for now given its broader lack of relative strength. especially versus the market. Overall, the stocks remains one to avoid, but could be worth keeping an eye on should the stock continue its improvement. From here, resistance lies at $62 and then $64 to $66. |

| Name | Option Symbol | Action | Stop Loss |
|---|---|---|---|
| Walmart Inc. - $118.44 | O: 26D115.00D17 | Buy the April 115.00 calls at 8.85 | 108.00 |
| Name | Option | Action |
|---|---|---|
| Philip Morris International Inc. ( PM) | Mar. 160.00 Calls | Stopped at 14.90 (CP: 12.50) |
| Monster Beverage Corp. ( MNST) | Mar. 77.50 Calls | Initiate an option stop loss of 4.40 (CP: 6.40) |
| Emerson Electric Co. ( EMR) | Mar. 145.00 Calls | Stopped at 6.60 (CP: 6.10) |
| Name | Option Symbol | Action | Stop Loss |
|---|---|---|---|
| The Kroger Co. - $63.09 | O: 26P62.50D17 | Buy the April 62.50 puts at 3.00 | 68.00 |
| Name | Option | Action |
|---|---|---|
| GoDaddy Inc. ( GDDY) | Feb. 130.00 Puts | Raise the option stop loss to 22.90 (CP: 24.90) |
| The Kroger Co. ( KR) | Mar. 62.50 Puts | Stopped at 2.40 (CP: 2.39) |
| Paypal Holdings Inc ( PYPL) | Mar. 60.00 Puts | Raise the option stop loss to 4.30 (CP: 6.30) |
| Norwegian Cruise Line Holdings Ltd. ( NCLH) | Mar. 24.00 Puts | Initiate an option stop loss of 0.00 (CP: 3.70) |
| Crocs, Inc. ( CROX) | Mar. 87.50 Puts | Raise the option stop loss to 7.60 (CP: 9.60) |
| Name | Option Sym. | Call to Sell | Call Price | Investment for 500 Shares | Annual Called Rtn. | Annual Static Rtn. | Downside Protection |
|---|---|---|---|---|---|---|---|
| Citigroup, Inc. $ 118.04 | O: 26D115.00D17 | Apr. 115.00 | 6.05 | $ 53,933.90 | 23.36% | 18.91% | 4.31% |
| Name | Action |
|---|---|
| Lemonade Inc ( LMND) - 79.41 | Sell the February 80.00 Calls. |
| On Semiconductor Corp. ( ON) - 60.33 | Sell the March 60.00 Calls. |
| Dexcom Inc. ( DXCM) - 69.54 | Sell the February 70.00 Calls. |
| CAVA Group, Inc. ( CAVA) - 72.09 | Sell the February 70.00 Calls. |
| Name | Covered Write |
|---|---|
| Orla Mining Ltd. ( ORLA - 14.73 ) | February 15.00 covered write. |
Daily Equity & Market Analysis
LISTEN TO PODCAST
Feb 26, 2026
Loading, Please Wait...
