Most Requested Symbols

Major equity indices are off to a strong start in 2026; however, international equities continue to be a strong theme.
After having been among the better performing sectors during the first three quarters of 2025, utilities have had their share of fits and starts during Q4 2025 and kicking off 2026.
Weekly Rundown Video – Jan 14, 2026
Weekly rundown with NDW analyst team covering all major asset classes.
Weekly rundown with NDW analyst team covering all major asset classes.
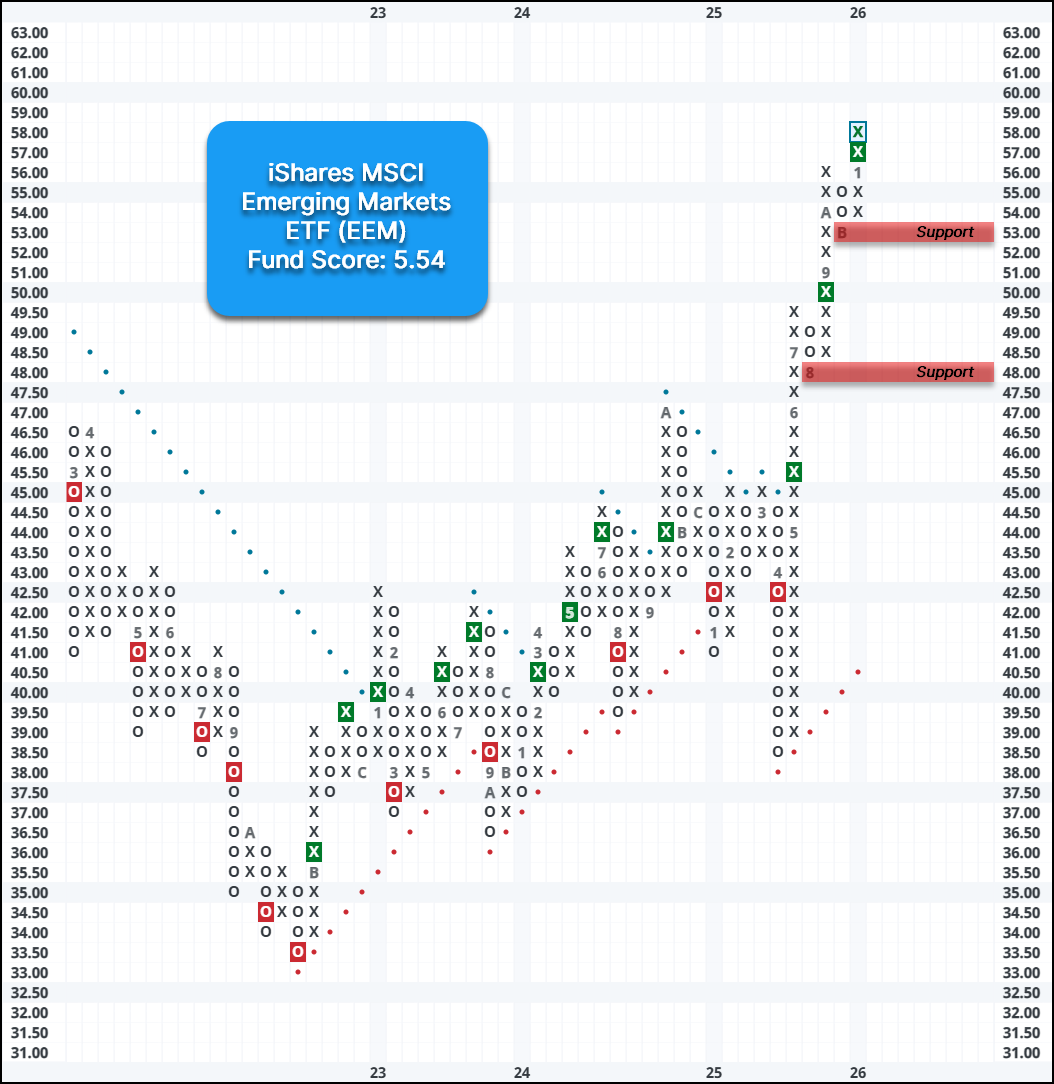
Earlier this week, we discussed in our weekly rundown video the major equity indices and their respective returns so far in 2026. Click here to watch. Major equity indices are off to a strong start in 2026; however, international equities continue to be a strong theme. Year-to-date, the international emerging markets representative EEM is up over 5%. The fund continues to build on its impressive 30% gain in 2025.
A benefit of using multiple tools on the Dorsey wright research site is the fact that you can cross check multiple tools to help build a case for areas of strength/areas of weakness. The Emerging Markets Diversified group on the asset class group scores page ranks 6th among all groups (134 in total), placing it above the 95th percentile of groups on the page. This ranking is higher than the S&P 500 Index Funds group, which currently rank 16th on the asset class group scores page. Additionally, when looking at our DALI asset class rankings, international equities remain firmly in the 2nd position. Although the group still trails domestic equities by 17 signals, international equities have gained 17 signals since the beginning of Q4 last year, highlighting clear improvement in recent months.

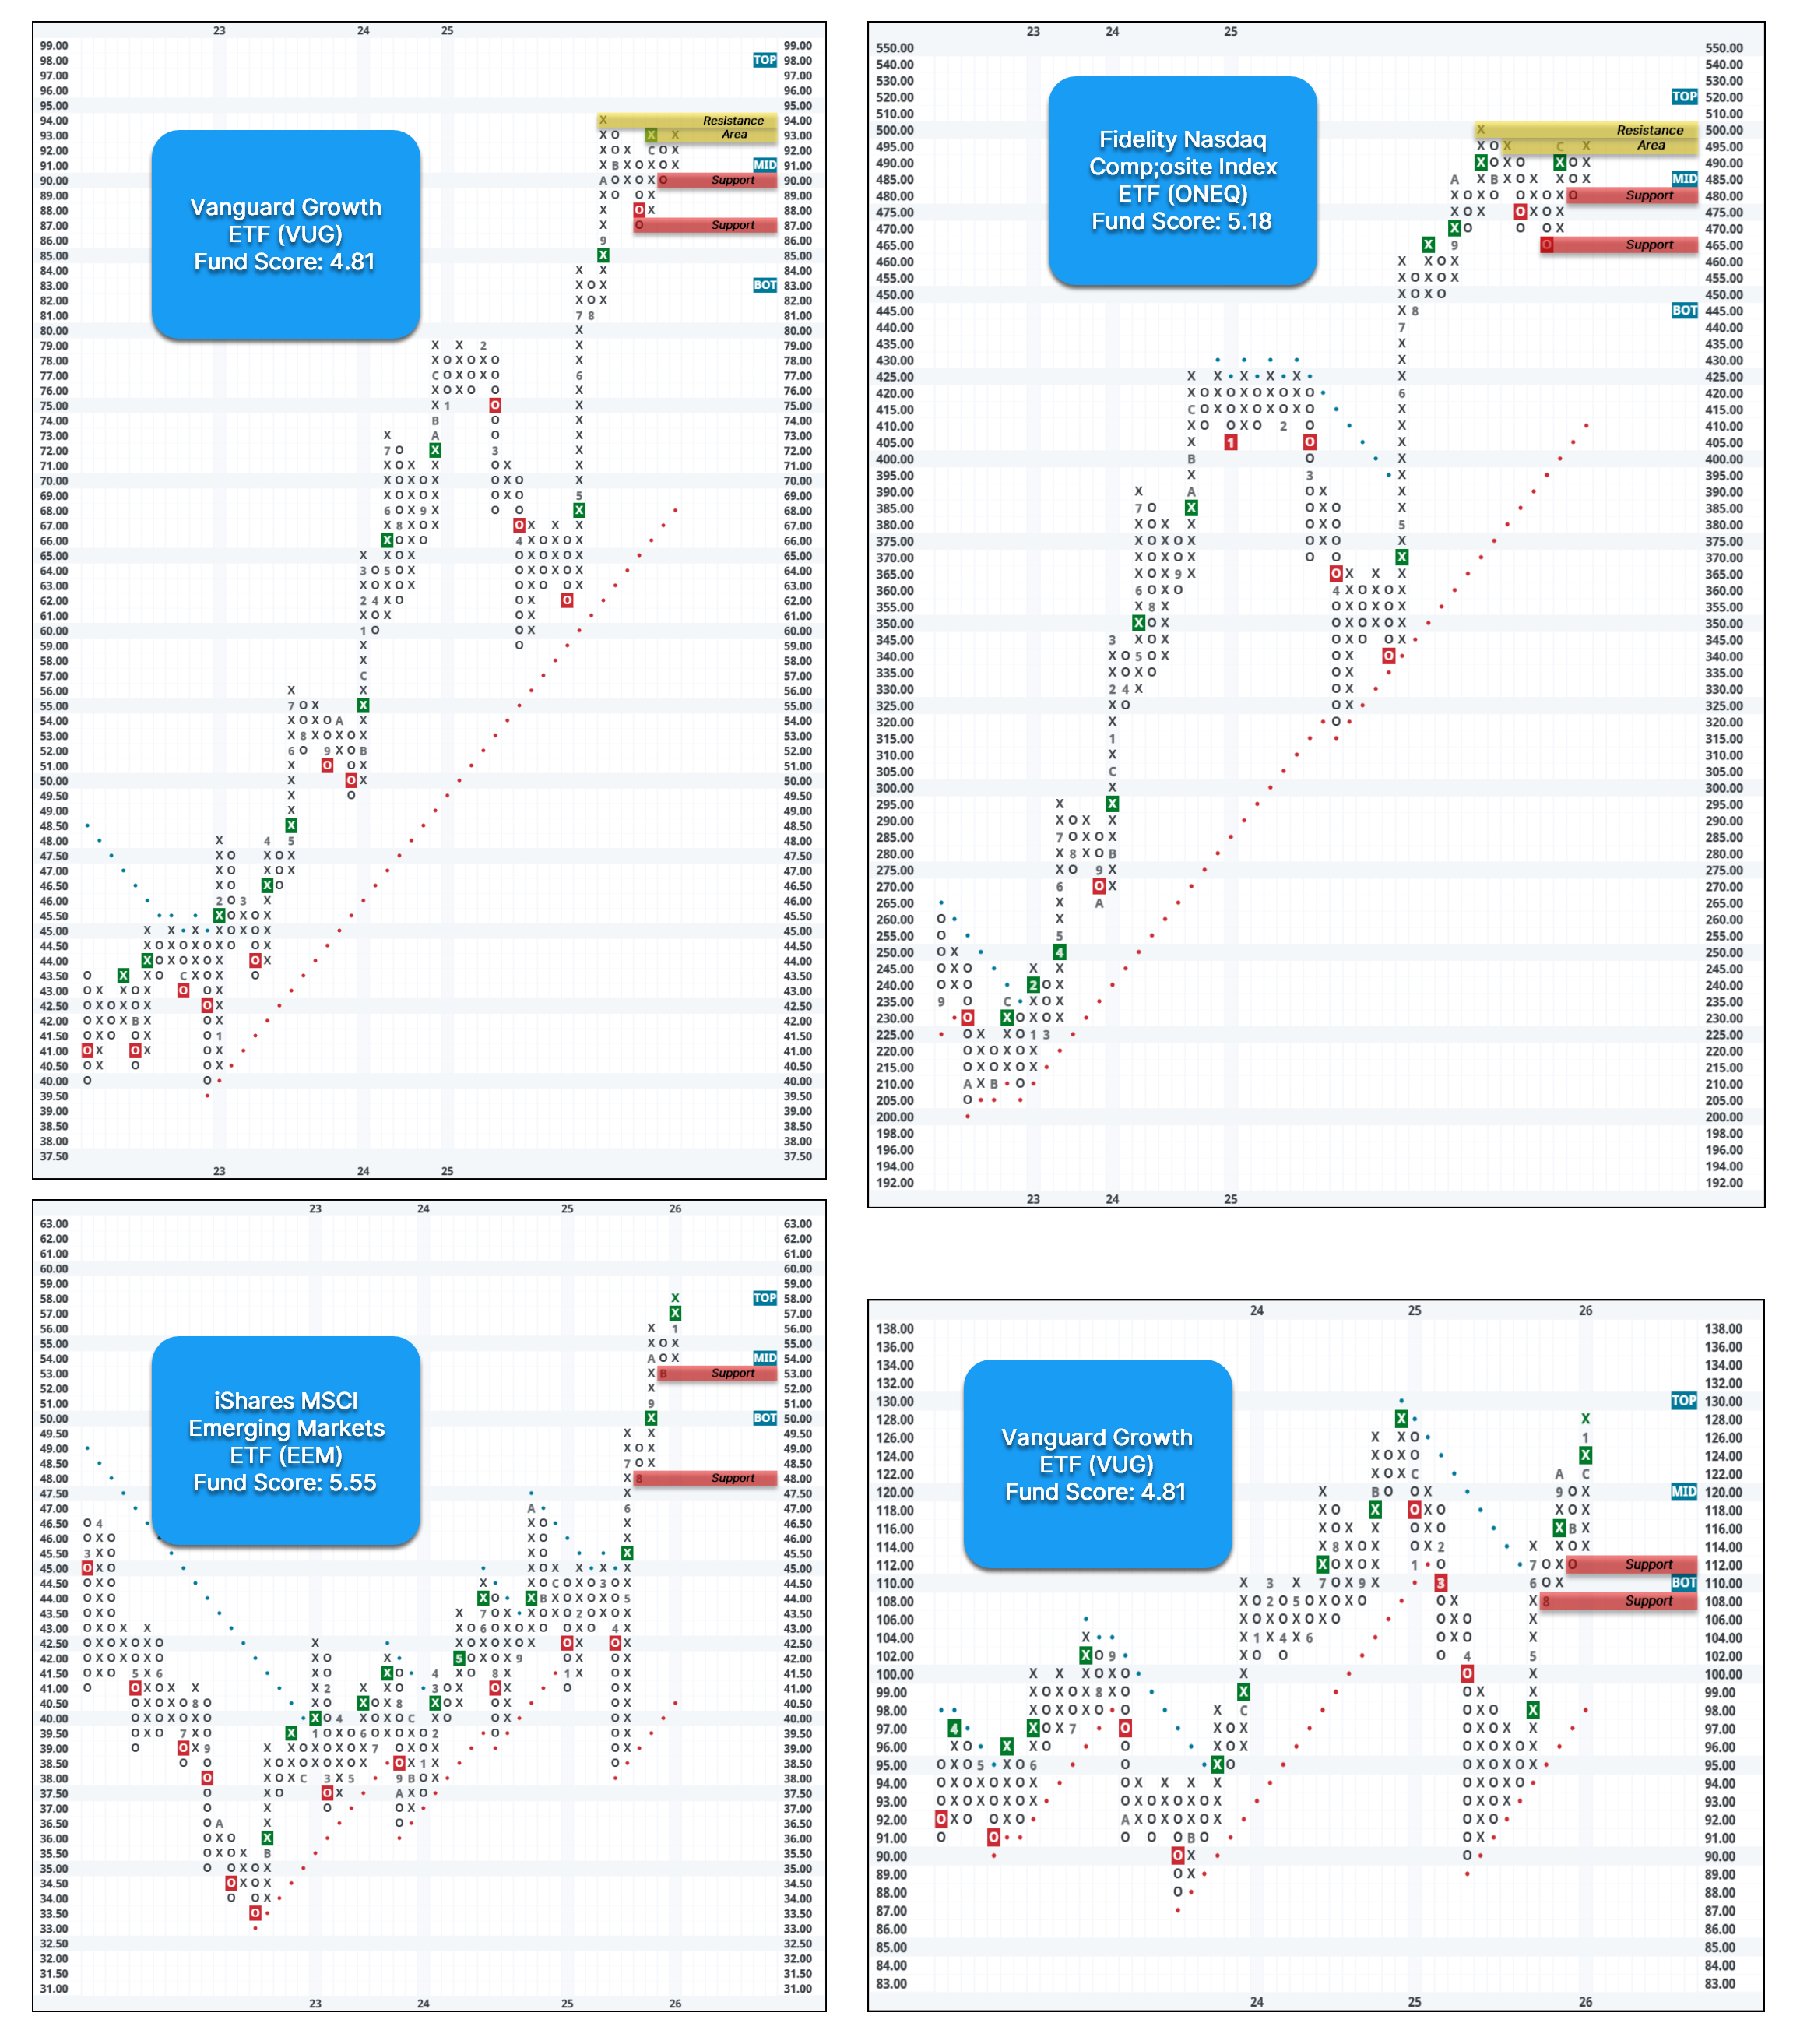
Given the fact that international equities representing such a broad group, gaining exposure in the group through ETFs provide a strong diversification benefit. The iShares MSCI Emerging Markets ETF (EEM) provides exposure to large- and mid-cap stocks in developing countries like Asia, Latin America etc. The fund completed a double top break at $57, marking its third consecutive buy signal. EEM also reached an intraday high above $58 on Thursday (1/15), marking a new all-time high for the first time since early 2021. EEM maintains a strong fund score of 5.55, with a positive score direction of 1.33. Additionally, the fund offers a yield of over 2.2%. The weekly OBOS indicates that the stock is in overbought territory, so wait for the 10-week trading band to normalize before considering. Initial support is at $53, with additional support at $48.

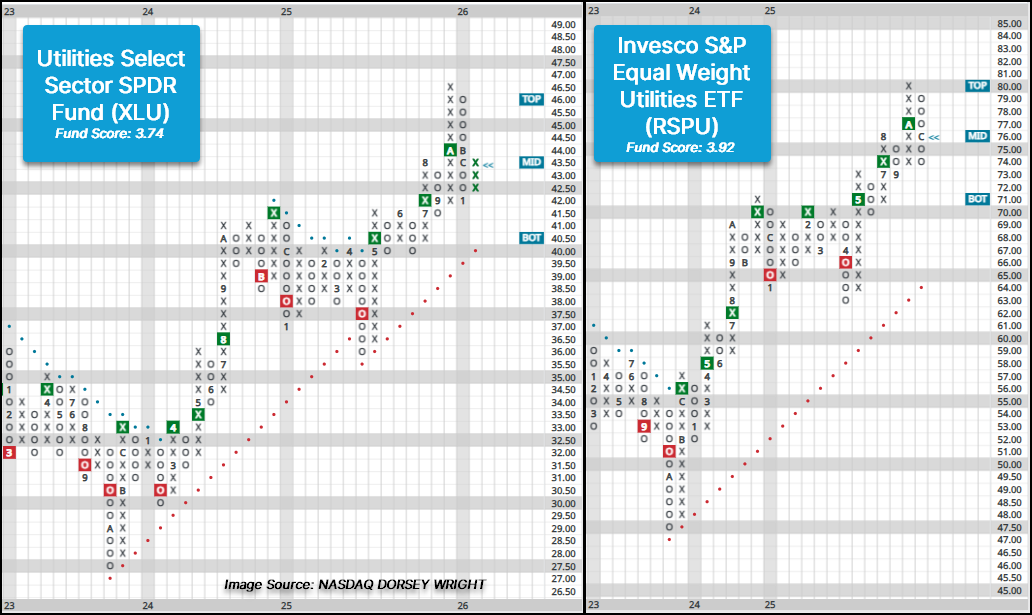
After having been among the better performing sectors during the first three quarters of 2025, utilities have had their share of fits and starts during Q4 2025 and kicking off 2026. In recent years, utilities have been a “pick and axes” play of sorts for the AI theme as utility providers have announced and planned projects around supplying power to data centers. But as with the AI theme, investors are beginning to find out which companies are moving forward with plans as well as those who simply were trying to drum up attention.
After being up 15% and 16% through the first three quarters in 2025, the Utilities Select Sector SPDR Fund (XLU) and Invesco S&P Utilities Equal Weight ETF (RSPU) are basically flat in since 9/30/2025 thanks to a stellar rally on Thursday (1/15). While both funds still maintain a positive trend and buy signals, utilities have lagged other notable sectors like materials and energy, which have led both sector ETF lineups to kick off 2026.
Looking at the market relative strength chart for both ETFs, XLU reversed down in late December, while last week’s action brought RSPU back into Os. Each fund maintains a positive trend and long-term market RS buy signal, which helps sustain acceptable fund scores north of 3. But, as can be seen on the NDW DALI Asset Class Rankings and Asset Class Group Scores page, near-term negative RS has impacted the technical picture for the broader sector.
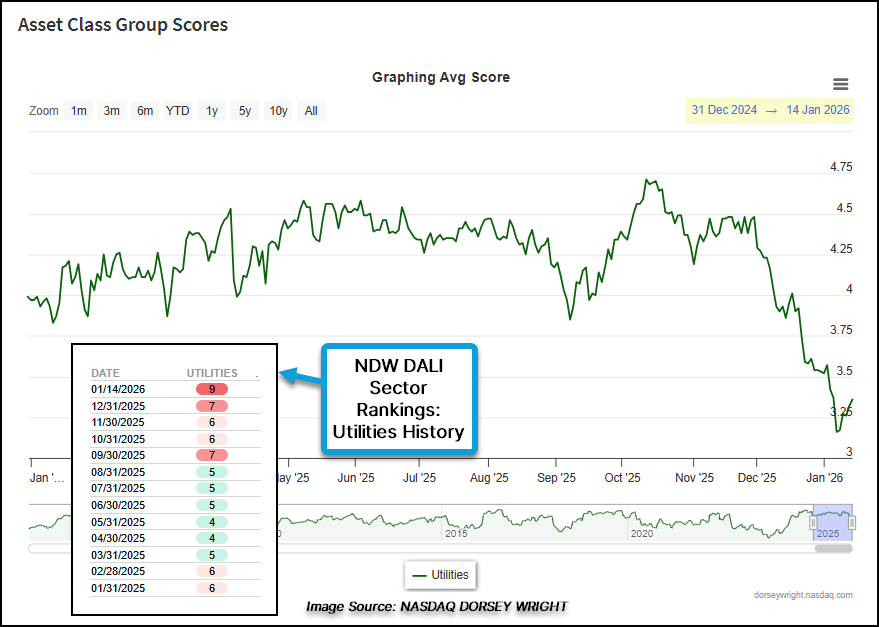
After reaching as high as fourth in the middle of 2025, the sector slowly worked its way down to the rankings during Q4 before ultimately falling down to ninth to kick off 2026, marking the sector’s lowest ranking since July 2024. Meanwhile, on the Asset Class Group Scores page, utilities scored above 4.0 (out of 6) for most of 2025. But the sector has recently fallen to test the acceptable 3.0 group score threshold, a position it has maintained since mid-2024.
While relative weakness versus sector counterparts can be seen on the DALI and Asset Class Group Scores page, intermediate- and long-term participation within the sector has also taken a hit. After the bullish percent for the broader sector (^BPECUTILITY) reached a historically elevated ready of 76% back in October, the chart reversed in early November and has fallen to 60%. In a somewhat similar fashion, the long-term positive trend indicator for the sector (^PTECUTILITY) reached its highest chart level in five years at 68% before reversing down to Os in early December. While both indicators suggest that roughly six out of every 10 stocks within the sector still maintain a buy signal and positive trend, many have lagged relative to their sector counterparts in recent months.

Although there are a number of stock examples that speak to the relative weakness within the broader sector, a prime example is Constellation Energy Corporation (CEG). Prior to last week’s action, CEG had been at least a 3 technical attribute stock since May 2025. Along with a shift into a negative trend on its default point and figure chart on January 6th, CEG's market relative strength chart reversed into a column of Os after having been in Xs since April last year. Further signs of relative weakness for CEG can be seen in the Electric Utilities sector matrix, where the stock has fallen into the bottom quintile, along with its peer relative strength chart residing within one box of reversing into Os. Though CEG did return to a buy signal during Thursday’s trading (1/15), Friday’s intraday action brought the stock back to a sell signal and violated support in the lower $300 range that had been in place since November. Support for CEG now lies at $296, the September 2025 chart low, while additional can be found in the $280 range.
While there are broad sector funds along with individual stocks that maintain acceptable technical pictures for the time being, some of the positive evidence for the broader sector has turned negative as it has lagged other sectors.

| Symbol | Name | Price | Yield | PnF Trend | RS Signal | RS Col. | Fund Score | 200 Day MA | Weekly Mom |
|---|---|---|---|---|---|---|---|---|---|
| DIA | SPDR Dow Jones Industrial Average ETF Trust | 494.48 | 1.43 | Positive | Sell | X | 4.17 | 448.83 | + 6W |
| EEM | iShares MSCI Emerging Markets ETF | 58.09 | 2.22 | Positive | Buy | X | 5.55 | 50.27 | + 3W |
| EFA | iShares MSCI EAFE ETF | 99.26 | 3.39 | Positive | Sell | X | 4.39 | 90.83 | + 4W |
| IJH | iShares S&P MidCap 400 Index Fund | 70.24 | 1.36 | Positive | Buy | O | 4.27 | 63.16 | + 7W |
| IJR | iShares S&P SmallCap 600 Index Fund | 129.06 | 1.44 | Positive | Sell | O | 3.18 | 113.39 | + 7W |
| QQQ | Invesco QQQ Trust | 621.78 | 0.46 | Positive | Buy | X | 5.13 | 564.88 | - 3W |
| RSP | Invesco S&P 500 Equal Weight ETF | 199.56 | 1.64 | Positive | Sell | O | 3.15 | 183.72 | + 7W |
| SPY | SPDR S&P 500 ETF Trust | 692.24 | 1.07 | Positive | Buy | X | 4.92 | 633.16 | - 3W |
| XLG | Invesco S&P 500 Top 50 ETF | 58.93 | 0.64 | Positive | Buy | X | 4.84 | 54.02 | - 3W |

Average Level
39.42
| < - -100 | -100 - -80 | -80 - -60 | -60 - -40 | -40 - -20 | -20 - 0 | 0 - 20 | 20 - 40 | 40 - 60 | 60 - 80 | 80 - 100 | 100 - > |
|---|---|---|---|---|---|---|---|---|---|---|---|
|
Buy signalagg
|
|||||||||||
|
Sell signallqd
|
|||||||||||
|
Buy signalVOOG
|
|||||||||||
|
Sell signalief
|
Sell signaldx/y
|
Buy signalVOOV
|
Buy signalijr
|
||||||||
|
Buy signalshy
|
Buy signalQQQ
|
Buy signalgsg
|
Buy signalefa
|
Buy signalrsp
|
|||||||
|
Buy signaltlt
|
Buy signaluso
|
Buy signalSPY
|
Buy signalhyg
|
Buy signaldvy
|
Buy signalEEM
|
Buy signalGLD
|
|||||
|
Buy signalfxe
|
Buy signalXLG
|
Buy signalONEQ
|
Sell signalicf
|
Buy signaldia
|
Buy signaliwm
|
Buy signalIJH
|
Buy signalgcc
|
||||
| < - -100 | -100 - -80 | -80 - -60 | -60 - -40 | -40 - -20 | -20 - 0 | 0 - 20 | 20 - 40 | 40 - 60 | 60 - 80 | 80 - 100 | 100 - > |
| AGG | iShares US Core Bond ETF |
| USO | United States Oil Fund |
| DIA | SPDR Dow Jones Industrial Average ETF |
| DVY | iShares Dow Jones Select Dividend Index ETF |
| DX/Y | NYCE U.S.Dollar Index Spot |
| EFA | iShares MSCI EAFE ETF |
| FXE | Invesco CurrencyShares Euro Trust |
| GLD | SPDR Gold Trust |
| GSG | iShares S&P GSCI Commodity-Indexed Trust |
| HYG | iShares iBoxx $ High Yield Corporate Bond ETF |
| ICF | iShares Cohen & Steers Realty ETF |
| IEF | iShares Barclays 7-10 Yr. Tres. Bond ETF |
| LQD | iShares iBoxx $ Investment Grade Corp. Bond ETF |
| IJH | iShares S&P 400 MidCap Index Fund |
| ONEQ | Fidelity Nasdaq Composite Index Track |
| QQQ | Invesco QQQ Trust |
| RSP | Invesco S&P 500 Equal Weight ETF |
| IWM | iShares Russell 2000 Index ETF |
| SHY | iShares Barclays 1-3 Year Tres. Bond ETF |
| IJR | iShares S&P 600 SmallCap Index Fund |
| SPY | SPDR S&P 500 Index ETF Trust |
| TLT | iShares Barclays 20+ Year Treasury Bond ETF |
| GCC | WisdomTree Continuous Commodity Index Fund |
| VOOG | Vanguard S&P 500 Growth ETF |
| VOOV | Vanguard S&P 500 Value ETF |
| EEM | iShares MSCI Emerging Markets ETF |
| XLG | Invesco S&P 500 Top 50 ETF |
AER AerCap Holdings NV ($143.23) - Aerospace Airline - AER has been a 5 for 5'er since April 2025, having maintained a long-term market RS buy signal for more than three years and peer RS buy signal for north of four years. On its default trend chart, the stock has sustained a buy signal and positive trend since April 2025. More recent action saw the AER complete a fourth buy signal in December at $140 as shares rallied to an all-time chart high at $148 by early January. Action during Wednesday's (1/14) trading brought the trend chart back into Os toward the middle of the 10-week trading band and actionable territory at $142. Long exposure may be added in the mid-$130 to mid-$140 range. We will set our initial stop at $118, which would take out multiple levels of support on AER's default chart. We will use the bullish price objective of $167 as our target price.
Long Ideas
Symbol
Company
Sector
Current Price
Action Price
Target
Stop
Notes
CME
CME Group, Inc.
Wall Street
$272.59
260s - 270s
312
224
4 for 5'er, middle of WALL sector matrix, triple top breakout, 1.8% yield, Earn. 2/4
AFL
AFLAC Incorporated
Insurance
$109.61
108 - 115
143
95
4 for 5'er, top half of INSU sector matrix, LT pos peer & mkt RS, spread triple top, 2% yield, Earn. 2/4
LAMR
Lamar Advertising Company
Media
$132.79
120s - low 130s
158
110
4 for 5'er, top half of MEDI sector matrix, LT pos peer & mkt RS, spread triple top 4.8% yield
ABCB
Ameris Bancorp
Banks
$81.41
70s
92
77
5 for 5'er, top 25% of BANK sector matrix, LT pos peer RS, spread quintuple top, 1.1% yield, Earn. 1/29
LAZ
Lazard Inc.
Wall Street
$53.75
hi 40s - low 50s
69
41
5 for 5'er, middle of WALL sector matrix, LT pos peer & mkt RS, triple top, buy on pullback, good R-R, Earn. 1/29
HLT
Hilton Worldwide Holdings Inc
Leisure
$301.86
hi 260s - low 280s
328
240
5 for 5'er, top half of LEIS sector matrix LT pos peer & mkt RS, quintuple top, Earn. 2/11
THC
Tenet Healthcare Corporation
Healthcare
$201.32
190 - mid 200s
286
170
5 TA rating, top 50% of HEAL sector matrix, LT RS buy, buy-on-pullback, Earn. 2/11
FLS
Flowserve Corporation
Machinery and Tools
$76.62
hi 60s - lo 70s
91
54
5 TA rating, top 10% of MACH sector matrix, LT RS buy, buy-on-pullback
BCO
The Brink's Company
Protection Safety Equipment
$124.80
mid 110s - low 120s
152
104
5 for 5'er, top half of PROT sector matrix, LT pos peer & mkt RS, spread triple top, R-R>2.0
AAPL
Apple Inc.
Computers
$258.21
260s - 270s
380
224
5 for 5'er, top 20% of COMP sector matrix, LT pos mkt RS, buy on pullback, Earn. 1/29
RL
Ralph Lauren
Textiles/Apparel
$369.15
352 - 380s
472
296
5 TA rating, LT RS buy, consec buy signals, buy-on-pullback, Earn. 2/5
CBRE
CBRE Group, Inc.
Real Estate
$170.83
hi 150s - lo 170s
188
134
5 TA rating, top 10% of REAL sector matrix, LT RS buy, consec buy signals, Earn. 2/12
RJF
Raymond James Financial Inc
Wall Street
$171.55
160s
186
142
5 for 5'er, top half of WALL sector matrix, LT pos mkt & peer RS, triple top, pos trend flip, Earn. 1/28
IMAX
Imax Corporation
Media
$36.30
33 - hi 30s
53
26
5 TA rating, top 20% of Media sector matrix, LT pos trend, consec buy signals, buy-on-pullback
GIL
Gildan Activewear
Textiles/Apparel
$63.81
62 - 66
86
52
5 for 5'er, top third of favored TEXT sector matrix, LT pos peer & mkt RS, spread triple top, buy on pullback, R-R>2.0
FIX
Comfort Systems U.S.A.
Building
$1091.04
960 - mid 1100s
1376
864
5 TA rating, top 10% of BUIL sector matrix, LT mkt RS buy, consec buy signals
WFC
Wells Fargo & Company
Banks
$88.96
mid 80s - low 90s
128
76
5 for 5'er, top 25% of BANK sector matrix, LT pos peer & mkt RS, buy on pullback, R-R~3.0
JPM
J.P. Morgan Chase & Co.
Banks
$309.26
lo 300s - mid 320s
380
256
5 TA rating, top 25% of favored BANK sector matrix, LT RS buy, LT pos trend, buy-on-pullback
AER
AerCap Holdings NV
Aerospace Airline
$143.63
mid 130 - mid 140
167
118
5/5'er since 4/25, LT pos. mkt and peer RS since '22, buy on pullback, earnings 2/6.
Short Ideas
Symbol
Company
Sector
Current Price
Action Price
Target
Stop
Notes
Follow-Up Comments
Comment
NDW Spotlight Stock
25
26
148.00
1
148.00
146.00
X
O
146.00
144.00
X
O
144.00
142.00
X
O
142.00
140.00
X
140.00
138.00
X
X
Mid
138.00
136.00
X
O
C
136.00
134.00
X
O
X
134.00
132.00
B
O
X
132.00
130.00
X
O
130.00
128.00
X
128.00
126.00
A
X
Bot
126.00
124.00
X
O
X
124.00
122.00
X
O
X
122.00
120.00
X
O
120.00
118.00
X
X
118.00
116.00
6
O
X
116.00
114.00
X
O
X
114.00
112.00
X
7
X
112.00
110.00
5
O
X
110.00
108.00
X
O
X
108.00
106.00
X
•
X
8
106.00
104.00
X
O
X
•
X
104.00
102.00
X
O
X
X
O
•
X
102.00
100.00
X
X
3
X
O
X
O
•
X
100.00
99.00
X
O
X
O
X
O
X
4
•
•
X
•
99.00
98.00
X
O
X
O
O
X
O
X
•
X
•
X
•
98.00
97.00
X
C
X
X
X
O
X
O
X
O
X
O
X
•
97.00
96.00
X
O
X
O
X
O
X
O
X
O
X
X
O
X
O
X
•
96.00
95.00
X
O
X
O
X
O
X
O
X
O
X
O
X
O
O
X
•
95.00
94.00
O
X
1
2
O
O
X
O
X
O
•
94.00
93.00
O
X
O
X
O
X
•
93.00
92.00
O
O
X
O
X
•
92.00
91.00
O
X
O
X
•
91.00
90.00
•
O
X
O
X
•
90.00
89.00
•
O
X
O
•
89.00
88.00
•
O
X
•
88.00
87.00
•
O
X
•
87.00
86.00
•
O
•
86.00
25
26
Create Watchlist
Create Watchlist

| CRK Comstock Resources ($21.07) - Oil - CRK fell to a sell signal Friday after unsuccessfully testing its bearish resistance line. The move adds to an already negative technical picture as CRK is a 2 for 5'er that ranks in the bottom half of the oil sector matrix. From here, the next level of support sits at $17. |
| LNG Cheniere Energy, Inc. ($206.73) - Oil Service - LNG moved to a buy signal Friday when it broke a double top at $204. However, the technical outlook for the stock remains negative as LNG is a 2 for 5'er that ranks 73rd of 75 names in the oil service sector matrix. From here, the next level of overhead resistance is LNG's bearish resistance line at $232. |
| PWR Quanta Services, Inc. ($466.75) - Building - PWR broke to new highs today, confirming what appears to be extremely strong support around $416. Those interested in taking focused exposure should take today's upside break as an opportunity to do so. Going forward, the perfect 5/5'er will set its sights on the top of the trading band around $520. |
| VST Vistra Corp ($165.85) - Utilities/Electricity - VST reversed into Os and broke a double bottom at $166, ending a series of buy signals off recent lows at $150. While the stock maintains a 3 TA rating, the stock ranks in the bottom decile of the Electric Utilities sector matrix and the next level of support is the bullish support line at $156. From here, a move to $154 would flip the trend to negative and drop the stock to a 2 for 5'er. Price action below $150 would bring the stock to its lowest level since May 2025. |
| Name | Option Symbol | Action | Stop Loss |
|---|---|---|---|
| Amazon.com Inc. - $238.49 | O: 26D240.00D17 | Buy the April 240.00 calls at 16.20 | 212.00 |
| Name | Option | Action |
|---|---|---|
| Corning Incorporated ( GLW) | Feb. 87.50 Calls | Raise the option stop loss to 7.35 (CP: 9.35) |
| Estee Lauder Companies ( EL) | Mar. 105.00 Calls | Stopped at 14.20 (CP: 13.65) |
| Philip Morris International Inc. ( PM) | Mar. 160.00 Calls | Raise the option stop loss to 14.90 (CP: 16.90) |
| eBay Inc. ( EBAY) | Mar. 85.00 Calls | Stopped at 10.35 (CP: 9.90) |
| CME Group, Inc. ( CME) | Mar. 270.00 Calls | Initiate an option stop loss of 12.60 (CP: 14.60) |
| Emerson Electric Co. ( EMR) | Mar. 145.00 Calls | Initiate an option stop loss of 6.60 (CP: 8.60) |
| Name | Option Symbol | Action | Stop Loss |
|---|---|---|---|
| Constellation Brands, Inc. - $156.66 | O: 26P155.00D17 | Buy the April 155.00 puts at 8.10 | 172.00 |
| Name | Option | Action |
|---|---|---|
| GoDaddy Inc. ( GDDY) | Feb. 130.00 Puts | Raise the option stop loss to 21.80 (CP: 23.80) |
| Crocs, Inc. ( CROX) | Mar. 87.50 Puts | Raise the option stop loss to 7.10 (CP: 9.10) |
| Name | Option Sym. | Call to Sell | Call Price | Investment for 500 Shares | Annual Called Rtn. | Annual Static Rtn. | Downside Protection |
|---|---|---|---|---|---|---|---|
| CAVA Group, Inc. $ 72.00 | O: 26B70.00D20 | Feb. 70.00 | 5.70 | $ 33,472.85 | 36.38% | 36.38% | 6.85% |
| Name | Action |
|---|---|
| Lemonade Inc ( LMND) - 80.19 | Sell the February 80.00 Calls. |
| On Semiconductor Corp. ( ON) - 60.28 | Sell the March 60.00 Calls. |
| Orla Mining Ltd. ( ORLA) - 14.65 | Sell the February 15.00 Calls. |
| Dexcom Inc. ( DXCM) - 69.24 | Sell the February 70.00 Calls. |
| Name | Covered Write |
|---|---|
| Fortinet Inc. ( FTNT - 76.32 ) | March 80.00 covered write. |
| Hewlett Packard Enterprise Company ( HPE - 21.95 ) | March 23.00 covered write. |
Daily Equity & Market Analysis
Loading, Please Wait...
