Most Requested Symbols

Index volatility has remained low over the last few years while stocks seemingly fly around everywhere, is there a disconnect?
This week (1/12-1/16) brought with it the start of earnings season as the big banks got going... but there's plenty more in store over the next few weeks.
NDW Morning Update Video - January 15, 2026
NDW Morning Update Video –January 15, 2026.
Click here to download MP3
Outside of a few short periods, index volatility has remained fairly stable. The CBOE SPX Volatility Index (VIX) has spent over 80% of the trading days over the last three years below 20. However, it certainly has not felt like that when looking at individual stock volatility with names like NVIDIA (NVDA) Palantir (PLTR) gaining 999% and 2,471%, respectively, over the last three years. While this first point is more or less anecdotal, there is clear evidence that the volatility of the individual names has shifted higher over the last few years, particularly since 2020. The CBOE S&P Constituent Volatility Index (VIXEQ) looks to measure the market cap weighted 30-day implied volatility of a basket of S&P 500 constituent stocks. The goal of VIXEQ is to give insight into single stock volatility while VIX focuses on index volatility.
In the image below, the historical readings for VIXEQ and VIX going back to 2014 are displayed. VIXEQ was launched in November 2024, so data prior to that is hypothetical. Pre-2020, VIXEQ hugged around the 25 level and was much closer to VIX. Since then, VIXEQ, or individual stock volatility, has shifted materially higher while VIX has been well within historical norms. With much more volatility in the individual stocks versus the index itself today, correlations are lower and there are more opportunities for stock pickers or for a few stocks to do exceptionally well (when have we seen that happen?). In any case, as long as constituent volatility remains well above index volatility relative to historical norms, then stock picking strategies have a good opportunity moving forward.


This week (1/12-1/16) brought with it the start of earnings season as the big banks got going. As we discussed in last week’s Friday Feature, earnings season brings with it the possibility for enhanced volatility as investors get to peak behind the curtain into the results of their favorite companies. Of course, NDW analysis won’t solely focus on the various fundamental metrics presented during earnings calls, our rankings/opinions can shift as price reactions shift overarching supply/demand dynamics. We will take today’s feature to help digest results from a handful of the big banks that have already reported as of midday on 1/14, as well as a technical preview for a handful of big names that report throughout the next week or so.
We will start first by showing you how you can track earnings dates on the NDW platform. Available via NDW’s pre-made Database Reports (via the new screener interface or the “original” view, whichever you prefer…) you will find a screen entitled “stocks with earnings releases.” If you click into that, you will be able to sort by earnings date, as well as a handful of other information. A handful of larger names reporting over the next week include Taiwan Semiconductor (TSM), Morgan Stanley (MS) Goldman Sachs (GS), Netflix (NFLX), Johnson & Johnson (JNJ) & GE Aerospace (GE), among others. Regardless- the database can be a useful timesaver as you run your analysis around earnings season.

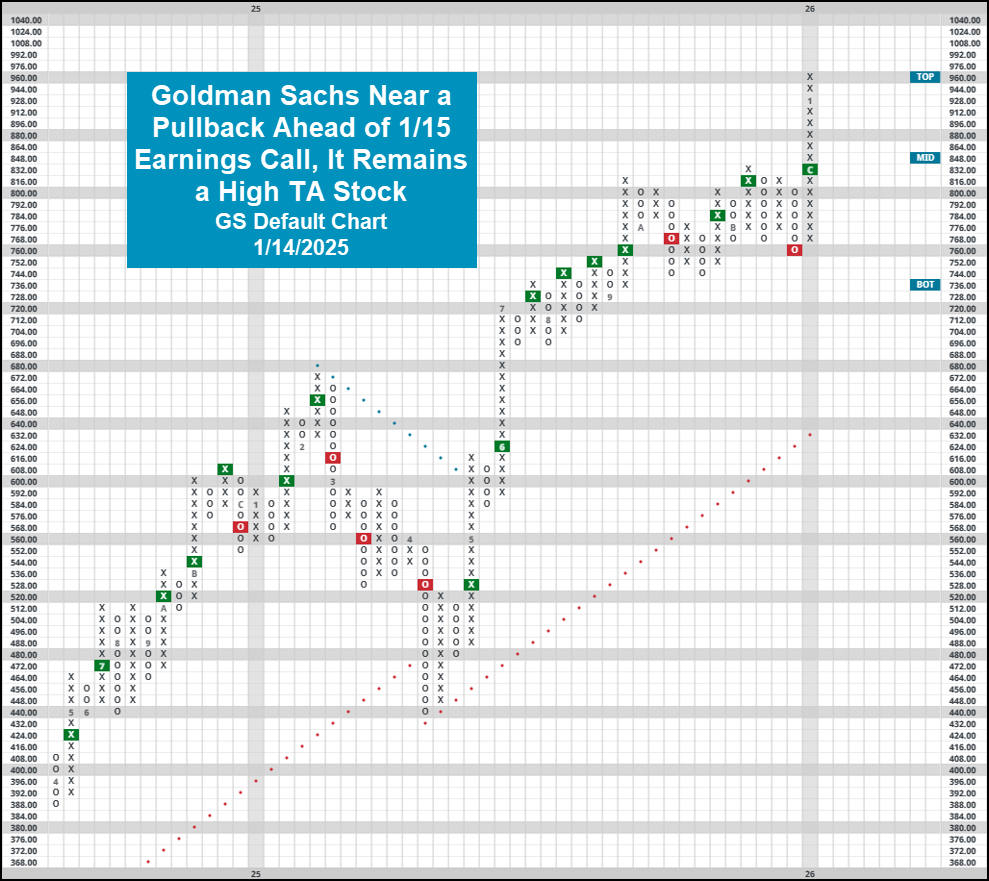
With that said, we can step into a brief technical overview for many of the banks that have reported so far this week. Post-earnings reactions for the likes of JPM, BAC, WFC & C were largely negative, with the bulk of the group falling ~4-6% following their results. Despite this, the overall technical picture for many of the names still remains quite strong. All of the previously mentioned blue-blood banks still earn a TA score of 4 or higher… and while now trading off their own respective highs present somewhat attractive entry points at/around current levels. Keep in mind that prudent investment analysis involves elements of both technicals and fundamentals… so while technically speaking many of these names are still defendable, ensure there are no significant red flags unveiled in the earnings reports before stepping further. Reporting tomorrow is Goldman Sachs (GS) (pictured below) which has yet to reverse back down into a column of O’s on its default chart. On a poor reaction, a pullback to the middle of the trading band wouldn’t be out of the question, following suit with the banks that have already reported this week.
Leaving the banks space, we will shift our focus over to the first of the mega cap tech focused names on the earnings list for next week. Netflix has been the focus of several recent headlines amongst the ongoing acquisition battle over Warner Bros Discovery (WBD). As is usual with potential acquisitions, the potential parent company (in this case Netflix) has fallen over the recent past. Now sitting well off all-time highs established in 2025, NFLX has lost some elements of technical favor as it earns just 3/5 Technical Attributes at the time of this writing. Those with holdings will undoubtedly want to watch the nearby bullish support line sitting just below current levels at $87. A violation of that point would push the media giant back into unfavorable status for the first time since early 2023. On positive results, it will be quite interesting to see how market participants act around $100, a point of stiff resistance from earlier in 2025.
The start of earnings season can be a useful touchpoint for some of your more involved clients as we move into the new year. Remember that those interested clients will likely watch the reported top and bottom line results for their holdings like a hawk… for better or for worse. Knowing what to expect from their key holdings- whether a resulting price reaction is really something to worry about or just a healthy pullback for an otherwise strong name, can help calm the waters around an otherwise emotion-filled time in an investment account.

Each week the analysts at NDW review and comment on all major asset classes in the global markets. Shown below is the summary or snapshot of the primary technical indicators we follow for multiple areas. Should there be changes mid-week we will certainly bring these to your attention via the report.
| Universe | BP Col & Level (actual) | BP Rev Level | PT Col & Level (actual) | PT Rev Level | HiLo Col & Level (actual) | HiLo Rev Level | 10 Week Col & Level (actual) | 10 Week Rev Level | 30 Week Col & Level (actual) | 30 Week Rev Level |
|---|---|---|---|---|---|---|---|---|---|---|
| ALL |
|
42% |
|
38% |
|
62% |
|
54% |
|
46% |
| NYSE |
|
54% |
|
52% |
|
72% |
|
64% |
|
56% |
| OTC |
|
36% |
|
34% |
|
58% |
|
48% |
|
42% |
| World |
|
46% |
|
42% |
|
|
|
56% |
|
52% |

Remember, these are technical comments only. Just as you must be aware of fundamental data for the stocks we recommend based on technical criteria in the report, so too must you be aware of important data regarding delivery, market moving government releases, and other factors that may influence commodity pricing. We try to limit our technical comments to the most actively traded contracts in advance of delivery, but some contracts trade actively right up to delivery while others taper off well in advance. Be sure you check your dates before trading these contracts. For questions regarding this section or additional coverage of commodities email james.west@nasdaq.com.
Data represented in the table below is through 1/13/26:
| Symbol | Name | Price | PnF Trend | RS Signal | RS Col. | 200 Day MA | Weekly Mom |
|---|---|---|---|---|---|---|---|
| CL/ | Crude Oil Continuous | 61.15 | Negative | Sell | O | 62.42 | + 3W |
| DBLCIX | Deutsche Bank Liquid Commodities Index | 468.52 | Positive | Sell | O | 460.74 | - 27W |
| DWACOMMOD | NDW Continuous Commodity Index | 1084.08 | Positive | Buy | O | 1001.22 | + 1W |
| GC/ | Gold Continuous | 4589.20 | Positive | Buy | X | 3663.32 | + 2W |
| HG/ | Copper Continuous | 5.97 | Positive | Buy | X | 4.95 | + 7W |
| ZG/ | Corn (Electronic Day Session) Continuous | 419.75 | Positive | Sell | O | 429.26 | - 3W |

Average Level
35.52
| < - -100 | -100 - -80 | -80 - -60 | -60 - -40 | -40 - -20 | -20 - 0 | 0 - 20 | 20 - 40 | 40 - 60 | 60 - 80 | 80 - 100 | 100 - > |
|---|---|---|---|---|---|---|---|---|---|---|---|
|
Buy signaluso
|
Buy signaliwm
|
||||||||||
|
Sell signallqd
|
Buy signaldvy
|
Buy signalgsg
|
|||||||||
|
Buy signalagg
|
Buy signalVOOG
|
Buy signalhyg
|
Buy signalefa
|
||||||||
|
Sell signalief
|
Sell signaldx/y
|
Buy signalQQQ
|
Buy signaldia
|
Buy signalrsp
|
|||||||
|
Buy signalfxe
|
Sell signalicf
|
Buy signalONEQ
|
Buy signalVOOV
|
Buy signalIJH
|
Buy signalGLD
|
||||||
|
Sell signaltlt
|
Buy signalshy
|
Buy signalXLG
|
Buy signalSPY
|
Buy signalijr
|
Buy signalEEM
|
Buy signalgcc
|
|||||
| < - -100 | -100 - -80 | -80 - -60 | -60 - -40 | -40 - -20 | -20 - 0 | 0 - 20 | 20 - 40 | 40 - 60 | 60 - 80 | 80 - 100 | 100 - > |
| AGG | iShares US Core Bond ETF |
| USO | United States Oil Fund |
| DIA | SPDR Dow Jones Industrial Average ETF |
| DVY | iShares Dow Jones Select Dividend Index ETF |
| DX/Y | NYCE U.S.Dollar Index Spot |
| EFA | iShares MSCI EAFE ETF |
| FXE | Invesco CurrencyShares Euro Trust |
| GLD | SPDR Gold Trust |
| GSG | iShares S&P GSCI Commodity-Indexed Trust |
| HYG | iShares iBoxx $ High Yield Corporate Bond ETF |
| ICF | iShares Cohen & Steers Realty ETF |
| IEF | iShares Barclays 7-10 Yr. Tres. Bond ETF |
| LQD | iShares iBoxx $ Investment Grade Corp. Bond ETF |
| IJH | iShares S&P 400 MidCap Index Fund |
| ONEQ | Fidelity Nasdaq Composite Index Track |
| QQQ | Invesco QQQ Trust |
| RSP | Invesco S&P 500 Equal Weight ETF |
| IWM | iShares Russell 2000 Index ETF |
| SHY | iShares Barclays 1-3 Year Tres. Bond ETF |
| IJR | iShares S&P 600 SmallCap Index Fund |
| SPY | SPDR S&P 500 Index ETF Trust |
| TLT | iShares Barclays 20+ Year Treasury Bond ETF |
| GCC | WisdomTree Continuous Commodity Index Fund |
| VOOG | Vanguard S&P 500 Growth ETF |
| VOOV | Vanguard S&P 500 Value ETF |
| EEM | iShares MSCI Emerging Markets ETF |
| XLG | Invesco S&P 500 Top 50 ETF |

| Symbol | Company | Sector | Current Price | Action Price | Target | Stop | Notes |
|---|---|---|---|---|---|---|---|
| CME | CME Group, Inc. | Wall Street | $268.45 | 260s - 270s | 312 | 224 | 4 for 5'er, middle of WALL sector matrix, triple top breakout, 1.8% yield, Earn. 2/4 |
| AFL | AFLAC Incorporated | Insurance | $107.96 | 108 - 115 | 143 | 95 | 4 for 5'er, top half of INSU sector matrix, LT pos peer & mkt RS, spread triple top, 2% yield, Earn. 2/4 |
| LAMR | Lamar Advertising Company | Media | $129.80 | 120s - low 130s | 158 | 110 | 4 for 5'er, top half of MEDI sector matrix, LT pos peer & mkt RS, spread triple top 4.8% yield |
| ABCB | Ameris Bancorp | Banks | $78.24 | 70s | 92 | 77 | 5 for 5'er, top 25% of BANK sector matrix, LT pos peer RS, spread quintuple top, 1.1% yield, Earn. 1/29 |
| LAZ | Lazard Inc. | Wall Street | $51.32 | hi 40s - low 50s | 69 | 41 | 5 for 5'er, middle of WALL sector matrix, LT pos peer & mkt RS, triple top, buy on pullback, good R-R, Earn. 1/29 |
| HLT | Hilton Worldwide Holdings Inc | Leisure | $300.62 | hi 260s - low 280s | 328 | 240 | 5 for 5'er, top half of LEIS sector matrix LT pos peer & mkt RS, quintuple top, Earn. 2/11 |
| LECO | Lincoln Electric Holdings, Inc. | Machinery and Tools | $251.14 | 240s | 320 | 196 | 5 for 5'er, top third of favored MACH sector matrix, LT pos peer & mkt RS, triple top, 1.3% yield, Earn. 2/12 |
| THC | Tenet Healthcare Corporation | Healthcare | $199.19 | 190 - mid 200s | 286 | 170 | 5 TA rating, top 50% of HEAL sector matrix, LT RS buy, buy-on-pullback, Earn. 2/11 |
| FLS | Flowserve Corporation | Machinery and Tools | $74.84 | hi 60s - lo 70s | 91 | 54 | 5 TA rating, top 10% of MACH sector matrix, LT RS buy, buy-on-pullback |
| BCO | The Brink's Company | Protection Safety Equipment | $122.78 | mid 110s - low 120s | 152 | 104 | 5 for 5'er, top half of PROT sector matrix, LT pos peer & mkt RS, spread triple top, R-R>2.0 |
| AAPL | Apple Inc. | Computers | $261.05 | 260s - 270s | 380 | 224 | 5 for 5'er, top 20% of COMP sector matrix, LT pos mkt RS, buy on pullback, Earn. 1/29 |
| RL | Ralph Lauren | Textiles/Apparel | $366.11 | 352 - 380s | 472 | 296 | 5 TA rating, LT RS buy, consec buy signals, buy-on-pullback, Earn. 2/5 |
| CBRE | CBRE Group, Inc. | Real Estate | $164.71 | hi 150s - lo 170s | 188 | 134 | 5 TA rating, top 10% of REAL sector matrix, LT RS buy, consec buy signals |
| RJF | Raymond James Financial Inc | Wall Street | $167.19 | 160s | 186 | 142 | 5 for 5'er, top half of WALL sector matrix, LT pos mkt & peer RS, triple top, pos trend flip, Earn. 1/28 |
| IMAX | Imax Corporation | Media | $34.46 | 33 - hi 30s | 53 | 26 | 5 TA rating, top 20% of Media sector matrix, LT pos trend, consec buy signals, buy-on-pullback |
| GIL | Gildan Activewear | Textiles/Apparel | $63.02 | 62 - 66 | 86 | 52 | 5 for 5'er, top third of favored TEXT sector matrix, LT pos peer & mkt RS, spread triple top, buy on pullback, R-R>2.0 |
| FIX | Comfort Systems U.S.A. | Building | $1073.14 | 960 - mid 1100s | 1376 | 864 | 5 TA rating, top 10% of BUIL sector matrix, LT mkt RS buy, consec buy signals |
| WFC | Wells Fargo & Company | Banks | $93.56 | mid 80s - low 90s | 128 | 76 | 5 for 5'er, top 25% of BANK sector matrix, LT pos peer & mkt RS, buy on pullback, R-R~3.0 |
| Symbol | Company | Sector | Current Price | Action Price | Target | Stop | Notes |
|---|
| Symbol | Company | Sector | Current Price | Action Price | Target | Stop | Notes |
|---|---|---|---|---|---|---|---|
| AIT | Applied Industrial Technologies, Inc. | Machinery and Tools | $278.77 | mid 240s - ow 260s | 316 | 208 | Removed for earnings. Raise stop to $236. Earn. 1/27 |
| GFI | Gold Fields Limited (South Africa) ADR | Precious Metals | $49.55 | 40 - 44 | 58 | 35 | GFI has moved into heavily overbought territory. OK to hold here. Raise stop to $42. |
| HCA | HCA Healthcare Inc. | Healthcare | $479.32 | 450s - lo 500s | 588 | 384 | Removed for earnings Raise stop to $400. Earn. 1/27 |
| GOOGL | Alphabet Inc. Class A | Internet | $335.97 | 300 - hi 320s | 428 | 268 | GOOGL has moved into heavily overbought territory. OK to hold here. Raise stop to $296Earn. 2/4 |
| ISRG | Intuitive Surgical, Inc. | Healthcare | $561.82 | 590-620 | 800 | 480 | ISRG fell to a sell signal Wednesday. OK to hold here. Maintain $480 stop. Earn. 1/22 |
| GOLF | Acushnet Holdings Corp | Leisure | $88.24 | 80s | 103 | 73 | GOLF has moved into heavily overbought territory. OK to hold here. Raise stop to $75. |
| Comment | |||||||
|---|---|---|---|---|---|---|---|
|
|
|||||||
WFC Wells Fargo & Company R ($89.17) - Banks - WFC is a 5 for 5'er that ranks in the top quintile of the banks sector matrix and has been on peer and market RS buy signals since 2023 and 2024, respectively. After giving two consecutive sell signals in November, WFC rallied, returning to a buy signal with a double top break at $87. The stock continued higher, notching a new all-time at $97. WFC has subsequently pulled back to prior resistance, offering an entry point for long exposure. Positions may be added in the mid $80s to low $90s and we will set our initial stop at $76. We will use the bullish price objective, $128, as our target price. WFC also carries a 1.9% yield.
| 26 | |||||||||||||||||||||||||||||
| 97.00 | X | 97.00 | |||||||||||||||||||||||||||
| 96.00 | 1 | O | 96.00 | ||||||||||||||||||||||||||
| 95.00 | X | O | 95.00 | ||||||||||||||||||||||||||
| 94.00 | X | O | 94.00 | ||||||||||||||||||||||||||
| 93.00 | X | 93.00 | |||||||||||||||||||||||||||
| 92.00 | X | 92.00 | |||||||||||||||||||||||||||
| 91.00 | X | 91.00 | |||||||||||||||||||||||||||
| 90.00 | X | 90.00 | |||||||||||||||||||||||||||
| 89.00 | X | Mid | 89.00 | ||||||||||||||||||||||||||
| 88.00 | B | X | X | 88.00 | |||||||||||||||||||||||||
| 87.00 | X | X | X | O | X | O | C | 87.00 | |||||||||||||||||||||
| 86.00 | X | X | O | X | O | X | O | X | O | X | X | 86.00 | |||||||||||||||||
| 85.00 | X | O | X | O | X | O | X | O | O | X | O | X | 85.00 | ||||||||||||||||
| 84.00 | X | X | O | X | O | X | O | O | X | O | X | 84.00 | |||||||||||||||||
| 83.00 | X | X | O | X | X | O | X | O | O | O | X | • | 83.00 | ||||||||||||||||
| 82.00 | 7 | O | X | O | X | O | X | A | X | O | • | 82.00 | |||||||||||||||||
| 81.00 | X | O | X | O | X | O | X | O | X | • | 81.00 | ||||||||||||||||||
| 80.00 | X | O | X | 8 | X | 9 | X | O | X | • | 80.00 | ||||||||||||||||||
| 79.00 | X | O | X | O | X | O | O | X | • | Bot | 79.00 | ||||||||||||||||||
| 78.00 | X | X | O | O | X | O | • | 78.00 | |||||||||||||||||||||
| 77.00 | X | O | X | O | • | 77.00 | |||||||||||||||||||||||
| 76.00 | • | X | 6 | O | X | • | 76.00 | ||||||||||||||||||||||
| 75.00 | • | X | O | X | O | X | • | 75.00 | |||||||||||||||||||||
| 74.00 | X | O | X | O | X | • | 74.00 | ||||||||||||||||||||||
| 73.00 | X | O | X | O | X | • | 73.00 | ||||||||||||||||||||||
| 72.00 | 5 | O | O | • | 72.00 | ||||||||||||||||||||||||
| 71.00 | X | • | 71.00 | ||||||||||||||||||||||||||
| 70.00 | X | • | 70.00 | ||||||||||||||||||||||||||
| 69.00 | X | • | 69.00 | ||||||||||||||||||||||||||
| 68.00 | X | • | 68.00 | ||||||||||||||||||||||||||
| 67.00 | X | X | • | 67.00 | |||||||||||||||||||||||||
| 66.00 | X | O | X | • | 66.00 | ||||||||||||||||||||||||
| 65.00 | X | O | X | • | 65.00 | ||||||||||||||||||||||||
| 64.00 | X | O | X | • | 64.00 | ||||||||||||||||||||||||
| 63.00 | X | O | X | • | 63.00 | ||||||||||||||||||||||||
| 62.00 | X | O | X | • | 62.00 | ||||||||||||||||||||||||
| 61.00 | X | O | X | • | 61.00 | ||||||||||||||||||||||||
| 60.00 | X | O | • | 60.00 | |||||||||||||||||||||||||
| 26 |
| BOX Box Inc. ($27.32) - Software - BOX fell Wednesday to break a double bottom at $28. This also moves the stock to a negative trend and demotes it to a 1 for 5 TA rating. The weight of the evidence is weak and deteriorating. Note that the stock is at support from last April. Further support is seen at $25. Overhead resistance may be found initially at $32. |
| CHRD Chord Energy Corp. ($94.51) - Oil - CHRD gave an initial buy signal and returned to a positive trend Wednesday when it broke a double top at $96, where it now sits against resistance. The positive trend change will promote the stock to a still unfavorable 1 for 5'er. |
| DOCU DocuSign, Inc. ($62.21) - Software - DOCU declined Wednesday to break a spread triple bottom at $63. This 2 for 5'er has been in a negative trend since September and sits in the bottom half of the unfavored software sector RS matrix. The technical picture is weak and deteriorating. Overhead resistance may be seen at $70. |
| FANG Diamondback Energy Inc ($153.73) - Oil - FANG returned to a buy signal and a positive trend Wednesday when it broke a triple top at $156. The outlook for the stock remains negative, however, as even with the positive trend change FANG is an unfavorable 2 for 5'er. |
| OKE ONEOK, Inc. ($75.85) - Oil Service - OKE gave a second consecutive buy signal and moved to a positive trend Wednesday when it broke a double top at $76, where it now sits against resistance. The positive trend change will elevate the stock to a still unfavorable 2 for 5''er. From here, the first level of support sits at $71. |
| RTX RTX Corp. ($198.24) - Aerospace Airline - RTX posted a second consecutive buy signal on its default chart with action on 1/14, moving to new all-time highs in the process. With the move, the stock is now in heavily overbought territory, so interested parties should continue to find brief exhales to add. Despite this, the overall outlook remains bullish as we move into 2026. Pullbacks can be expected towards the most recent level of support around $186. |
| Name | Option Symbol | Action | Stop Loss |
|---|---|---|---|
| Eli Lilly and Company - $1,070.50 | O: 26D1080.00D17 | Buy the April 1,080.00 calls at 76.55 | 976.00 |
| Name | Option | Action |
|---|---|---|
| Philip Morris International Inc. ( PM) | Mar. 160.00 Calls | Raise the option stop loss to 12.70 (CP: 14.70) |
| eBay Inc. ( EBAY) | Mar. 85.00 Calls | Raise the option stop loss to 9.70 (CP: 11.70) |
| Walmart Inc. ( WMT) | Mar. 115.00 Calls | Raise the option stop loss to 6.45 (CP: 8.45) |
| Name | Option Symbol | Action | Stop Loss |
|---|---|---|---|
| PepsiCo, Inc. - $145.63 | O: 26P145.00D17 | Buy the April 145.00 puts at 5.90 | 158.00 |
| Name | Option | Action |
|---|---|---|
| The Campbell's Company ( CPB) | Jan. 32.00 Puts | Stopped at 4.00 (CP: 3.50) |
| GoDaddy Inc. ( GDDY) | Feb. 130.00 Puts | Raise the option stop loss to 19.90 (CP: 21.90) |
| The Clorox Company ( CLX) | Apr. 100.00 Puts | Stopped at 110.00 (CP: 111.16) |
| Crocs, Inc. ( CROX) | Mar. 87.50 Puts | Initiate an option stop loss of 7.00 (CP: 9.00) |
| Name | Option Sym. | Call to Sell | Call Price | Investment for 500 Shares | Annual Called Rtn. | Annual Static Rtn. | Downside Protection |
|---|---|---|---|---|---|---|---|
| Orla Mining Ltd. $ 15.08 | O: 26B15.00D20 | Feb. 15.00 | 1.00 | $ 6,938.60 | 69.35% | 59.91% | 5.73% |
| Name | Action |
|---|---|
| Lemonade Inc ( LMND) - 81.42 | Sell the February 80.00 Calls. |
| Carnival Corporation ( CCL) - 30.99 | Sell the March 32.00 Calls. |
| Fortinet Inc. ( FTNT) - 78.33 | Sell the March 80.00 Calls. |
| Hewlett Packard Enterprise Company ( HPE) - 22.29 | Sell the March 23.00 Calls. |
| On Semiconductor Corp. ( ON) - 59.41 | Sell the March 60.00 Calls. |
| Name | Covered Write |
|---|---|
|
|
|
Daily Equity & Market Analysis
Loading, Please Wait...
