The end of the year brings with it client conversations and questions about what is coming down the pipeline in 2026. With that said, we will take the final trading day of 2025 to update our Dow Technical Attribute Study,
The end of the year brings with it client conversations and questions about what is coming down the pipeline in 2026, especially after major markets managed to put together their third consecutive year of gains coming out of a disappointing 2022. With that said, we will take the final trading day of 2025 to update our Dow Technical Attribute Study, giving you ammo to talk about what has changed (and more importantly, what hasn’t) as you enter the new year.
The Dow Jones Industrial Average has gone through many changes over the years, both in the constituents of the index itself and in its relevance as a main market benchmark. In terms of recent changes, both Amazon (AMZN) and NVIDIA (NVDA) were added to the .DJIA within the last few years. Despite these recent more tech focused additions, .DJIA has still struggled to keep up with other major benchmarks. Since 1/1/2023, .DJIA has underperformed SPX & NDX by ~33.5% and ~87% respectively. Remember, the Dow Jones is a price weighted index, meaning stocks with higher share prices have a greater influence on the index's value. This difference in weighting methodology means that names like GS & CAT have a larger impact on overall movement than the likes of NVDA or AAPL… for better or for worse.
Regardless, there are fundamental analysts that rate all 30 Dow stocks as a "buy," "overweight," or "hold". While this subjective system is one of the limitations to using traditional fundamental research, it does provide advisors with an opportunity to differentiate themselves using a logical, organized, sell discipline based upon something grounded in supply and demand like our Technical Attribute ratings.
Five Technical Attributes
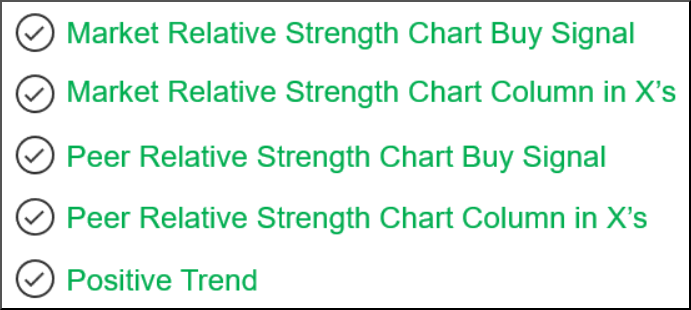
Higher equals better in this rating system. If a stock has all 5 of these attributes in its favor, it is considered a technically strong stock. On the other end of the spectrum, stocks with a technical attribute rating of 0 are considered the weakest of names. As a result, they tend to carry more risk and are often market laggards. This is not to say such stocks can't rise, but our odds of outperformance are much narrower with low attribute names (0, 1, and 2) versus high attribute names (3, 4, and 5). Our general rule of thumb is that a Technical Attribute rating of 3 or higher will increase the odds of success. From an implementation standpoint, using Technical Attributes to evaluate existing portfolios, especially those portfolios being transferred over to you, is one straightforward way to add value. For more information on the value of the NDW Technical Attribute Rating system, click here to read our latest whitepaper.
Reviewing the Stocks in the Dow by Technical Attributes
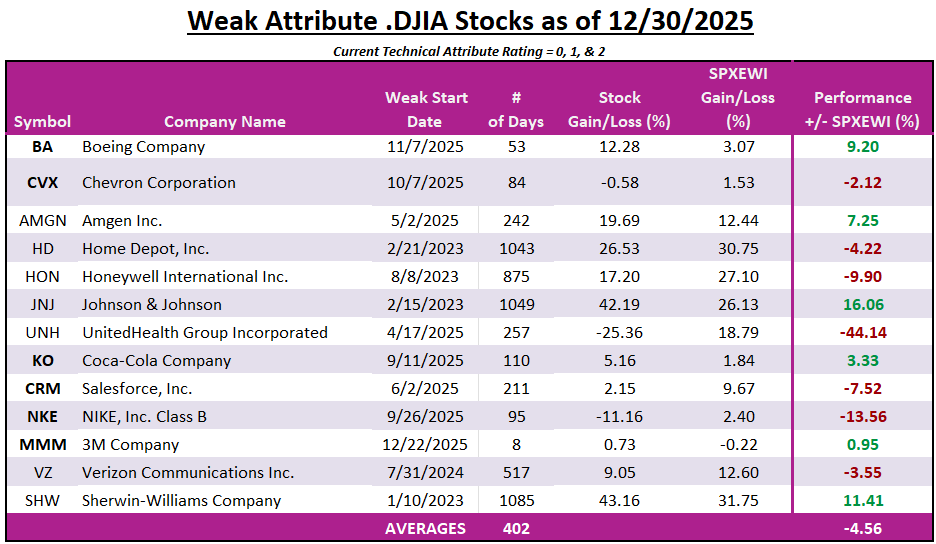
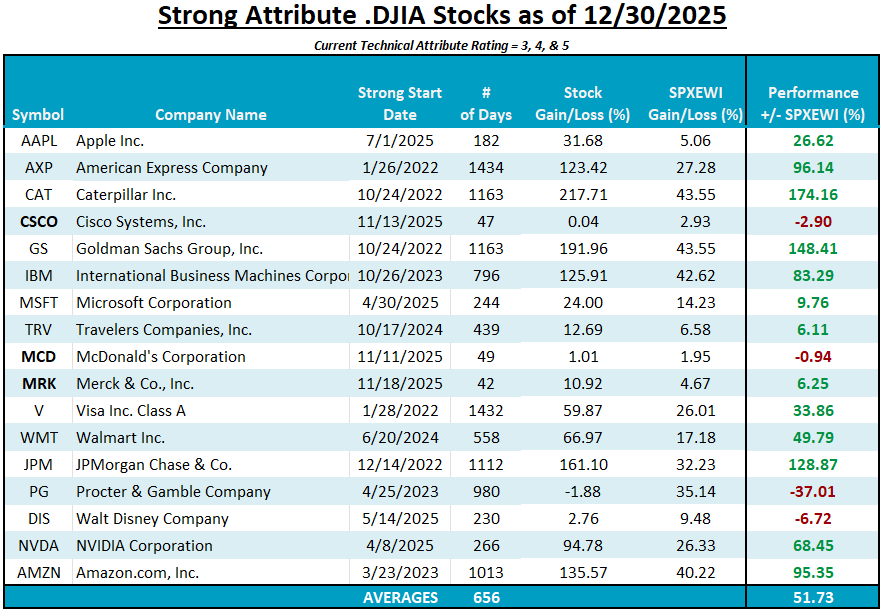
To put some numbers to this rating system, let's look at a Technical Attribute study using the components of the Dow Jones Industrial Average. We update this periodically in the Daily Equity Report, as it allows us to illustrate the benefit of implementing Technical Attributes into your business using a group of companies familiar to us all. We begin by separating the 30 components of the Dow into two categories: "weak attribute" stocks (0, 1, and 2) and "strong attribute" stocks (3, 4, and 5). The objective is two-fold. First, we want to show how each component has done versus the average stock, as represented by the S&P 500 Equal Weight Index SPXEWI. Secondly, we hope to show that using the technical attribute system helps capture the important longer-term trends.
The results of the study convey several relevant pieces of information. For instance, not ALL weak attribute stocks underperform, and not ALL high attribute stocks outperform. We would consider this to be a positive, as every time we see a market process that boasts a 100% success rate, we inherently get skeptical. While the TA rating system may not work every time, it does work over time, highlighting stocks that are market leaders and avoiding stocks that are laggards.
This can be seen in the averages from the tables below. There are currently 17 stocks in the Dow with strong TA ratings (3 or higher) as of 12/29/2025. The average length of time the Technical Attribute Rating has been "strong" for these 17 stocks is 656 days. The average outperformance for those 14 names versus the S&P Equal Weighted Index since becoming strong attribute names is over 51%, excluding dividends. Only four of these names have underperformed SPXEWI during their time in the high attribute territory, CSCO, MCD, DIS, & PG with Procter & Gamble being the only one to underperform the benchmark by more than 10%. Note that CSCO & MCD both gained technical favor within the last two months, and their overall underperformance has been relatively narrow. Other recent movers (since our last update in August) are highlighted in each table below, helping draw attention to those stocks that have gained/lost favor.
On the other hand, the remaining 13 stocks in the Dow are categorized as weak attribute names (2 or lower), and on average, these stocks have been technically weak for 402 days. Once a stock falls below the threshold of 3 positive attributes, this condition of lethargy can persist for an extended period. The average underperformance of these stocks since becoming weak attribute names is -4.56%, illustrating the importance of watching the Technical Attribute pictures for stocks that you own or manage over time. While it hasn’t been a large magnitude of underperformance during the current period, it is far less than the average return of strong attribute stocks which highlights the opportunity costs of sticking with a low attribute name on average. Just like our positive attribute table, there are certainly instances where low attribute stocks can outperform the benchmark. If this outperformance persists, these stocks can (and have) become high RS names fit for investment.
This screening process can be both a crucial aspect of your portfolio management strategy and an important part of your story with clients and prospects. The "story," in this case, is not "being right all the time." Instead, it is adding a level of analysis to your process that is not afraid to say "sell" when a holding indicates that it has likely gone into hibernation… while more fundamental analysts will maintain their “buy” or “hold” rating far longer than it would be rational. While these ratings may miss a few modest periods of outperformance or underperformance, it is self-correcting by nature, helping you to stick with the important trends in the market.