Apple announced the release of the iPhone 17 on 9/9. What have iPhone releases historically meant for the stock?
Chances are, you are reading this on an iPhone, an iPad, MacBook, Apple Watch, or maybe even listening to NDW’s newest podcast through your Airpods. If not, you’ll probably end up seeing or interacting with at least one Apple product before heading home this evening to turn on some Apple TV and binge your favorite show. Apple has its hand in nearly everyone’s pockets in one shape or another, whether that be the newest iPhone or that pesky recurring charge for 200 GB of storage you forgot to cancel years ago. It is for this reason that AAPL’s product events are heavily watched. With consumer spending remaining resilient, especially among the higher earners and Apple’s prime customer base, all eyes will be on the latest iPhone 17 (announced on 9/9 with a 9/19 release date). As all of us (including your clients) will be inundated with marketing urging them to buy the newest pocket-sized supercomputer, so let’s look at historical iPhone releases and Apple’s performance tendances.
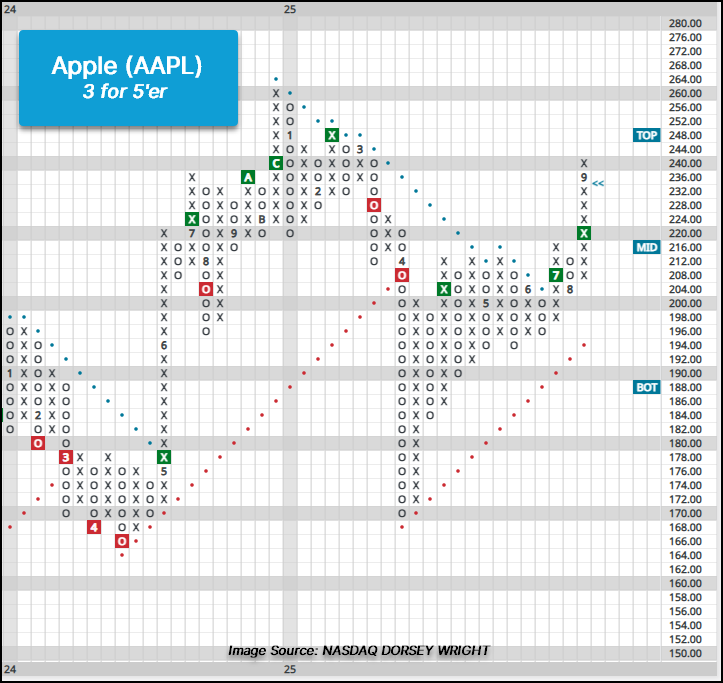
Before diving into the stock’s performance following iPhone releases, it is worth observing the current technical picture. After marking a new all-time high in December 2024 at $260, AAPL consolidated to begin 2025 before giving consecutive sell signals in March and April. While returning to a buy signal in April, the stock did reverse down into Os on its market RS chart and ultimately reversed into Os on the peer RS chart after lagging other computer stocks off the market lows. July’s action brought a positive trend flip, returning the stock to a 3 for 5’er, and cleared notable resistance in the $210 range. Action over the last month led to a third buy signal as shares rallied to $240, just below resistance in the mid to upper $240 range. Initial support may be seen around prior resistance in the $210 range, while additional may be found at $204 and in the $190 range.
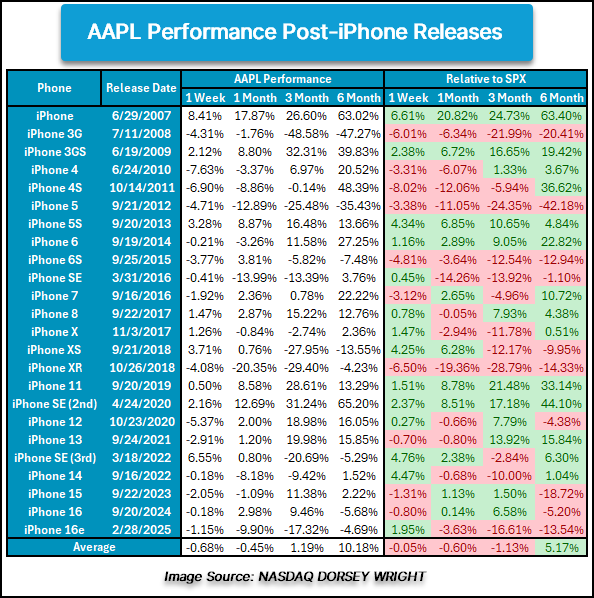
Apple will drum up interest in their new phone, that’s for certain. But does that mean interest in their stock will follow suit? The chart below details AAPL absolute and relative performance following historical announcements of their newest iPhones going back to 2007. On both fronts, AAPL finds itself in the red against SPX in the near term, in classic “buy the rumor sell the news” fashion. In more intermediate time frames, AAPL tends to claw some of that back, highlighting the staying power of their tech in consumers’ pockets. Despite the apparent lack of genuinely “new” features in iPhones in the last few years, relative performance in the near-term has improved with more recent iPhone releases. While the shorter-term timeframe may appear rockier for Apple – often due to more than a single product release – positive absolute and relative performance favors Apple over the long-term. Historically near-term weakness following iPhone announcements have been decent opportunities to enter. Those seeking exposure to Apple could consider it in the $220 to mid-$230 range.