Most Requested Symbols

The average distribution level is 42.14%.
Today's featured stock is Clean Harbors Inc (CLH).
APTV, CAT, CDNS, CHD, DOCU, FANG, LW, MGPI, SAIA, SCHW, UPS, VC, and W
Call: Shell PLC (SHEL); Put: Marvel Technologies (MRVL); Covered Write: Synchrony Financial (SYF).
NDW Morning Update Video - January 30, 2023
NDW Morning Update Video
Click here to download MP3
The S&P 500 Index has continued to climb this week in the midst of earnings season, notching a 2.46% gain to close above the 4070 level for the first time this year. That brings the index to a 6% gain so far this year, leading it to give a fourth consecutive buy signal on its default chart after returning to a positive trend earlier this week. There are 108 names in the S&P 500 Index slated to release earnings next week, including many of the largest names in the cap-weighted market benchmark. Those names combine to make up over 33% of the market capitalization of the index. This is the largest percentage of the total market capitalization to report in a single week during this earnings season, highlight the importance of the next few trading days. Today, we will review the current technical pictures of the largest names set to report over the next five trading days, including Apple (AAPL), Amazon (AMZN), Alphabet (GOOGL), and Exxon Mobil (XOM).
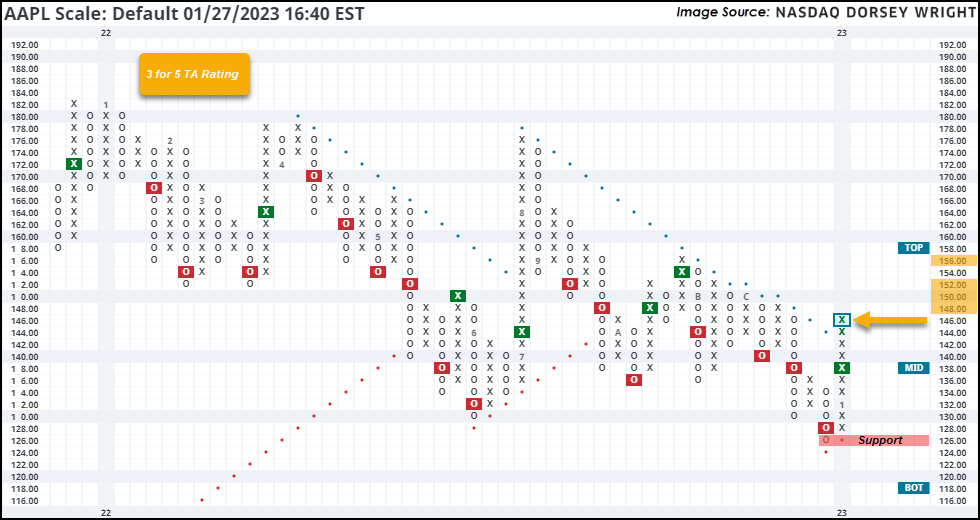
Apple Inc. AAPL – Earnings Expected on Thursday, 2/2/2023
Apple has shown sharp improvement so far this year by reversing up from its 52-week low of $126 to break a double top last week at $138, ending a streak of four consecutive sell signals. This week saw further improvement as the stock pushed through its bearish resistance line to the current chart position of $146. That improves AAPL to a 3 for 5 TA rating, as it has maintained an RS buy signal against the market since 2004 and has been on a buy signal against the DWACOMP group since mid-2017. While the technical picture is still mixed, weekly momentum recently flipped positive, suggesting the potential for further upside from here. Initial support now lies at $126. Overhead resistance may be seen initially at $148 from December, with further resistance seen from $150 - $156.
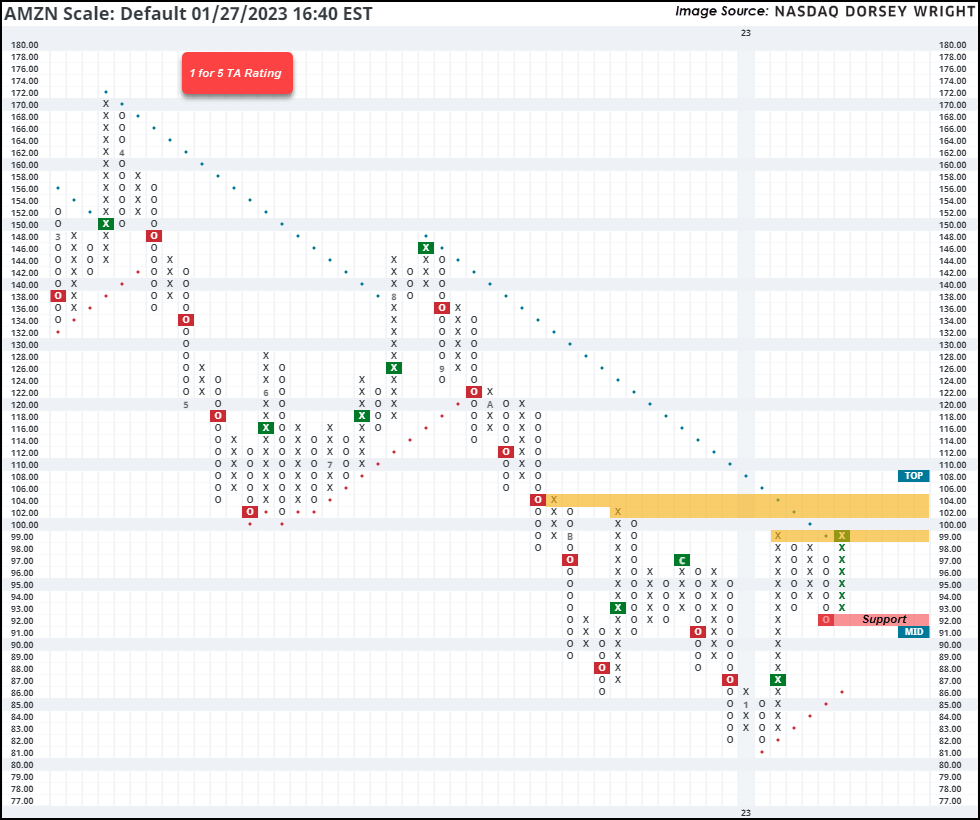
Amazon.com Inc. AMZN – Earnings Expected on Thursday, 2/2/2023
Amazon has shown improvement throughout the first few weeks of the year, notching an 18% gain after the stock moved higher this week to $99. That movement also led the stock to push through the bearish resistance line that had been in place since September, moving it back into a positive trend. However, that is the lone technical attribute that AMZN currently has in its favor, as it continues to sit on an RS sell signal against both the market and the DWAINET group. The weight of the technical evidence is still weak despite the near-term absolute strength. The stock is positioned at resistance from earlier this month, with further resistance seen in the $102-$104 range. Initial support is seen at $92.
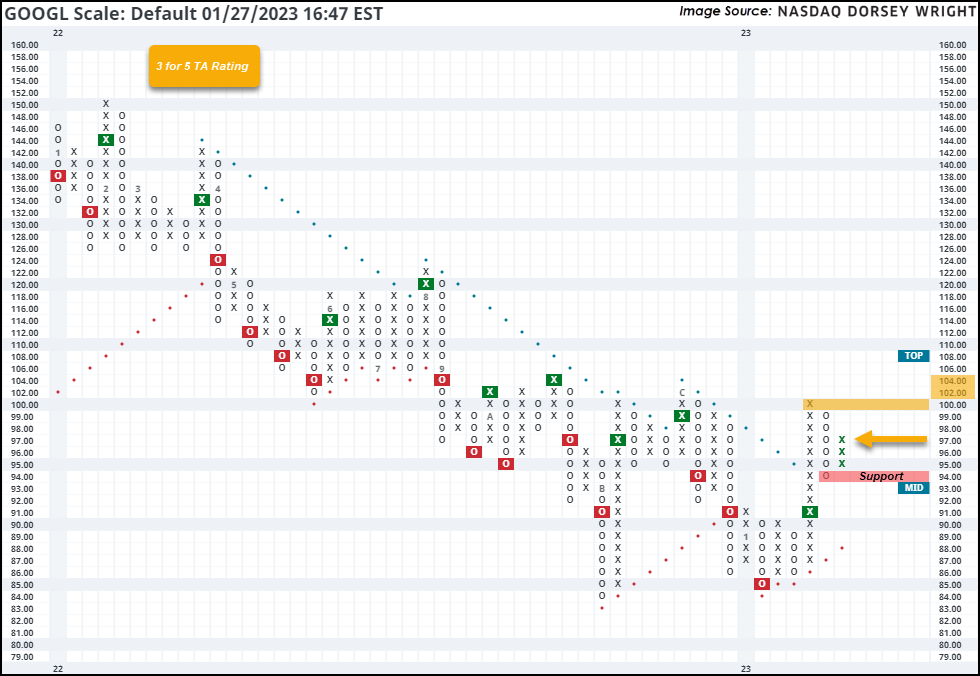
Alphabet Inc. Class A GOOGL – Earnings Expected on Thursday, 2/2/2023
GOOGL has shown improvement alongside other mega-cap names to start off 2023, as the stock moved back to a buy signal earlier this month before continuing to break through the bearish resistance line last week. This promoted GOOGL back to a 3 for 5 TA rating. The stock has maintained an RS buy signal against the market since 2014. The technical picture is mixed here but is showing near-term strength. Movement this week led the stock to reverse back up into a column of Xs to the current chart position at $97, marking a higher low with initial support now seen at $94. Overhead resistance may be found at $100 with further resistance seen in the $102-104 range from last year.
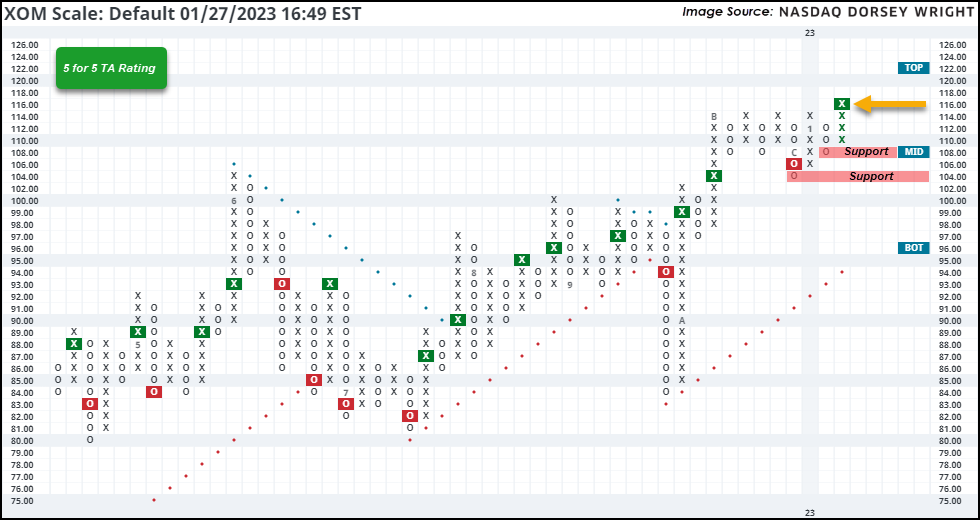
Exxon Mobil Corporation XOM – Earnings Expected on Tuesday, 1/31/2023
XOM moved higher this week to break a quintuple top at $116, marking a new all-time high. This stock is now the eighth largest name in the S&P 500 Index and is the third largest stock that currently possess a 5 for 5 TA rating (behind BRK.B and NVDA). XOM has maintained a positive trend since October and has been on an RS buy signal against the market since January 2022. It also sits in the top quintile of the oil sector RS matrix. Monthly momentum just flipped positive as well, suggesting the potential for further price appreciation. The weight of the technical evidence is favorable and continues to improve. Support is seen initially at $108 and $104, with further support offered at $97.

The 2022 bear market ushered numerous failed rallies, and as a result, many investors are examining the current run with greater scrutiny. As frequent readers of this report and/or users of the platform know, there are a variety of technical indicators that can tell us where we are in a market and where might we be headed – often cited ones are DALI (Dynamic Asset Level Investing), the Asset Class Group Scores (ACGS), Bullish Percents, Positive Trend Readings, and Ten Week Charts. However, there are also a handful of key relationships between broad market funds and individual sectors that provide equally valid insights, one we will highlight today is between Consumer Staples and Consumer Discretionary.
To be clear, when we use the term staples, or non-cyclical, we are referring to a basket of stocks that represent companies involved in the core production of essential products used by consumers. This includes items like food, beverages, household goods, hygiene products, and even alcohol and tobacco. On the other hand, consumer discretionary stocks are representative of companies that produce goods and services considered non-essential by consumers, but desirable. Examples of these would be durable goods, high-end apparel, entertainment, leisure activities, and automobiles.
Given this distinction, Consumer Staples are often pegged as a boring sector; however, we believe the space becomes much more interesting when comparing its price movements to those of the Consumer Discretionary sector.

The image above plots the average technical score between Consumer Non-Cyclicals (Staples) funds and Consumer Cyclicals funds. In short, when the blue line is above the red line it means that non-Cyclicals are behaving better than Cyclicals; in other words, when Non-Cyclicals are scoring above Cyclicals we have quantifiable reason to believe that there is greater market demand for defensive investments. Historically, this has been an important relationship to monitor as evidenced in the bulleted points below. Note that the stats use data beginning in 2011.
When returning our eyes to the graph, notice that the two groups are quickly heading toward each - a move that was absent from the 2022 market rallies. Bulls should like to see the Cyclicals group overtake non-Cyclicals. Past crosses have coincided with market inflection points, so this should be a chart to watch closely.
Another look at this sector relationship is the 3.25% relative strength (RS) chart between the Consumer Staples ETF (XLP) and the Consumer Discretionary ETF (XLY). As seen below, the chart tends to “trend” quite nicely – what we mean by that is the consistency of signals. Typically, buy signals lead to more buy signals, and sell signals lead to more sell signals.

In addition to a nice-looking relative strength chart, the broader market implications of this relationship are surprisingly robust as demonstrated in the embedded performance table in the chart above.
For those that got turned around in the XLP, XLY, non-Cyclical, and Cyclical jargon the point is this – Consumer Staples (a defensive sector) still has the upper hand on Consumer Discretionary based on the charts presented today, which in the past has coincided with unfavorable broad market returns. However, the technical relationship between Consumer Staples and Consumer Discretionary is close to flipping which bulls would certainly like to see.
| Symbol | Name | Price | Yield | PnF Trend | RS Signal | RS Col. | Fund Score | 200 Day MA | Weekly Mom |
|---|---|---|---|---|---|---|---|---|---|
| DIA | SPDR Dow Jones Industrial Average ETF Trust | 339.36 | 1.91 | Positive | Sell | O | 2.79 | 323.65 | +1W |
| EEM | iShares MSCI Emerging Markets ETF | 42.50 | 2.49 | Positive | Sell | X | 3.40 | 39.22 | +3W |
| EFA | iShares MSCI EAFE ETF | 71.74 | 2.68 | Positive | Sell | X | 4.40 | 64.49 | +2W |
| FM | iShares MSCI Frontier and Select EM ETF | 26.94 | 2.75 | Positive | Sell | O | 2.07 | 27.00 | +2W |
| IJH | iShares S&P MidCap 400 Index Fund | 260.00 | 1.68 | Positive | Sell | X | 4.40 | 243.46 | +2W |
| IJR | iShares S&P SmallCap 600 Index Fund | 101.81 | 1.41 | Positive | Sell | O | 2.90 | 97.35 | +2W |
| QQQ | Invesco QQQ Trust | 293.34 | 0.80 | Negative | Sell | O | 2.40 | 292.72 | +2W |
| RSP | Invesco S&P 500 Equal Weight ETF | 150.52 | 1.82 | Positive | Buy | X | 5.47 | 142.30 | +2W |
| SPY | SPDR S&P 500 ETF Trust | 404.75 | 1.65 | Positive | Sell | O | 2.34 | 395.04 | +2W |
| XLG | Invesco S&P 500 Top 50 ETF | 293.88 | 1.34 | Positive | Sell | O | 2.10 | 295.54 | +2W |
The SPDR Dow Jones Industrial Average ETF Trust DIA remains unchanged this week, sitting in a column of O’s at a price of $330. The fund has a current score of 2.79 with a positive score direction of .88, and it now scores below the average US score of 3.13. DIA remains in a positive trend at current levels. Support is offered at $290 on the default chart, the September 2022 chart low, with overhead resistance at $345.
The iShares MSCI Emerging Markets ETF EEM sits in a column of X’s this week, recently seen at a price of $42.50. EEM has now posted a third consecutive buy signal and moved back into a positive trend to start the year. With this positive action, EEM now outscores the average Non-US Fund score of 3.24 scoring an above-average 3.40 score. Support is now seen at a price of $38.00.
The iShares MSCI EAFE ETF EFA sits in a column of X’s this week at an unchanged price of $71.00. The fund remains in a positive trend but is towards the top of its trading band with a weekly OBOS reading of 91%. The fund now showcases a strong 4.40 fund score, outpacing the average non-US score of 3.23. Support is offered at $55 on the default chart.
The iShares MSCI Frontier and Select EM ETF FM remains in a column of X’s this week after bouncing off its bullish support line in the middle of November. The fund has a weak score of 2.07 and is paired with a positive .63 score direction. Bouncing off support, FM is now seen at a price of $27. Support is seen below at $23.50, lows for 2022.
The iShares S&P MidCap 400 Index Fund IJH remains in a column of X’s this week, posting a buy signal at $260 and returning to a positive trend over the last 7 days. The fund has a current fund score of 4.40 which is above the average US score of 3.13. Support can be found at $240 on the default chart, the December 2022 lows.
The iShares S&P SmallCap 600 Index Fund IJR reversed up into X’s this week and sits at a price of $102. The fund maintains a weak technical posture having recently broken a string of 2 consecutive sell signals and breaking back into a positive trend with recent action. IJR now sits below the acceptable fund score of 3.0 with a score of 2.90 and is paired with a now positive 1.18 score direction. Support is offered at $98 on the default trend chart.
The Invesco QQQ Trust QQQ remains in a column of X’s this week, sitting at a price of $295. QQQ remains in a negative trend and has an unacceptable fund score of 2.40. Any move further would post a triple top buy signal and return the fund to a positive trend. The current fund score is lower than the average US fund (3.13), and the fund holds a now positive 1.11 score direction. Initial support is offered at $260.
The Invesco S&P 500 Equal Weight ETF RSP remains in a column of X’s this week, sitting at a price of $150. The reversal signals the “action point” of a shakeout for the fund, with the completion of the pattern coming above at $152. RSP holds a positive 1.64 score direction and has a fund score of 5.47. This beats the average S&P 500 Index fund score of 3.43 and remains the highest score of the funds in this report. Support is seen at $140 on the default chart.
The SPDR S&P 500 ETF Trust SPY remains in a column of X’s this week, sitting at a price of $405. The fund has a 2.34 score posting which is below the average S&P 500 Index fund score of 3.43. SPY remains in a positive trend and would complete a shakeout pattern with a triple top buy signal at $415. Support is seen at $375 on the default chart.
The Invesco S&P 500 Top 50 ETF XLG reversed into a column of X’s this week and currently sits at a price of $295. XLG now has a 2.10 fund score with a now positive score direction of .51. XLG still scores below the average US Fund (3.13). Support is seen at $275 on the default chart.

Average Level
42.14
| < - -100 | -100 - -80 | -80 - -60 | -60 - -40 | -40 - -20 | -20 - 0 | 0 - 20 | 20 - 40 | 40 - 60 | 60 - 80 | 80 - 100 | 100 - > |
|---|---|---|---|---|---|---|---|---|---|---|---|
|
Buy signalvoog
|
|||||||||||
|
Sell signaldvy
|
Sell signalRSP
|
||||||||||
|
Buy signaltlt
|
Buy signalijh
|
||||||||||
|
Buy signalgcc
|
Sell signaloneq
|
||||||||||
|
Buy signalijr
|
Sell signalqqq
|
||||||||||
|
Sell signalspy
|
Buy signalicf
|
||||||||||
|
Buy signalxlg
|
Buy signallqd
|
||||||||||
|
Buy signaldia
|
Buy signaliwm
|
Buy signalagg
|
|||||||||
|
Sell signalgsg
|
Buy signalief
|
Buy signalVOOV
|
Buy signalfxe
|
Buy signalgld
|
|||||||
|
Sell signaldx/y
|
Buy signaluso
|
Buy signalhyg
|
Buy signalSHY
|
Buy signalefa
|
Buy signaleem
|
||||||
| < - -100 | -100 - -80 | -80 - -60 | -60 - -40 | -40 - -20 | -20 - 0 | 0 - 20 | 20 - 40 | 40 - 60 | 60 - 80 | 80 - 100 | 100 - > |
| AGG | iShares US Core Bond ETF |
| USO | United States Oil Fund |
| DIA | SPDR Dow Jones Industrial Average ETF |
| DVY | iShares Dow Jones Select Dividend Index ETF |
| DX/Y | NYCE U.S.Dollar Index Spot |
| EFA | iShares MSCI EAFE ETF |
| FXE | Invesco CurrencyShares Euro Trust |
| GLD | SPDR Gold Trust |
| GSG | iShares S&P GSCI Commodity-Indexed Trust |
| HYG | iShares iBoxx $ High Yield Corporate Bond ETF |
| ICF | iShares Cohen & Steers Realty ETF |
| IEF | iShares Barclays 7-10 Yr. Tres. Bond ETF |
| LQD | iShares iBoxx $ Investment Grade Corp. Bond ETF |
| IJH | iShares S&P 400 MidCap Index Fund |
| ONEQ | Fidelity Nasdaq Composite Index Track |
| QQQ | Invesco QQQ Trust |
| RSP | Invesco S&P 500 Equal Weight ETF |
| IWM | iShares Russell 2000 Index ETF |
| SHY | iShares Barclays 1-3 Year Tres. Bond ETF |
| IJR | iShares S&P 600 SmallCap Index Fund |
| SPY | SPDR S&P 500 Index ETF Trust |
| TLT | iShares Barclays 20+ Year Treasury Bond ETF |
| GCC | WisdomTree Continuous Commodity Index Fund |
| VOOG | Vanguard S&P 500 Growth ETF |
| VOOV | Vanguard S&P 500 Value ETF |
| EEM | iShares MSCI Emerging Markets ETF |
| XLG | Invesco S&P 500 Top 50 ETF |
| Symbol | Company | Sector | Current Price | Action Price | Target | Stop | Notes |
|---|---|---|---|---|---|---|---|
| GPK | Graphic Packaging Intl. | Forest Prods/Paper | $23.78 | 21 - 23 | 26 | 18 | 5 for 5'er, #2 of 15 in favored FORE sector matrix, LT pos mkt RS, triple top, 1.3% yield, Earn. 2/7 |
| RF | Regions Financial Corporation | Banks | $23.20 | low 20s | 32.50 | 17.50 | 4 for 5'er, top half of favored BANK sector matrix, one box from RS buy signal, R-R>3.0, 3.6% yield |
| AES | The AES Corporation | Utilities/Electricity | $27.62 | lo-mid 20s | 43.50 | 18.50 | 5 TA rating, top quintile EUTI sector, buy-on-pullback, 2.52% yield, R-R > 4.5, Earn. 2/22 |
| BOX | Box Inc. | Software | $31.95 | mid-hi 20s | 48 | 22 | 5 TA rating, top third SOFT sector, cons. buy signals, R-R > 2.5 |
| PGR | The Progressive Corporation | Insurance | $134.91 | low 120s - low 130s | 168 | 106 | 4 for 5'er, top quartile of favored INSU sector matrix, one box from mkt RS buy, spread triple top |
| BDX | Becton, Dickinson and Company | Healthcare | $249.14 | 240s - mid 250s | 308 | 212 | 5 for 5'er, LT pos mkt RS, quad top breakout, pos trend change, 1.5% yield, Earn. 2/2 |
| GFF | Griffon Corp | Building | $39.81 | low-to-mid 30s | 45 | 28 | 5 for 5'er, 8th of 76 in favored BUIL sector matrix, spread quad top, 1.1% yield, Earn. 1/30 |
| EAT | Brinker International Inc | Restaurants | $38.97 | mid 30s | 56 | 27 | 4 TA rating, top quintile REST sector matrix, 4 consec. buy signals, R-R > 2, Earn. 2/1 |
| TECK | Teck Resources Limited | Metals Non Ferrous | $41.65 | mid-to-high $30s | 51 | 31 | 5 for 5'er, top half of favored META sector matrix, triple top, pos trend flip, R-R>2.0, Earn. 2/21 |
| COHU | Cohu, Inc. | Semiconductors | $36.81 | mid 30s | 51 | 29 | 4 for 5'er. top 10% of SEMI sector matrix, big base breakout, R-R>2.5, Earn. 2/8 |
| MODN | Model N Inc. | Software | $42.28 | hi 30s - low 40s | 64 | 34 | 4 for 5'er, one box from mkt RS buy signal, mutliple consec buys, R-R>3.0,Earn. 2/7 |
| TJX | The TJX Companies, Inc. | Retailing | $82.46 | 77 - 81 | 94 | 62 | 4 for 5'er, top quintile of RETA sector matrix, multiple consec buy signals, 1.5% yield. Earn. 2/21 |
| SYK | Stryker Corporation | Healthcare | $252.41 | low 220s - hi 240s | 356 | 200 | 4 TA rating, top third HEAL sector, buy-on-pullback, LT RS buy, R-R > 3, Earn. 1/31 |
| TRI | Thomson Reuters Corporation | Media | $118.40 | hi 100s - mid 110s | 91 | 4 for 5'er, 5th of 44 in MEDI sector matrix, one box from mkt RS buy signal, bullish triangle, R-R>2.0, 1.6% yield, Earn. 2/9 | |
| ROST | Ross Stores, Inc. | Retailing | $120.71 | 110s | 146 | 94 | 4 for 5'er, top 10% of RETA sector matrix, multiple consec buy signals, 1.1% yield |
| MCK | McKesson Corporation | Drugs | $384.12 | hi 360s - lo 400s | 464 | 324 | 5 TA rating, top third DRUG sector, LT pos. trend, consec. higher bottoms, Earn. 2/1 |
| TSCO | Tractor Supply Company | Retailing | $226.72 | mid 210s - high 230s | 298 | 186 | 5 TA rating, LT market RS buy, recent peer RS buy, top half RETA sector matrix |
| MSI | Motorola Solutions Inc. | Telephone | $257.25 | hi 240s - lo 270s | 316 | 212 | 5 TA rating, top decile of TELE sector matrix, consec. buy signals, LT mkt RS buy, Earn. 2/7 |
| AON | Aon Corporation | Insurance | $324.84 | mid 290s - low 310s | 324 | 264 | 4 for 5'er, top half of favored INSU sector matrix, one box from mkt RS buy signal, bullish catapult, Earn. 2/3 |
| V | Visa Inc. | Finance | $224.71 | 210s - 220s | 262 | 188 | 5 for 5'er top third of FIN sector matrix, LT pos mkt RS, spread quintuple top |
| HIG | The Hartford Financial Services Group | Insurance | $77.68 | mid-hi 70s | 103 | 60 | 5 TA rating, top third INSU sector matrix, cons. buy signals, LT RS buy, buy-on-pullback, 2.15% yield, Earn. 2/2 |
| APO | Apollo Global Management Inc. | Wall Street | $70.43 | mid 60s - low 70s | 92 | 56 | 5 TA rating, 5 consec. buy signals, LT RS buy, 2.41% yield, R-R > 2,Earn. 2/9 |
| AME | Ametek Inc | Electronics | $143.55 | hi 130s - lo 150s | 186 | 124 | 5 TA rating, top half of ELEC sector matrix, 4 consec. buys, recent pos. wkly mom., LT RS buy, Earn. 2/2 |
| SCHW | The Charles Schwab Corporation | Wall Street | $78.05 | hi 70s - mid 80s | 95 | 65 | 5 for 5'er, favored WALL sector, multiple consec buys, pullback to middle of trading band |
| ACHC | Acadia Healthcare Company Inc | Healthcare | $84.34 | 82 - 89 | 97 | 73 | 5 for 5'er, top half of HEAL sector matrix, LT pos mkt RS, pos trend change, triple top |
| ADC | Agree Realty Corporation | Real Estate | $74.36 | low-to-mid $70s | 88 | 63 | 4 for 5'er, top half of REAL sector matrix. multiple consec buy signals, 3.9% yield, Earn. 2/14 |
| SLB | Schlumberger Limited | Oil Service | $57.47 | mid-to-hi 50s | 84 | 46 | 5 for 5'er, #5 of 40 in favored OILS sector matrix, pullback from mutli-year high, R-R>2.0, 1.2% yield |
| DKS | Dick's Sporting Goods, Inc. | Retailing | $125.99 | lo 120s - mid 130s | 176 | 106 | 5 TA rating, top quintile of RETA sector matrix, R-R > 2.50 |
| AXON | Axon Enterprise Inc. | Protection Safety Equipment | $192.33 | mid 180s - low 190s | 238 | 162 | 4 for 5'er, #1 of 10 in PROT sector matrix, one box from mkt RS buy, pullback from ATH, Earn. 2/22 |
| AVGO | Broadcom Ltd | Semiconductors | $598.58 | mid 560s - lo 620s | 696 | 496 | 5 TA rating, top half SEMI sector matrix, fifth consec. buy signal, bullish triangle, LT mkt RS buy |
| CLH | Clean Harbors Inc | Waste Management | $127.72 | 120s | 172 | 106 | 5 for 5'er, #2 of 18 in WAST sector matrix, spread quad top, pos wkly mom flip, Earn. 2/21 |
| Symbol | Company | Sector | Current Price | Action Price | Target | Stop | Notes |
|---|
| Comment | |||||||
|---|---|---|---|---|---|---|---|
|
|
|||||||
CLH Clean Harbors Inc R ($127.71) - Waste Management - CLH is a 5 for 5'er that ranks second of 18 names in the favored waste management sector matrix. After going through a period of consolidation since September, WM broke out when it completed a spread quadruple top at $126 earlier this week. A recent flip to positive weekly momentum is a positive sign for the stock's potential for further upside from here. Long exposure may be added in the $120s and we will set our initial stop at $106, which would take out CLH's September low. We will use the bullish price objective, $172, as our target price. CLH is expected to report earnings on 2/21.
| 22 | 23 | ||||||||||||||||||||||||||||||||||||||||||||||||||||
| 130.00 | X | 130.00 | |||||||||||||||||||||||||||||||||||||||||||||||||||
| 128.00 | X | 128.00 | |||||||||||||||||||||||||||||||||||||||||||||||||||
| 126.00 | X | 126.00 | |||||||||||||||||||||||||||||||||||||||||||||||||||
| 124.00 | X | X | X | X | 124.00 | ||||||||||||||||||||||||||||||||||||||||||||||||
| 122.00 | X | O | X | O | X | X | C | O | X | X | 122.00 | ||||||||||||||||||||||||||||||||||||||||||
| 120.00 | X | O | X | O | X | O | X | O | X | O | X | O | X | 120.00 | |||||||||||||||||||||||||||||||||||||||
| 118.00 | X | O | X | O | X | X | O | X | X | O | X | O | X | O | 1 | 118.00 | |||||||||||||||||||||||||||||||||||||
| 116.00 | • | • | X | 9 | O | X | O | X | B | X | O | X | O | O | O | X | Mid | 116.00 | |||||||||||||||||||||||||||||||||||
| 114.00 | • | 4 | • | X | O | A | O | X | O | X | O | X | O | X | 114.00 | ||||||||||||||||||||||||||||||||||||||
| 112.00 | • | X | O | • | X | O | X | O | X | O | O | O | X | 112.00 | |||||||||||||||||||||||||||||||||||||||
| 110.00 | X | • | X | O | • | X | O | X | O | O | 110.00 | ||||||||||||||||||||||||||||||||||||||||||
| 108.00 | X | O | • | X | O | • | X | O | 108.00 | ||||||||||||||||||||||||||||||||||||||||||||
| 106.00 | X | O | • | X | O | • | X | 106.00 | |||||||||||||||||||||||||||||||||||||||||||||
| 104.00 | O | • | • | X | O | • | X | 104.00 | |||||||||||||||||||||||||||||||||||||||||||||
| 102.00 | O | X | • | • | X | • | X | 5 | • | X | 102.00 | ||||||||||||||||||||||||||||||||||||||||||
| 100.00 | C | X | O | X | X | X | • | X | O | • | X | O | X | • | X | • | Bot | 100.00 | |||||||||||||||||||||||||||||||||||
| 99.00 | O | X | O | X | O | X | O | X | O | • | X | O | • | X | O | X | O | • | 8 | • | 99.00 | ||||||||||||||||||||||||||||||||
| 98.00 | O | X | O | X | O | X | O | X | O | • | X | X | O | X | X | O | X | O | • | X | • | 98.00 | |||||||||||||||||||||||||||||||
| 97.00 | O | O | • | O | X | 1 | X | O | • | X | O | X | X | O | X | O | X | O | X | O | • | X | • | 97.00 | |||||||||||||||||||||||||||||
| 96.00 | • | O | X | O | X | O | • | X | O | X | O | X | O | X | O | X | O | X | O | X | • | 96.00 | |||||||||||||||||||||||||||||||
| 95.00 | • | O | X | O | O | X | O | X | O | X | O | X | 3 | X | O | X | O | X | • | 95.00 | |||||||||||||||||||||||||||||||||
| 94.00 | • | O | X | O | X | X | X | O | O | X | O | X | O | O | 6 | O | X | • | 94.00 | ||||||||||||||||||||||||||||||||||
| 93.00 | • | O | X | O | X | O | 2 | O | X | O | • | O | X | O | X | O | X | • | 93.00 | ||||||||||||||||||||||||||||||||||
| 92.00 | O | X | O | X | O | X | O | X | • | • | O | X | O | X | X | O | X | • | 92.00 | ||||||||||||||||||||||||||||||||||
| 91.00 | O | O | X | O | X | O | • | O | X | • | O | X | O | X | X | O | X | • | 91.00 | ||||||||||||||||||||||||||||||||||
| 90.00 | O | O | X | • | O | X | • | O | X | O | X | O | X | O | X | X | • | 90.00 | |||||||||||||||||||||||||||||||||||
| 89.00 | O | X | • | O | • | O | X | O | X | O | X | O | 7 | O | X | X | • | 89.00 | |||||||||||||||||||||||||||||||||||
| 88.00 | O | • | • | O | X | O | O | O | X | O | X | O | X | • | 88.00 | ||||||||||||||||||||||||||||||||||||||
| 87.00 | • | O | X | O | X | O | X | O | X | • | 87.00 | ||||||||||||||||||||||||||||||||||||||||||
| 86.00 | O | O | X | O | O | X | • | 86.00 | |||||||||||||||||||||||||||||||||||||||||||||
| 85.00 | O | X | O | X | • | 85.00 | |||||||||||||||||||||||||||||||||||||||||||||||
| 84.00 | O | X | O | • | 84.00 | ||||||||||||||||||||||||||||||||||||||||||||||||
| 83.00 | O | X | • | 83.00 | |||||||||||||||||||||||||||||||||||||||||||||||||
| 82.00 | O | 82.00 | |||||||||||||||||||||||||||||||||||||||||||||||||||
| 22 | 23 |

| APTV Aptiv PLC ($112.50) - Autos and Parts - APTV broke a double top at $112 for a fourth consecutive buy signal. This brings the 5 for 5'er just below its November rally high and a move to $116 would clear resistance at $114 and bring the chart to levels not seen since April of last year. Support lies at $104 and $99. |
| CAT Caterpillar, Inc. ($264.54) - Machinery and Tools - CAT posted a second consecutive double top buy signal with today's action at $264 to reach new all-time highs. While encouraging, this 4/5'er sits in heavily overbought territory with a weekly OBOS reading of 78%. The recent reversal does provide localized support at $248. |
| CDNS Cadence Design Systems, Inc. ($185.03) - Software - CDNS rose Friday to break a double top at $186, marking a second consecutive buy signal. This 4 for 5'er moved to a positive trend in November and ranks in the top third of the favored software sector RS matrix. The technical picture is favorable, however, the stock is now in overbought territory so those looking to add exposure would be best served by waiting for a pullback or normalization in the trading band. Initial support is seen at $178. Note that earnings are expected on 2/13. |
| CHD Church & Dwight Company ($79.71) - Household Goods - CHD broke a double bottom at $79 on Friday, resulting in a second consecutive sell signal. The 0 for 5'er ranks in the bottom half of the household goods stock sector matrix and recently failed to breakout into a positive trend. Supply is in control. More substantial support is offered down around $71. |
| DOCU DocuSign, Inc. ($59.25) - Software - DOCU moved higher Friday to break a double top at $60. THis 4 for 5'er moved back to a positive trend last week and ranks in the top decile of the favored software sector RS matrix. The weight of the evidence is positive and improving. Initial support is seen at $55 and $54. Overhead resistance may be found at $61. |
| FANG Diamondback Energy Inc ($151.24) - Oil - FANG gave a third consecutive buy signal and returned to a positive trend on Friday when it broke a double top at $152. The positive trend change will promote FANG to a 3 for 5'er. The stock now sits against resistance at $152, while support can be found at $144. Earnings are expected on 2/21. |
| LW Lamb Weston Holdings Inc ($98.53) - Food Beverages/Soap - Shares of LW reversed up into Xs on Friday, initiating a shakeout pattern. The 5 for 5'er ranks second out of 75 names in the food beverages/soap stock sector matrix and has traded in a positive trend since April of 2022. The weight of the evidence is positive here. Initial support is now offered at $96. |
| MGPI MGP Ingredients, Inc. ($91.94) - Food Beverages/Soap - MGPI shares printed a third consecutive sell signal on Friday at $94 with a spread triple bottom break. The 2 for 5'er now looks toward substantial support offered at $90. No new exposure here, as the weight of the technical evidence is negative. Note earnings are expected on 2/22. |
| SAIA Saia, Inc. ($272.75) - Transports/Non Air - SAIA posted a second consecutive double-top buy signal with today's action at $268 before rising as far at $276 intraday. This brings this 4/5'er up to resistance dating back to March of 2022. While SAIA now sits in heavily overbought territory, consider this a good buy on pullback opportunity. Support is seen $252. |
| SCHW The Charles Schwab Corporation ($75.23) - Wall Street - SCHW shares moved lower today to break a quadruple bottom at $75 to mark its first sell signal. This 5 for 5'er has been in a positive trend since October and on an RS buy signal versus the market since January 2021. SCHW shares are trading near the middle of their trading band with a weekly overbought/oversold reading of 29%. From here, support is offered at $66. |
| UPS United Parcel Service, Inc. ($182.00) - Aerospace Airline - UPS broke a double top at $182 to return to a buy signal and flip the trend back to positive. This action comes after the stock tested support at $172 and the trend flip with increase the technical attribute to a 4 for 5'er. Weekly momentum is positive and the stock maintains a yield north of 3%. Resistance lies at current levels as well as in the $188 to $190 range. Support lies at $172. |
| VC Visteon Corp. ($152.13) - Autos and Parts - VC reversed into Xs and broke a double top at $152, completing a bullish catapult pattern. The 5 for 5'er has cleared near-term resistance at $150 and matched the November rally high on the chart. VC is actionable at current levels and a move to $154 would be a new high for the stock. Support for the stock lies at $142 and $140, the bullish support line. |
| W Wayfair Inc. ($62.69) - Retailing - W reversed back into Xs and broke a double top at $61 for a third buy signal. The move comes after a recent trend flip and market and peer RS buy signals which improved the stock up to a 5 for 5'er. W is highly overbought at current levels and it would be best served to monitor the stock for potential chart normalization. Support lies at $51 and $39. |
| Name | Option Symbol | Action | Stop Loss |
|---|---|---|---|
| Shell PLC Sponsored ADR - $58.69 | O: 23D57.50D21 | Buy the April 57.50 calls at 3.30 | 54.00 |
| Name | Option | Action |
|---|---|---|
| Starbucks Corporation ( SBUX) | Mar. 100.00 Calls | Raise the option stop loss to 9.15 (CP: 11.15) |
| Analog Devices, Inc. ( ADI) | Mar. 165.00 Calls | Initiate an option stop loss of 9.40 (CP: 11.40) |
| Valero Energy Corp ( VLO) | Jun. 130.00 Calls | Stopped at 23.30 (CP: 21.25) |
| Name | Option Symbol | Action | Stop Loss |
|---|---|---|---|
| Marvell Technology Inc. - $44.39 | O: 23Q45.00D19 | Buy the May 45.00 puts at 4.75 | 48.00 |
| Name | Option | Action |
|---|---|---|
|
|
||
| Name | Option Sym. | Call to Sell | Call Price | Investment for 500 Shares | Annual Called Rtn. | Annual Static Rtn. | Downside Protection |
|---|---|---|---|---|---|---|---|
| Synchrony Financial $36.55 | O: 23E38.00D19 | May. 38.00 | 2.25 | $17,641.95 | 21.66% | 17.14% | 5.00% |
| Name | Action |
|---|---|
| United States Steel Corporation (X) - 29.26 | Sell the April 27.00 Calls. |
| D.R. Horton, Inc. (DHI) - 96.81 | Sell the May 97.50 Calls. |
| Freeport-McMoRan Inc. (FCX) - 45.45 | Sell the May 44.00 Calls. |
| Marathon Oil Corporation (MRO) - 28.76 | Sell the April 28.00 Calls. |
| Apache Corporation (APA) - 45.36 | Sell the April 47.50 Calls. |
| Cleveland-Cliffs Inc. (CLF) - 21.28 | Sell the April 20.00 Calls. |
| Alcoa Inc. (AA) - 52.11 | Sell the April 55.00 Calls. |
| United Airlines Holdings Inc. (UAL) - 49.45 | Sell the June 55.00 Calls. |
| Royal Caribbean Cruises Ltd. (RCL) - 63.93 | Sell the June 75.00 Calls. |
| On Semiconductor Corp. (ON) - 73.68 | Sell the April 70.00 Calls. |
| American Airlines Group Inc. (AAL) - 16.61 | Sell the May 17.00 Calls. |
| Las Vegas Sands Corp. (LVS) - 58.37 | Sell the June 60.00 Calls. |
| MGM Resorts International (MGM) - 40.91 | Sell the June 43.00 Calls. |
| Name | Covered Write |
|---|---|
| Capital One Financial Corporation ( COF - 116.07 ) | June 120.00 covered write. |
Daily Equity & Market Analysis
Loading, Please Wait...
