The coronavirus-induced equity market rebound is still outpacing the 1982 and 2009 recoveries.
2021 Market Outlook Webinar: The team at Nasdaq Dorsey Wright (NDW) will discuss the outlook for H1 2021 through a technical lens. Leave your emotions behind and join us for an objective look at the markets. Register Here
Topics We Will Cover:
- A review of current market conditions and indicators
- What the current market state could mean for the new year
- Sector opportunities, risks and early movers
- Asset class outlook and allocation considerations
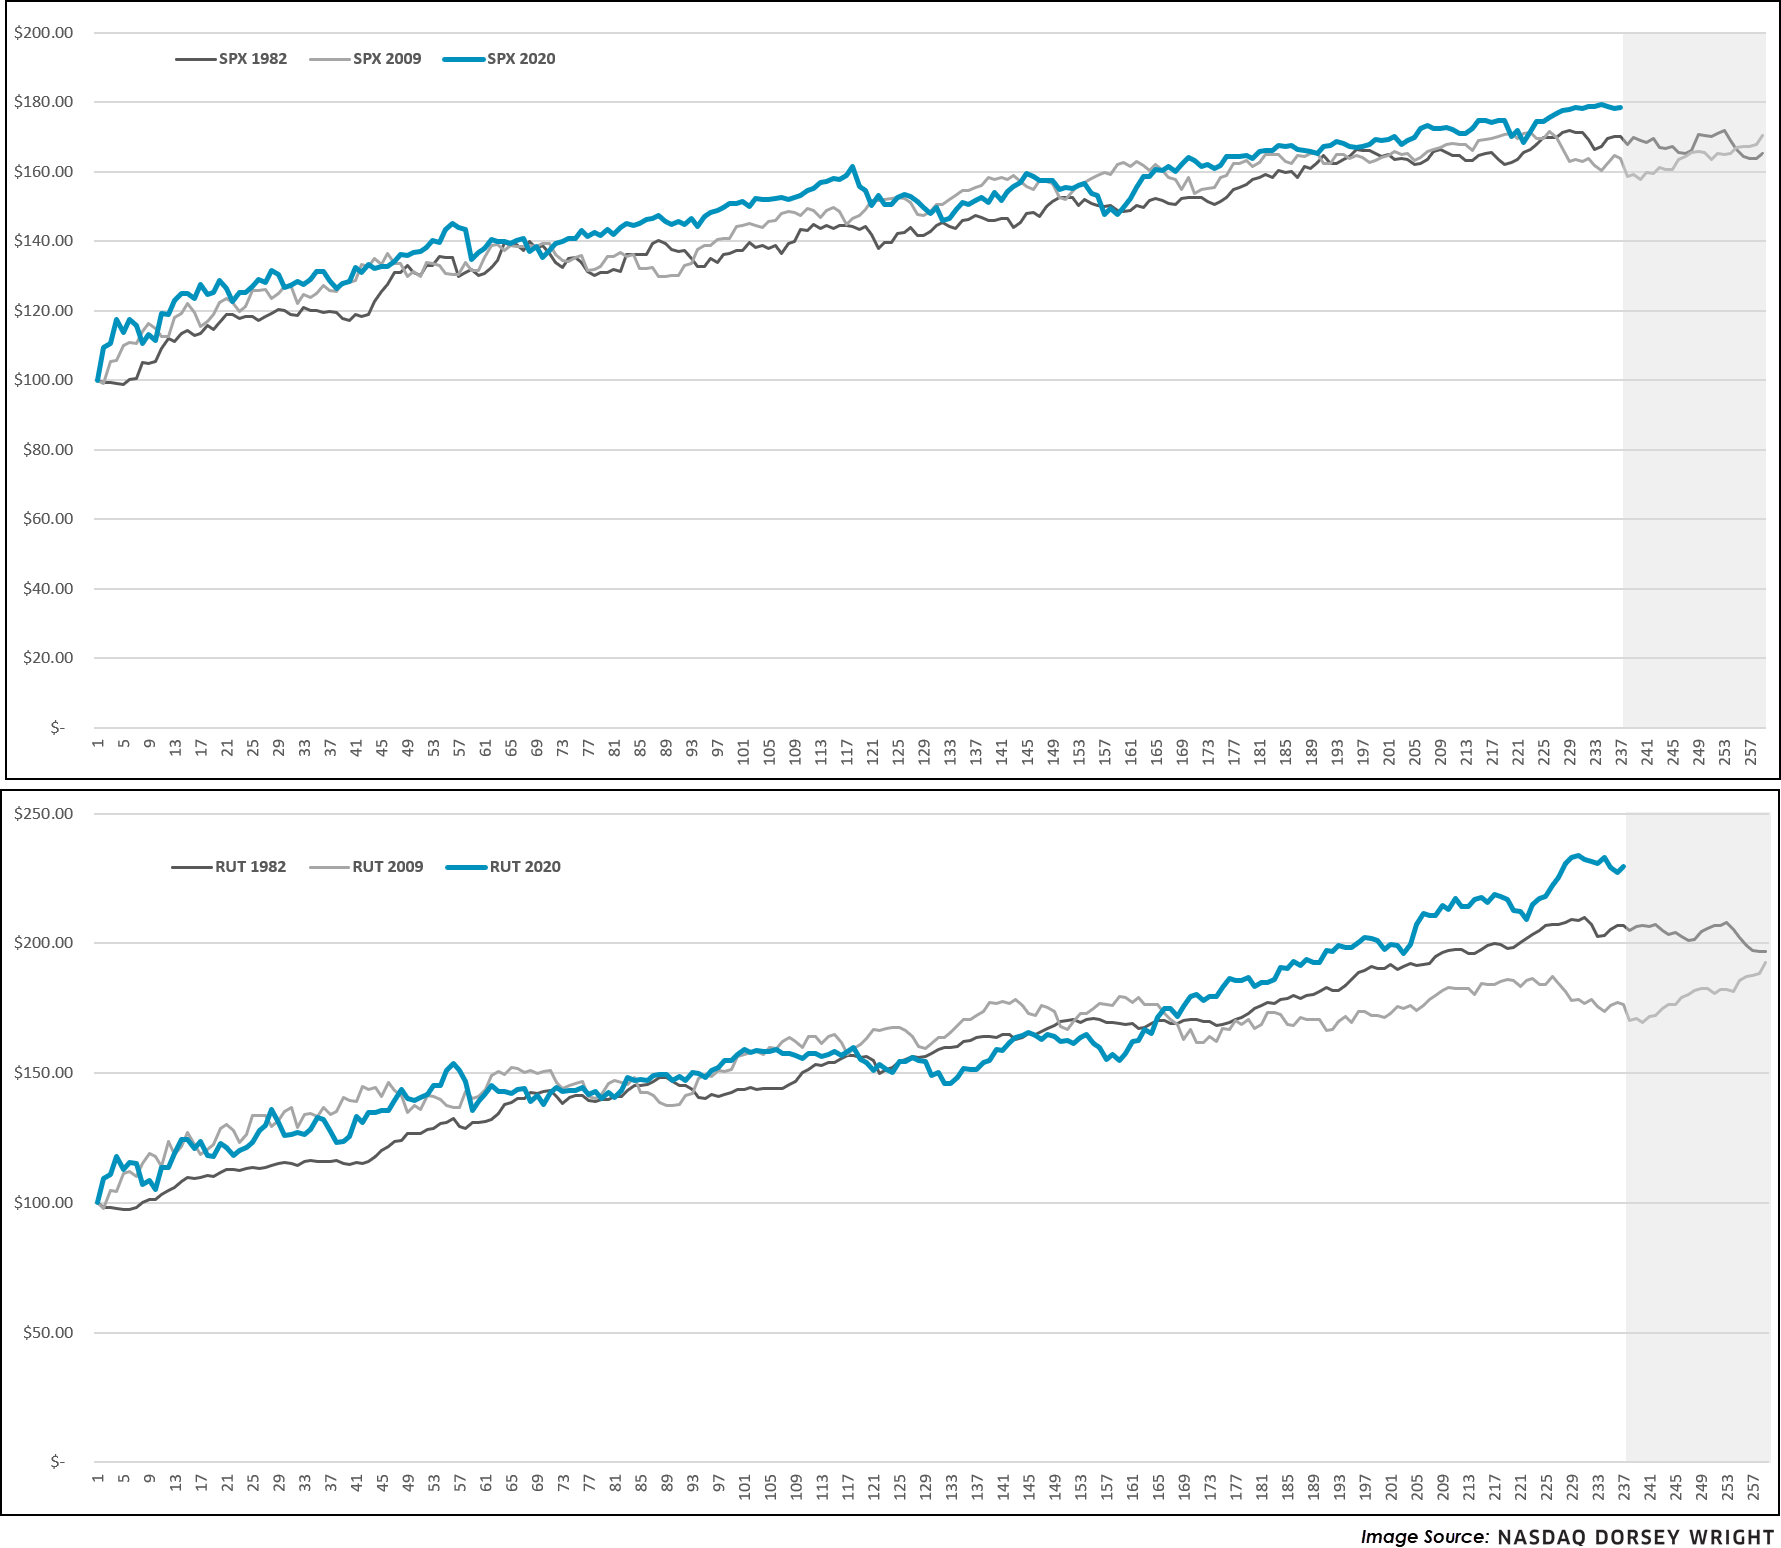
The S&P 500 fell in its fifth straight trading session on Monday (2/22), extending a muted period of returns for the popular benchmark. Although equities and other risk on asset classes remain in the driver seat, questions of market tiredness are near, and perhaps justifiably so after a historic 70% plus run from the S&P 500, 100% plus gain from the Nasdaq Composite, and 125% plus return from the Russell 2000 following the market bottom in March of last year (3/23/2020 – 2/19/2021). Recency bias in the markets can play a large role in today’s climate, so to add some further perspective on the monster returns we’ve seen it can be useful to compare historic market rebounds. Depicted below are hypothetical growth charts of $100 should someone have picked the bottom in each market, and interestingly enough, around this time (roughly 230 trading days after the bottom) both markets consolidated and traded laterally. We note a similar trend with small caps, to an even greater degree at times, but in aggregate the 2020 rebound is still considerably ahead of historic market runs. While history is most certainly not always a predictor of the future, it tell us that the current consolidation or a future pullback could be very normal, even healthy perhaps. Our indicators remain in offensive position, suggesting material pullbacks could serve as viable buying opportunities for those with extra cash on the sidelines.