
Most Requested Symbols

We examine how close the VIX’s estimate of volatility has been to realized volatility over various time periods.
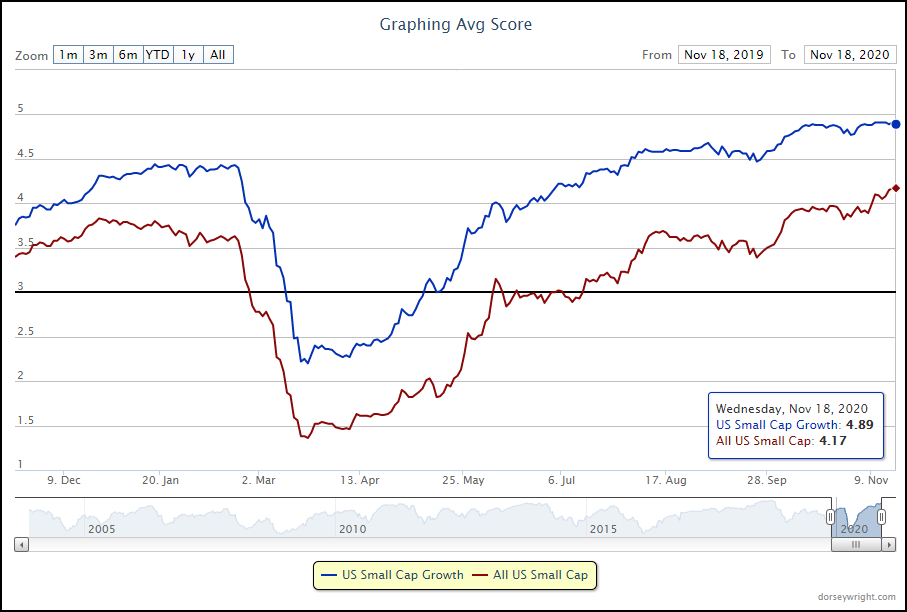
With US small cap growth now taking the top ranking on the Asset Class Group Scores page, we review the recent movement of the space through the Invesco DWA SmallCap Momentum ETF (DWAS) representative.
Today's featured stock is TG Therapeutics, Inc. (TGTX)
DHI, FND, MELI, SCVL, NEM, LNG, CDAY, & SPSC.
Call: Fiserv (FISV), Put: CF Industries (CF), Covered Write: The TJX Companies (TJX)
Beginners Series Webinar: Join us on Friday, November 20th, at 2 PM (ET) for our NDW Beginners Series Webinar. This week's topic is Utilizing the Models Page. Register Here.
We are excited to announce phase three of the Nasdaq Dorsey Wright Model Builder with the launch of Matrix and FSM-based Relative Strength (RS) Testing Service. As part of this launch, we are granting you free access to the Service for the remainder of 2020. The tool is designed to help you more easily design, test, implement, and monitor custom models powered by the Nasdaq Dorsey Wright methodology. Through the end of December, be sure to join us each Thursday at 1 pm EST for a custom modeler demo presented by the analyst team.
11/12/2020: Matrix Model Builder Demo Replay- Click here
11/5/2020: FSM Model Builder Demo Replay – Click here
Click here to register for future Nasdaq Dorsey Wright Model Builder Demos
As discussed in recent reports, a market pushing to new highs is not always suggestive of pending doom and gloom. For example, over the past five days we’ve seen very few stocks hit 52-week lows, an average of about four (daily average) to be exact, highlighting the breadth of the recent rally. To add some color behind this observation, we looked at the rolling five day average number of stocks hitting lows on the NYSE and calculated forward equity market performance from each of the dates where this average reading was below 4. As shown below, this historically suggested good things to come as 84% of the returns were positive on a one month basis and 100% of returns were positive over one year.

We also checked up on the Implied Momentum Bellcurve found under Asset Allocation > Distribution Curves. Using implied volatility for stocks based on their option premiums, we place each stock in a zone that essentially signifies overextension to the upside (Zone 6) or downside (Zone 1). We then compute an “average level” (located at the top of the curve) that gives us a numeric data point to represent the skew of the curve. The curve is updated daily and can provide a timely, visual feel for the market in the near-term – skewed right suggesting overbought and vice versa. For a deeper refresher on what this curve means or how it’s calculated, click here.
We looked at the daily average level going back to 2009 and distributed the readings below. We typically see this curve reside around the 3.6 – 4.2 level yet the most recent (11/18) average level is 4.68 for all stocks tracked on our platform, signifying a moderate skew to the right. The curve does not stay at levels like this often, as readings north of 4.5 only account for about 4% of the total observations; however, forward returns for the major indices in mention are also positive on a longer-dated (one month plus) horizon. Although, when at extended levels (4.5+) we could expect moderate underperformance relative to the index averages in the near-term (one – two week horizon).


Over the last several weeks, the CBOE S&P 500 Volatility Index VIX has dropped from above 40 during the final week of October to its current level of around 23, signaling that the level of expected volatility has dropped significantly.
The VIX calculates the implied volatility of near-term S&P 500 SPX options based on their market values to arrive at an expected level of volatility for the index over the subsequent 30 days, which is expressed as an annualized figure. For example, if the current level of the VIX is 40 the expected level of annualized volatility over the next 30 days is 40%. While the VIX calculation is based on observable market data, it is forward-looking, and therefore it is only an estimate of future volatility. If the SPX options used in the VIX calculation are mispriced, then it would be reasonable to expect that the VIX would not accurately estimate realized volatility. Given the large recent decline in the VIX, we were curious how close the VIX’s estimate of volatility has been to realized volatility over various time periods.
In order to analyze this, we compared the daily level of the VIX since the beginning of 2004 (prior to this time the VIX was calculated using a different methodology) to the realized volatility of the S&P 500 SPX over four subsequent time periods – one week (five trading days), one month (21 trading days), two months (42 trading days) and three months (63 trading days). The table below shows the annualized realized volatility of daily returns for each of these four intervals subtracted from the closing value of the VIX the day before the period began. For example, the first VIX value in our study was from 1/2/2004, which we compared to the annualized realized daily volatility of SPX over the subsequent five trading days to arrive at our first “VIX – 1WK” value. We then did the same for the next daily VIX value and averaged the results by year (the yearly classification is based on the date of the VIX reading).

Our results show that, on average, the VIX’s expected volatility overestimated realized volatility over every interval – one week, one month, two months, and three months. However, it also revealed something else interesting, in 2008 and 2020, two incredibly volatile years for the market, on average, the VIX underestimated realized volatility over most time periods. One practical implication of this may be that many investors are buying options at the wrong time. Volatility is one of the primary determinants of options prices, thus when expected volatility (and the VIX) are high, options are expensive and as a result many investors are hesitant to buy options during these periods. Based on our results, however, it appears that during these highly-volatile periods the implied volatility of SPX options (which underlie the VIX calculation) was lower than the subsequent realized volatility and thus the options were relatively cheap compared to the level of the realized volatility.
Market action over the past few weeks has seen broader participation to the upside from many segments of the domestic equity market, especially those that lagged the large-cap growth-oriented market leadership throughout the first three quarters of 2020. Small cap equity names have been one such area of improvement, as we can see through the Asset Class Group Scores (ACGS) page on the NDW research platform. As a reminder, this page takes all the ETFs and mutual funds tracked on the NDW system and classifies them into at least one of 135 different groups. Within each of these groups, we then take the fund scores of each fund and average them together to get a score for the group as a whole, following the same hierarchy associated with the individual scoring system that ranges from 0 (worst) to 6 (best). Each of the 135 groups is then ranked by their average score to pinpoint market leadership using the absolute and relative strength characteristics employed by the fund score methodology.
The recent market movement has led the US small cap growth group into the top position out of all 135 groups on the ACGS system with an average score of 4.89, marking its highest score reading in over two years. Other small cap groups have shown improvement as well, with the all small cap group also scoring at multi-year highs of 4.17 through Wednesday. The broader small cap group moved north of the 4.00 threshold for the first time in two years on November 9 and has shown further strength since that time. However, small cap growth has shown more rapid score improvement this year, as it moved above an average score of 4.00 in mid-June of this year and has also continued to march steadily higher. Although the broader small cap group has shown a greater score spike over the last few days, the small cap growth group has shown more consistent strength since moving off its score low in March.
The technical superiority of growth-oriented small cap names over the broad size representatives can also be seen on the individual fund level by comparing the Invesco DWA SmallCap Momentum ETF DWAS and the broader iShares Russell 2000 ETF IWM. DWAS seeks to track the Dorsey Wright Small Cap Technical Leaders Index, which looks to invest in the strongest 200 domestic small cap names. This fund comes in at a recent score posting of 5.46 through Wednesday, sitting over a full point higher than the still favorable 4.26 score of IWM. DWAS also shows a positive score direction of 3.15, indicative of its rapid technical improvement over the past few months. IWM is still a technically sound name with a favorable fund score, however, we have seen its one-year trailing total return of 12.74% fall short of the 27.59% total return of DWAS over the same time frame (through 11/18).
In order to dig deeper into this outperformance from the momentum representative, we have run a performance attribution analysis report on the underlying holdings of DWAS against those of IWM. This report shows that DWAS is significantly overweight healthcare at almost 37% of the portfolio, more than doubling the weighting of any other single sector. IWM also has a higher allocation to healthcare than any other single sector, but only arrives at a weighting of 20%. The momentum screen used by DWAS allowed for the overweighting of the healthcare sector, which accounted for about 21% of the 27% gain the fund has returned over the past year.


Average Level
34.62
| AGG | iShares US Core Bond ETF |
| USO | United States Oil Fund |
| DIA | SPDR Dow Jones Industrial Average ETF |
| DVY | iShares Dow Jones Select Dividend Index ETF |
| DX/Y | NYCE U.S.Dollar Index Spot |
| EFA | iShares MSCI EAFE ETF |
| FXE | Invesco CurrencyShares Euro Trust |
| GLD | SPDR Gold Trust |
| GSG | iShares S&P GSCI Commodity-Indexed Trust |
| HYG | iShares iBoxx $ High Yield Corporate Bond ETF |
| ICF | iShares Cohen & Steers Realty ETF |
| IEF | iShares Barclays 7-10 Yr. Tres. Bond ETF |
| LQD | iShares iBoxx $ Investment Grade Corp. Bond ETF |
| IJH | iShares S&P 400 MidCap Index Fund |
| ONEQ | Fidelity Nasdaq Composite Index Track |
| QQQ | Invesco QQQ Trust |
| RSP | Invesco S&P 500 Equal Weight ETF |
| IWM | iShares Russell 2000 Index ETF |
| SHY | iShares Barclays 1-3 Year Tres. Bond ETF |
| IJR | iShares S&P 600 SmallCap Index Fund |
| SPY | SPDR S&P 500 Index ETF Trust |
| TLT | iShares Barclays 20+ Year Treasury Bond ETF |
| GCC | WisdomTree Continuous Commodity Index Fund |
| VOOG | Vanguard S&P 500 Growth ETF |
| VOOV | Vanguard S&P 500 Value ETF |
| EEM | iShares MSCI Emerging Markets ETF |
| XLG | Invesco S&P 500 Top 50 ETF |
| Symbol | Company | Sector | Current Price | Action Price | Target | Stop | Notes |
|---|---|---|---|---|---|---|---|
| TTC | The Toro Company | Machinery and Tools | $88.01 | low to high 80s | 126 | 70 | 4 for 5'er, consec buy signals, LT market and peer RS buy signal, 1.22% yield Earnings 12/16 |
| FIVE | Five Below Inc | Household Goods | $152.90 | hi 130s - hi 140s | 149 | 120 | 5 for 5'er, top 25% of favored HOUS sector matrix, triple top breakout, potential covered write, Earn. 12/2 |
| BMCH | BMC Stock Holdings Inc. | Building | $47.11 | mid to upper 40s | 61 | 37 | 5 for 5'er, pos trend, pos mon mom, LT market RS buy, 7 consec buy signals, ATH, top of fav DWABUIL matrix |
| CMI | Cummins Inc. | Machinery and Tools | $233.46 | 216 - 236 | 304 | 188 | 5 for 5'er, pullback from ATH, consec buy signals, pos trend, top 1/3 of favored machinery & tools sector matrix. 2.36% yield |
| SGMS | Scientific Games Corporation | Gaming | $35.72 | low-to-mid 30s | 62 | 29 | 5 for 5'er, top third of GAME sector matrix, spread triple top, pullback from multi-year high, R-R>4.0 |
| LL | Lumber Liquidators Holdings Inc | Building | $26.81 | mid to upper 20s | 47 | 21 | 4 for 5'er, pos trend, 7 consec buy signals, pullback from multi-year high |
| BLMN | Bloomin' Brands Inc | Restaurants | $16.96 | 15 - 17 | 21 | 13.50 | 4 for 5'er, favored REST sector, triple top breakout, pullback to middle of trading band, pot. cov. write |
| ACN | Accenture PLC | Business Products | $239.73 | 230s - 240s | 216 | 208 | 5 for 5'er, top 1/2 of BUSI sector matrix, LT pos RS, spread triple top, 1.5% yield Earnings 12/17 |
| SAIL | SailPoint Technologies Holdings, Inc. | Software | $42.94 | mid 40s | $66 | $35 | 5 for 5'er, pullback from ATH, consec buy signals, pos trend |
| LPX | Louisiana-Pacific Corporation | Forest Prods/Paper | $33.31 | low 30s | 45.50 | 27 | 4 for 5'er, top third of FORE sector matrix, bullish triangle, pos wkly mom flip, 1.8% yield |
| TGTX | TG Therapeutics, Inc. | Biomedics/Genetics | $29.98 | upper 20s to mid 30s | 45.50 | 25 | 5 for 5'er, bullish triangle pattern, consec buy signals, testing multi-year high, pos trend |
| Symbol | Company | Sector | Current Price | Action Price | Target | Stop | Notes |
|---|
| Comment |
|---|
| CREE Cree Research Inc R ($77.66) - Semiconductors - Raise stop to $62, the bullish support line. |
| DVA DaVita, Inc. R ($106.34) - Healthcare - Raise stop to $84, the first sell signal on the chart. |
| Z Zillow Group Inc. Class C R ($109.06) - Real Estate - Raise stop to $86. |
| PVH Phillips-Van Heusen Corporation R ($77.09) - Textiles/Apparel - Raise stop to $61, the bullish support line. |
| TTC The Toro Company R ($88.39) - Machinery and Tools - Okay to add new exposure here, raise stop to $73. |
TGTX TG Therapeutics, Inc. R ($29.85) - Biomedics/Genetics - TGTX is a perfect 5 for 5’er within the biomedics/genetics sector that ranks in the top third of the sector stock matrix, making it one of the stronger names in this space. TGTX completed a bullish triangle pattern with last week’s market action at $30 before moving higher to $31 on Wednesday. As a result, TGTX is now testing its multi-year high and would mark a new multi-year high with a move to $32. TGTX has given three consecutive buy signals, confirming that demand is in control. Okay to add new exposure in the high 20s to low 30s. We will set our initial stop at $25 and will use the stock’s bullish price objective of $45.50 as our near-term price target.
| 19 | 20 | ||||||||||||||||||||||||||||||||||||||||||||||||||||
| 31.00 | X | X | 31.00 | ||||||||||||||||||||||||||||||||||||||||||||||||||
| 30.00 | X | O | X | 30.00 | |||||||||||||||||||||||||||||||||||||||||||||||||
| 29.00 | X | O | X | X | 29.00 | ||||||||||||||||||||||||||||||||||||||||||||||||
| 28.00 | A | O | B | O | X | 28.00 | |||||||||||||||||||||||||||||||||||||||||||||||
| 27.00 | X | X | X | O | X | O | X | Mid | 27.00 | ||||||||||||||||||||||||||||||||||||||||||||
| 26.00 | 9 | O | X | O | X | O | X | O | 26.00 | ||||||||||||||||||||||||||||||||||||||||||||
| 25.00 | X | O | X | O | X | O | 25.00 | ||||||||||||||||||||||||||||||||||||||||||||||
| 24.00 | X | X | O | X | O | X | 24.00 | ||||||||||||||||||||||||||||||||||||||||||||||
| 23.00 | X | O | X | O | O | 23.00 | |||||||||||||||||||||||||||||||||||||||||||||||
| 22.00 | X | X | O | X | 22.00 | ||||||||||||||||||||||||||||||||||||||||||||||||
| 21.00 | X | X | O | X | O | 8 | X | • | 21.00 | ||||||||||||||||||||||||||||||||||||||||||||
| 20.00 | X | O | X | O | X | 7 | O | X | O | X | • | 20.00 | |||||||||||||||||||||||||||||||||||||||||
| 19.50 | X | X | O | X | O | X | X | O | X | O | X | O | X | • | 19.50 | ||||||||||||||||||||||||||||||||||||||
| 19.00 | X | O | X | O | O | X | O | X | O | X | O | O | X | • | 19.00 | ||||||||||||||||||||||||||||||||||||||
| 18.50 | X | O | X | O | X | O | X | O | X | O | X | • | 18.50 | ||||||||||||||||||||||||||||||||||||||||
| 18.00 | X | O | 6 | X | O | X | O | O | • | Bot | 18.00 | ||||||||||||||||||||||||||||||||||||||||||
| 17.50 | X | O | O | X | • | 17.50 | |||||||||||||||||||||||||||||||||||||||||||||||
| 17.00 | X | X | O | • | 17.00 | ||||||||||||||||||||||||||||||||||||||||||||||||
| 16.50 | X | O | • | • | X | • | 16.50 | ||||||||||||||||||||||||||||||||||||||||||||||
| 16.00 | X | O | X | • | X | • | X | • | 16.00 | ||||||||||||||||||||||||||||||||||||||||||||
| 15.50 | 3 | O | X | O | • | X | O | • | X | • | 15.50 | ||||||||||||||||||||||||||||||||||||||||||
| 15.00 | X | O | X | X | O | • | 2 | O | • | X | • | 15.00 | |||||||||||||||||||||||||||||||||||||||||
| 14.50 | X | O | X | O | 6 | O | • | X | X | O | • | X | • | 14.50 | |||||||||||||||||||||||||||||||||||||||
| 14.00 | X | O | X | O | X | O | • | X | O | X | O | X | • | • | • | X | • | 14.00 | |||||||||||||||||||||||||||||||||||
| 13.50 | X | 4 | X | 5 | X | O | • | X | O | X | O | X | O | X | • | X | • | X | • | 13.50 | |||||||||||||||||||||||||||||||||
| 13.00 | X | O | O | X | O | • | X | O | O | 3 | O | X | O | X | O | X | • | 13.00 | |||||||||||||||||||||||||||||||||||
| 12.50 | X | O | X | 7 | 8 | • | X | O | X | O | X | O | X | O | X | • | 12.50 | ||||||||||||||||||||||||||||||||||||
| 12.00 | X | O | X | O | X | O | • | X | O | X | O | X | O | O | X | • | 12.00 | ||||||||||||||||||||||||||||||||||||
| 11.50 | X | O | • | O | X | O | • | 1 | O | O | X | X | 5 | X | • | 11.50 | |||||||||||||||||||||||||||||||||||||
| 11.00 | • | O | 9 | • | X | O | X | O | X | O | • | 11.00 | |||||||||||||||||||||||||||||||||||||||||
| 10.50 | • | O | X | O | X | O | X | • | 10.50 | ||||||||||||||||||||||||||||||||||||||||||||
| 10.00 | • | O | X | O | X | O | X | • | 10.00 | ||||||||||||||||||||||||||||||||||||||||||||
| 9.50 | • | O | X | O | X | O | X | • | 9.50 | ||||||||||||||||||||||||||||||||||||||||||||
| 9.00 | O | 4 | 7 | C | O | X | 4 | • | 9.00 | ||||||||||||||||||||||||||||||||||||||||||||
| 8.50 | O | X | O | X | O | X | O | X | • | 8.50 | |||||||||||||||||||||||||||||||||||||||||||
| 8.00 | O | X | O | 6 | O | X | O | X | • | 8.00 | |||||||||||||||||||||||||||||||||||||||||||
| 7.50 | O | X | O | X | O | B | O | X | • | 7.50 | |||||||||||||||||||||||||||||||||||||||||||
| 7.00 | O | 3 | 5 | X | 8 | X | • | O | X | • | 7.00 | ||||||||||||||||||||||||||||||||||||||||||
| 6.50 | O | X | O | O | X | • | O | • | 6.50 | ||||||||||||||||||||||||||||||||||||||||||||
| 6.00 | O | X | O | X | • | • | 6.00 | ||||||||||||||||||||||||||||||||||||||||||||||
| 5.50 | O | X | X | 9 | X | • | 5.50 | ||||||||||||||||||||||||||||||||||||||||||||||
| 5.00 | O | B | O | X | X | A | • | 5.00 | |||||||||||||||||||||||||||||||||||||||||||||
| 4.75 | A | X | O | X | O | 2 | • | 4.75 | |||||||||||||||||||||||||||||||||||||||||||||
| 4.50 | O | X | C | X | O | X | • | 4.50 | |||||||||||||||||||||||||||||||||||||||||||||
| 4.25 | O | O | 1 | O | X | • | 4.25 | ||||||||||||||||||||||||||||||||||||||||||||||
| 4.00 | O | X | O | • | 4.00 | ||||||||||||||||||||||||||||||||||||||||||||||||
| 3.75 | O | X | • | 3.75 | |||||||||||||||||||||||||||||||||||||||||||||||||
| 3.50 | O | • | 3.50 | ||||||||||||||||||||||||||||||||||||||||||||||||||
| 19 | 20 |

| CDAY Ceridian HCM Holding, Inc. ($97.35) - Software - CDAY moved higher Thursday to break a double top at $100, marking its third consecutive buy signal and a new all-time high. This 5 for 5'er moved to a positive trend in April and ranks in the top quartile of the software sector RS matrix. The stock has also been on an RS buy signal against the market since 2018. The technical picture remains strong here. Initial support is offered at $94 with further support found at $92 and $88, the current location of the bullish support line. |
| DHI D.R. Horton, Inc. ($74.93) - Building - DHI returned to a buy signal with a double top breakout at $76. This stock is a 3 for 5’er within the favored building sector. From here, support sits at $65 while overhead resistance lies at $81. |
| FND Floor & Decor Holdings Inc ($79.20) - Retailing - FND broke a double top at $79 on Thursday, returning the chart to a Point & Figure buy signal. FND is a 4 for 5’er within the favored retailing sector that has maintained a long-term market RS buy signal since August 2019. From here, support sits at $74 while FND faces resistance at $84. |
| LNG Cheniere Energy, Inc. ($55.09) - Oil - LNG gave a second consecutive buy signal in Thursday's trading after moving back to a positive trend in last week's trading. The technical picture for LNG has turned positive as it is a 4 for 5'er and ranks in the top half of the oil sector matrix. The stock now faces overhead resistance at $57, while support sits at $51. |
| MELI Mercadolibre, Inc. ($1,378.98) - Internet - MELI completed a bullish triangle pattern at 1360 before moving higher to 1376, marking the second consecutive buy signal. MELI is a 4 for 5’er that has maintained a long-term market RS buy signal since April 2016. From here, support sits at 1280 while resistance sits at 1488. |
| NEM Newmont Corp ($60.91) - Precious Metals - Gold was down once again in Thursday's trading and NEM printed an additional O on its default chart, a move which will put the stock in a negative overall trend and drop it to an unfavorable 2 for 5'er. From here, the next level of support sits at $59. Potential short sellers should note that NEM carries a 2.48% yield. |
| SCVL Shoe Carnival Inc ($36.15) - Retailing - SCVL broke a double top at $38, marking the second consecutive buy signal on the chart, confirming that demand is in control. SCVL is a 3 for 5’er within the favored retailing sector that has support available at $34. |
| SPSC SPS Commerce Inc ($95.13) - Software - SPSC pushed higher Thursday to break a triple top at $95, which also marked a new all-time high. This 5 for 5'er moved to a positive trend in April and ranks in the top quintile of names in the software sector RS matrix. The overall technical picture is sound here and continues to improve. Exposure may be considered at current levels, or on a pullback as the stock is entering overbought territory. Initial support can be found at $90, with further support offered at $88. |
| Name | Option Symbol | Action | Stop Loss |
|---|---|---|---|
| Fiserv, Inc. - $113.02 | FISV2119C105 | Buy the March 105.00 calls at 13.50 | 104.00 |
| Name | Option | Action |
|---|---|---|
| Builders FirstSource, Inc. ( BLDR) | Jan. 31.00 Calls | Raise the option stop loss to 4.20 (CP: 6.20) |
| Freeport-McMoRan Inc. ( FCX) | Jan. 16.00 Calls | Raise the option stop loss to 3.25 (CP: 5.25) |
| L Brands Inc. ( LB) | Jan. 27.50 Calls | Initiate an option stop loss of 10.00 (CP: 12.00) |
| T-Mobile US Inc. ( TMUS) | Jan. 115.00 Calls | Raise the option stop loss to 13.45 (CP: 15.45) |
| Viacom CBS Inc. ( VIAC) | Jan. 26.00 Calls | Raise the option stop loss to 4.95 (CP: 6.95) |
| The Gap, Inc. ( GPS) | Jan. 20.00 Calls | Initiate an option stop loss of 3.15 (CP: 5.15) |
| Name | Option Symbol | Action | Stop Loss |
|---|---|---|---|
| CF Industries Holdings, Inc. - $32.15 | CF2119N35 | Buy the February 35.00 puts at 4.60 | 36.00 |
| Name | Option | Action |
|---|---|---|
|
|
||
| Name | Option Sym. | Call to Sell | Call Price | Investment for 500 Shares | Annual Called Rtn. | Annual Static Rtn. | Downside Protection |
|---|---|---|---|---|---|---|---|
| The TJX Companies, Inc. $62.28 | TJX2116D65 | Apr. 65.00 | 3.50 | $29,350.25 | 23.88% | 11.97% | 4.63% |
| Name | Action |
|---|---|
| The Chemours Company (CC) - 23.43 | Sell the January 23.00 Calls. |
| L Brands Inc. (LB) - 33.61 | Sell the January 35.00 Calls. |
| The Gap, Inc. (GPS) - 23.67 | Sell the January 23.00 Calls. |
| Synchrony Financial (SYF) - 30.08 | Sell the March 31.00 Calls. |
| Sysco Corporation (SYY) - 71.68 | Sell the February 75.00 Calls. |
| Truist Financial Corp (TFC) - 47.45 | Sell the March 50.00 Calls. |
| QUALCOMM Incorporated (QCOM) - 147.05 | Sell the March 150.00 Calls. |
| Name | Covered Write |
|---|---|
|
|
|
Daily Equity & Market Analysis
Loading, Please Wait...
