
Most Requested Symbols

We are now officially in the seasonally strong six-month period for the market, but that does not mean all sectors have historically been strong during this time. Today we look at which sectors have performed the best and worst during the seasonally strong period in the market.
Three of the FSM models saw an increase in international equity exposure after the seasonal quarter evaluation earlier this week.
Today's featured stock is Fifth Third Bancorp (FITB).
ACN, ADI, AMP, AMZN, AWK, BBIO, BBY, BLK, CLCT, EYE, LBRDA, MIDD, QRVO, SEAS, TXN & TXRH
Call: Johnson Controls International (JCI); Put: Gilead Sciences (GILD), Covered Write: Williams Companies (WMB).
Webinar Hosted by Advisor Perspectives - Investors Need Yield: A Distinct Nasdaq Approach for a Zero-Yield World.
Meeting cash flow needs through distributions is becoming challenging with Treasury yields at rock bottom levels and investors enduring widespread dividend cuts this year. Trying to generate a meaningful yield often means unacceptable credit risk at a time when the bankruptcies are just starting to get announced following months of government-mandated shutdowns. For investors looking to fund their day-to-day lives, a better approach may be to focus on maximizing risk-adjusted returns and manufacturing a distribution to meet individual cash flow needs while managing risk and return. Target distribution strategies seek to leverage a modern portfolio theory approach focused on risk-adjusted returns to deliver steady cash flow to investors while maintaining the principal over the long-run. The webinar is scheduled for Thursday, November 12 @ 2pm EST.
Copy and paste the link below into your browser to register for the event:
event.on24.com/eventRegistration/EventLobbyServlet?target=reg20.jsp&referrer=&eventid=2800102&sessionid=1&key=F1823053F079D5EEA091B087B4A09B88®Tag=&sourcepage=register
Beginners Series Webinar: Join us on Friday, November 6th, at 2 PM (ET) for our NDW Beginners Series Webinar. This week's topic is Navigating a Point & Figure Chart Page.
Copy and paste the link below into your browser to register for the series:
nasdaq.zoom.us/webinar/register/7915519908388/WN_go_ZASGiSI6Qc5a7mmx7XA
The year 2020 is one for the books, no questions on that. However, many questions do remain about who the next President of the United States will be. As loudly conveyed the pollsters got it wrong this time, but the stock market still has a chance. In a year where precedent and normalcy seem to be long gone, we look to one of the last market adages for some guidance in the uncertain political climate.
Stock market returns leading up to a US Presidential Election historically produce a rather accurate signal of which party will win. If looking at the S&P 500 Index (S&P 90 prior to the election of 1960) price returns 91 days out from an election, we find that a positive/negative market return indicated the winning party 87% of the time, or 20 out of the 23 past elections. A negative return suggesting a change of party, while a positive return indicating the incumbent party being reelected. Since 1984, the indicator has been 100% accurate.
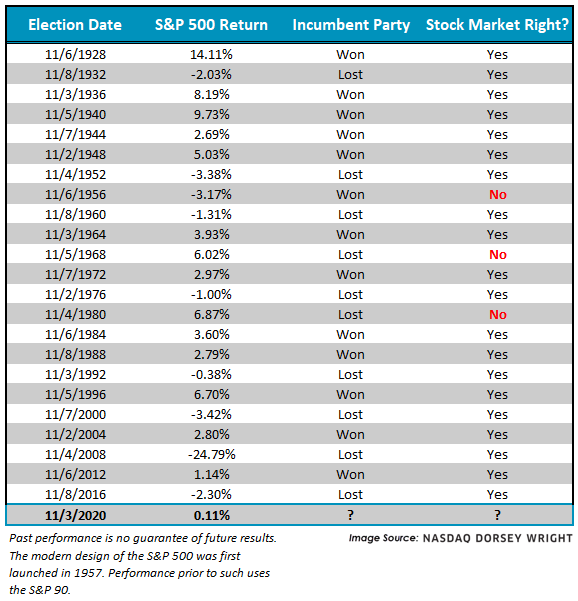
However, as displayed above, in 2020 we recorded the S&P 500 with a razor-thin return of 0.11% 91 days prior to the election, the smallest of gains in our study. As perhaps deduced, if the incumbent party is not reelected in 2020, this would mark the indicator’s first miss in over 35 years (about 9 elections).


As we have been discussing in the report for the last few days, we have officially entered the "seasonally strong" six-month period for the market and we have published a handful of articles around “market seasonality” and strategies that can be used to leverage this historical bias. Looking at the historical returns, there is no question that the November to May period, which we’ve just entered, has provided substantially better returns over time than the six month period from May through October. Whether you average it, annualize it, compound it, or complicate it further, there exists a wide performance spread between the average six-month returns of each holding period. We could hardly hope to explain this bias, much less the severity over time, but suffice it to say the "strong six-months" of the year have accounted for nearly all of the Dow's average annual compounded return since 1950. The average annualized return of the Dow during the seasonally strong six-months is close to 7%, while the "other" six months have produced an annualized return of less than one percent based upon an initial investment in 1950.
Those of you who have been following our research for any length of time know that sector rotation is a key aspect of many of our strategies. So, a natural extension of our market seasonality research is to examine how individual sectors are affected by the seasonality phenomenon. While we don't have the same longevity in terms of data for sectors as we do for broad market indices, we have observed performance biases within the past 20+ years, which we illustrate below using the 40 DWA equal-weighted sector indices.
Let's first look back at the six months ending October 30, 2020, during which the Dow Jones Industrial Average DJIA, posted a gain of 8.86% outperforming its median return of 5.88% during the seasonally strong period as well as the median return of 2.22% for the seasonally weak period. The best-performing sector was the gaming group DWAGAME, which was up a whopping 55.83%. Meanwhile, oil DWAOIL was the worst-performing sector, down -17.20%, which comes on the heels of seasonally strong period (Nov ’19 through April ’20) during which it was down more than 45%. .
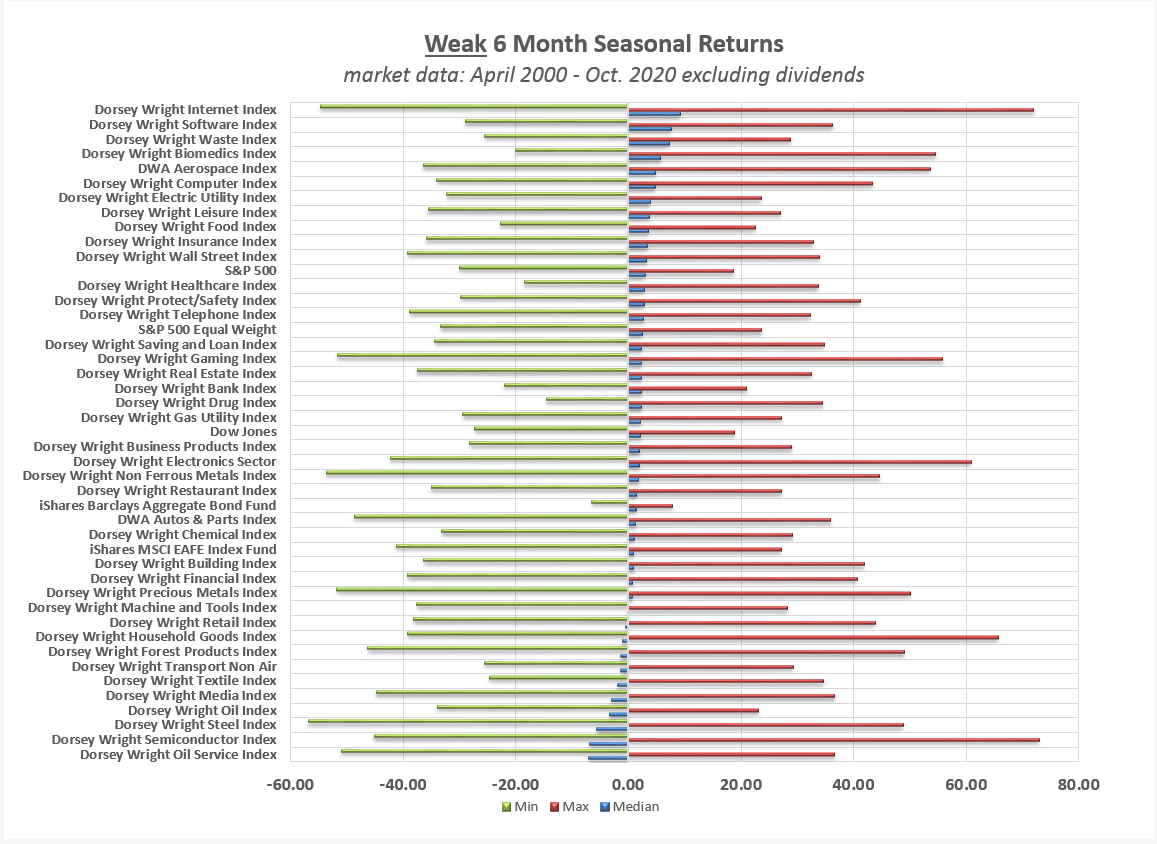
This graphic above utilizes our inventory of 40 DWA equal-weighted sector indices, which have been "live" for the duration of our study period (most have been published since 1998), as well as a handful of benchmarks tracking equity and bond markets. Combined with a second image below, the study includes market data from April 28, 2000, through October 30, 2020, tracking the returns of each index within the seasonal ranges defined by traditional studies (the weak period spans May 1 through October 31, while strong periods span November 1 through April 30 of the following year). The results are illustrated through graphs sorted by the "median" return of each index during each seasonal side of the study period, as well as the "min" and "max" return periods.
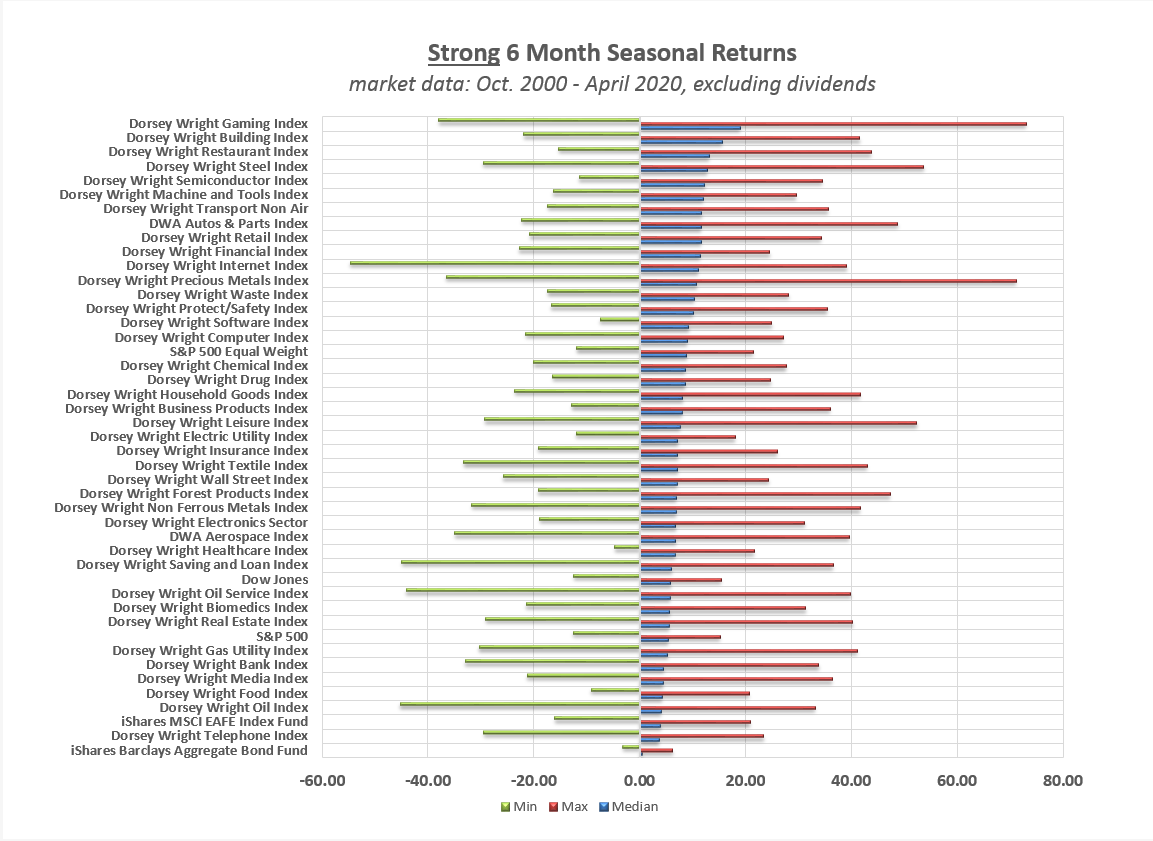
In terms of median return, oil index ranks at or near the bottom in both the seasonally strong and weak periods, which is at least partially attributable to the dismal run that energy companies have had over the last few years. Steel DWASTEE and semiconductors DWASEMI, are near the top of the pack during the strong period, however, both rank in the bottom three during the weak six-month period.
The overriding observation is that the seasonal bias of market returns is not limited to cap-weighted indices such as the S&P 500 Index SPX or blue-chip indices such as the Dow Jones Industrial Average DJIA All 40 DWA groups have positive median returns in the seasonally strong six months of the year during our study period, which now includes three significant bear markets. As shown below, many sectors tend to experience losses during the seasonally weak six months of the year, with semiconductors, steel, and oil services producing the worst median returns over the study period. In contrast, the internet, software, and waste sectors have historically produced the best median returns of the 40 sectors during the seasonally weak period.
The beginning of this week brought about the market seasonality shift, as we have covered throughout the Daily Equity Report over the past few days. This shift occurs as we enter the “seasonally strong” market period, which begins in November and runs through April. The “seasonally weak” period for domestic equity markets begins in May and runs through October, giving us the market adage of “sell in May and go away.” While we have a variety of models that focus on changing allocation at these two points specifically, the market seasonality shift also brings about evaluations to the Fund Score Method (FSM) models that are evaluated at each seasonal quarter, taking place at the beginning of February, May, August, and November. Note that the FSM models are only available to users that subscribe to the Enhanced Security Selection (ESS) package. In order to take a free trial of the ESS package, please reach out to our sales team at (212) 312 - 0333.
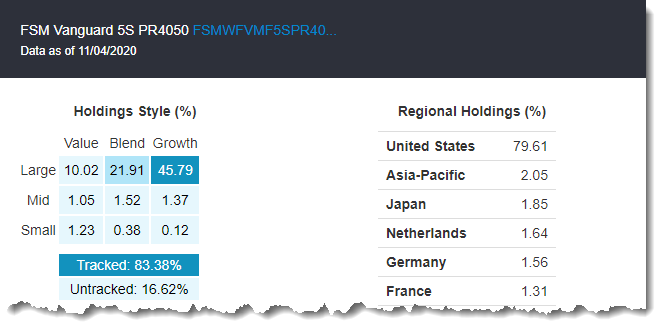
These latest evaluations saw trades in many of the models, as the continued upside we have seen from domestic equity markets over the past few months led to higher scores from risk-on areas in the model inventories. Today, we will review recent additions to the FSM American Funds 5S PR4050, FSM Vanguard 5S PR4050, and FSM T Rowe Price 5S PR4050 models in light of the recent evaluations.
The American Funds 5S and Vanguard 5S models each sold their last bond fund that remained from the COVID-induced market volatility, making each model fully focused on equity exposure. Interestingly enough, we saw the American Funds model purchase the American Funds Europacific Growth fund AEPGX, as the next highest scoring fund that the model did not already own. This is the first time the American Funds lineup has had an international specific fund included as a model holding since February of 2018.
The Vanguard model saw the Vanguard Diversified Equity fund VDEQX move in as a model holding, rounding out the other equity growth-focused funds that were already included in the model holdings. This model had already purchased a foreign equity fund in the Vanguard International Growth fund VWIGX at the last evaluation in August, giving it a similar makeup to the American Funds lineup from a broad perspective through an overweight toward domestic growth with international inclusion. Another notable point is that the typically more risk-averse American Funds actually has a higher allocation to international equity areas with the other model holdings.

The largest change of the three models we will examine today came in the FSM T Rowe Price 5S PR4050 model, which saw three new funds added to the model holdings. This included the T Rowe Price Japan fund PRJPX, T Rowe Price Global Technology fund PRGTX, and the T Rowe Price Science & Tech. fund PRSCX. Each of the five funds now held in the model has at least partial exposure toward international equities. This leaves the model with about even exposure between US equities and non-US equities, which have allocations of 45% and 43%, respectively.
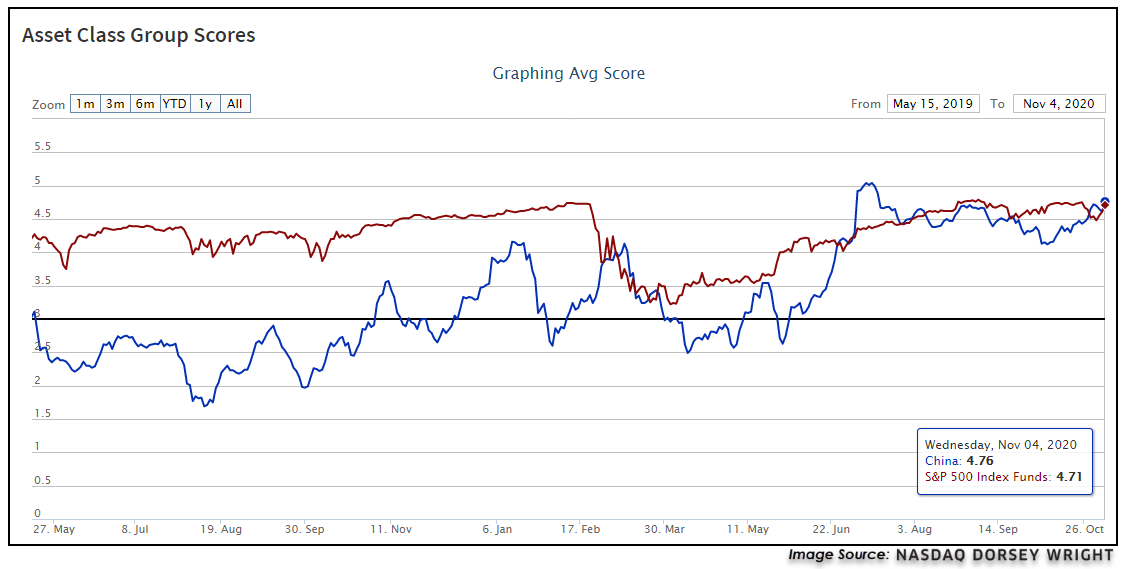
While the influx of international equity into these FSM models may seem surprising, a closer look at the Asset Class Group Scores rankings may help these moves make more sense. In looking at the US & non-US view filters together, we can see that the top end of the rankings still has more domestic representatives than international, but the international camp has improved drastically over the past few months. China, the largest single country represented across most emerging market-specific and international growth funds, recently overtook the S&P 500 Index Funds group, our core equity market representative, with a group score of 4.76 compared to 4.71. Although both of these groups have maintained relatively high score positions since June of this year, the China group has been unable to hold a higher position than the core US group for more than a few days at a time. This relationship will certainly be worth monitoring for further improvement from the leader among international equity markets.

Average Level
4.23
| AGG | iShares US Core Bond ETF |
| USO | United States Oil Fund |
| DIA | SPDR Dow Jones Industrial Average ETF |
| DVY | iShares Dow Jones Select Dividend Index ETF |
| DX/Y | NYCE U.S.Dollar Index Spot |
| EFA | iShares MSCI EAFE ETF |
| FXE | Invesco CurrencyShares Euro Trust |
| GLD | SPDR Gold Trust |
| GSG | iShares S&P GSCI Commodity-Indexed Trust |
| HYG | iShares iBoxx $ High Yield Corporate Bond ETF |
| ICF | iShares Cohen & Steers Realty ETF |
| IEF | iShares Barclays 7-10 Yr. Tres. Bond ETF |
| LQD | iShares iBoxx $ Investment Grade Corp. Bond ETF |
| IJH | iShares S&P 400 MidCap Index Fund |
| ONEQ | Fidelity Nasdaq Composite Index Track |
| QQQ | Invesco QQQ Trust |
| RSP | Invesco S&P 500 Equal Weight ETF |
| IWM | iShares Russell 2000 Index ETF |
| SHY | iShares Barclays 1-3 Year Tres. Bond ETF |
| IJR | iShares S&P 600 SmallCap Index Fund |
| SPY | SPDR S&P 500 Index ETF Trust |
| TLT | iShares Barclays 20+ Year Treasury Bond ETF |
| GCC | WisdomTree Continuous Commodity Index Fund |
| VOOG | Vanguard S&P 500 Growth ETF |
| VOOV | Vanguard S&P 500 Value ETF |
| EEM | iShares MSCI Emerging Markets ETF |
| XLG | Invesco S&P 500 Top 50 ETF |
| Symbol | Company | Sector | Current Price | Action Price | Target | Stop | Notes |
|---|---|---|---|---|---|---|---|
| LOW | Lowe's Companies, Inc. | Building | $168.22 | 170s to low 180s | 230 | 150 | 5 for 5'er, top half of favored BUI sector matrix, quad top breakout, pos wkly mom flip, LT pos mkt RS, 1.4% yield Earnings 11/18 |
| AVGO | Broadcom Ltd | Semiconductors | $364.63 | 360s - 380s | 468 | 300 | 4 for 5'er, top 20% of SEMI sector matrix, triple top breakout, 3.5% yield |
| APH | Amphenol Corporation | Electronics | $115.92 | mid 100s to upper 110s | 152 | 93 | 5 for 5'er, all-time high, LT market & peer RS buy signal, 2 weeks pos weekly mom |
| AN | Autonation Inc. | Autos and Parts | $58.76 | hi 50s - low 60s | 100 | 50 | 5 for 5'er, top 10% of favored AUTO sector matrix, pullback from ATH, pot cov. write R-R>3.0 |
| SCHN | Schnitzer Steel Industries | Steel/Iron | $19.59 | 19 - 21 | 32.50 | 16.50 | 3 for 5'er, top half of favored STEE sector matrix, bullish catapult, 3.7% yield, R-R>3.0 |
| RCII | Rent-A-Center, Inc. | Retailing | $31.21 | low to mid 30s | 65 | 24 | 5 for 5'er, 5 consec buy signals, LT peer RS buy, pos weekly & mon momentum, 3.59% yield |
| TTC | The Toro Company | Machinery and Tools | $84.24 | low to high 80s | 126 | 70 | 4 for 5'er, consec buy signals, LT market and peer RS buy signal, 1.22% yield |
| FIVE | Five Below Inc | Household Goods | $141.59 | hi 130s - hi 140s | 149 | 120 | 5 for 5'er, top 25% of favored HOUS sector matrix, triple top breakout, potential covered write, Earn. 12/2 |
| FITB | Fifth Third Bancorp | Banks | $23.10 | low-to-mid 20s | 29 | 19 | 5 for 5'er, top 10% of BANK sector matrix, bullish triangle, 4,4% yield, potential cov'd wrtie |
| Symbol | Company | Sector | Current Price | Action Price | Target | Stop | Notes |
|---|
| Symbol | Company | Sector | Current Price | Action Price | Target | Stop | Notes |
|---|---|---|---|---|---|---|---|
| CDNS | Cadence Design Systems, Inc. | Software | $120.99 | upper $110s to low $120s | $159 | $90 | See follow up comment below. |
| R | Ryder System, Inc. | Transports/Non Air | $51.27 | hi 40s - low 50s | 63 | 40 | See follow up comment below. |
| Comment |
|---|
| KKR KKR & Co. L.P R ($37.89) - Finance - We will now raise our stop to $32, the second potential sell signal on KKR's default chart. |
| SNPS Synopsys Inc R ($238.80) - Software - We will now raise our stop to $190, the third potential sell signal on SNPS's default chart. |
| DECK Deckers Outdoor Corporation R ($280.10) - Textiles/Apparel - We will now raise our stop to $240, the second potential sell signal on DECK's default chart. |
| AMAT Applied Materials, Inc. R ($69.20) - Semiconductors - We will now raise our stop to $56, the first potential sell signal on the chart. |
| RPD Rapid7 Inc. R ($69.53) - Software - We will now raise our stop to $57, the second potential sell signal on RPD's default chart. |
| QCOM QUALCOMM Incorporated R ($146.16) - Semiconductors - We will now raise our stop to $120, the first potential sell signal on QCOM's default chart. |
| BLDR Builders FirstSource, Inc. R ($35.01) - Building - We will now raise our stop to $29, the first potential sell signal on BLDR's default chart. |
| ARNC Arconic Corp. R ($25.88) - Metals Non Ferrous - We will now raise our stop to $20, the first potential sell signal on ARNC's default chart. |
| BJ BJ's Wholesale Club Holdings Inc R ($42.64) - Retailing - We will now raise our stop to $37, the first potential sell signal on BJ's default chart. |
| CDNS Cadence Design Systems, Inc. R ($124.44) - Software - CDNS has moved above the ideal action range. OK to hold here. Raise stop to $104, the first potential sell signal on CDNS's default chart. |
| R Ryder System, Inc. ($52.76) - Transports/Non Air - R has moved above the ideal action range. OK to hold here. Raise stop to $42.50, the potential trend line violation on the $0.50 chart. |
FITB Fifth Third Bancorp R ($24.19) - Banks - FITB is a 5 for 5'er that ranks in the top decile of the banks sector matrix. On its default chart, FITB has given five consecutive buy signals, most recently completing a bullish triangle at $23. The stock also has good income potential as it comes with a 4.4% yield and offers a potential covered write opportunity on the Feb '21 call options. Long exposure may be added in the low-to-mid $20s and we will set our initial stop at $19, the first potential sell signal on FITB's default chart. We will use the bullish price objective, $29, as our target price.
| 12 | 13 | 14 | 15 | 16 | 17 | 18 | 19 | 20 | |||||||||||||||||||||||||||||||||||||||||||||
| 34.00 | 2 | 4 | 34.00 | ||||||||||||||||||||||||||||||||||||||||||||||||||
| 33.00 | X | O | X | O | 33.00 | ||||||||||||||||||||||||||||||||||||||||||||||||
| 32.00 | 1 | O | X | O | • | 32.00 | |||||||||||||||||||||||||||||||||||||||||||||||
| 31.00 | X | 3 | 5 | C | • | 31.00 | |||||||||||||||||||||||||||||||||||||||||||||||
| 30.00 | B | O | 7 | B | O | • | 30.00 | ||||||||||||||||||||||||||||||||||||||||||||||
| 29.00 | A | 6 | 3 | X | O | A | O | • | 29.00 | ||||||||||||||||||||||||||||||||||||||||||||
| 28.00 | 3 | 9 | 9 | B | X | O | 4 | O | 9 | 2 | • | 28.00 | |||||||||||||||||||||||||||||||||||||||||
| 27.00 | C | O | 7 | A | X | O | X | O | X | 8 | X | O | • | 27.00 | |||||||||||||||||||||||||||||||||||||||
| 26.00 | X | O | X | O | X | O | 1 | O | X | O | X | O | • | Top | 26.00 | ||||||||||||||||||||||||||||||||||||||
| 25.00 | X | O | X | O | C | X | O | O | O | • | 25.00 | ||||||||||||||||||||||||||||||||||||||||||
| 24.00 | X | 4 | O | X | • | O | • | X | X | 24.00 | |||||||||||||||||||||||||||||||||||||||||||
| 23.00 | X | B | O | • | 3 | • | X | O | X | 23.00 | |||||||||||||||||||||||||||||||||||||||||||
| 22.00 | 3 | O | • | A | • | O | • | 6 | O | X | A | Mid | 22.00 | ||||||||||||||||||||||||||||||||||||||||
| 21.00 | C | O | 6 | C | • | 9 | • | O | • | X | O | 8 | O | X | 21.00 | ||||||||||||||||||||||||||||||||||||||
| 20.00 | X | 5 | X | 4 | O | X | B | O | • | X | • | O | X | X | O | X | O | X | 20.00 | ||||||||||||||||||||||||||||||||||
| 19.50 | X | B | 8 | X | O | X | O | X | O | X | O | • | • | 8 | • | O | X | O | X | O | X | 9 | 19.50 | ||||||||||||||||||||||||||||||
| 19.00 | 7 | O | X | A | X | O | 2 | 8 | X | O | X | 1 | X | X | • | X | • | O | X | O | X | O | X | 19.00 | |||||||||||||||||||||||||||||
| 18.50 | X | O | X | O | X | 1 | X | O | 9 | O | X | O | X | O | X | • | O | X | 5 | X | O | X | 18.50 | ||||||||||||||||||||||||||||||
| 18.00 | X | 9 | X | O | O | X | O | 4 | O | X | O | 7 | • | O | X | X | X | O | X | 7 | X | Bot | 18.00 | ||||||||||||||||||||||||||||||
| 17.50 | 5 | A | O | • | O | X | 5 | 6 | X | • | O | X | O | X | X | O | X | O | X | O | 17.50 | ||||||||||||||||||||||||||||||||
| 17.00 | 4 | • | O | X | O | X | • | O | X | O | X | O | X | O | X | O | X | • | 17.00 | ||||||||||||||||||||||||||||||||||
| 16.50 | X | • | O | X | O | • | O | X | O | X | O | X | O | X | O | X | • | 16.50 | |||||||||||||||||||||||||||||||||||
| 16.00 | A | X | • | O | 3 | • | O | X | O | X | O | X | O | X | O | X | • | 16.00 | |||||||||||||||||||||||||||||||||||
| 15.50 | 9 | O | 1 | • | O | X | • | O | X | O | X | O | X | O | X | O | X | • | 15.50 | ||||||||||||||||||||||||||||||||||
| 15.00 | • | X | O | X | • | O | X | • | O | O | X | O | X | O | X | O | • | 15.00 | |||||||||||||||||||||||||||||||||||
| 14.50 | • | 3 | 8 | O | X | • | 2 | X | • | O | X | 4 | X | O | • | 14.50 | |||||||||||||||||||||||||||||||||||||
| 14.00 | X | O | 7 | B | • | O | • | O | X | O | X | • | 14.00 | ||||||||||||||||||||||||||||||||||||||||
| 13.50 | 1 | O | X | • | • | O | X | X | O | • | 13.50 | ||||||||||||||||||||||||||||||||||||||||||
| 13.00 | X | 6 | X | • | O | X | O | X | • | 13.00 | |||||||||||||||||||||||||||||||||||||||||||
| 12.50 | X | C | O | • | O | X | O | X | • | 12.50 | |||||||||||||||||||||||||||||||||||||||||||
| 12.00 | X | O | X | • | O | X | O | • | 12.00 | ||||||||||||||||||||||||||||||||||||||||||||
| 11.50 | A | O | X | • | O | • | • | 11.50 | |||||||||||||||||||||||||||||||||||||||||||||
| 11.00 | 9 | B | • | • | 11.00 | ||||||||||||||||||||||||||||||||||||||||||||||||
| 10.50 | X | • | 10.50 | ||||||||||||||||||||||||||||||||||||||||||||||||||
| 10.00 | X | • | 10.00 | ||||||||||||||||||||||||||||||||||||||||||||||||||
| 12 | 13 | 14 | 15 | 16 | 17 | 18 | 19 | 20 |

| ACN Accenture PLC ($233.99) - Business Products - Shares of ACN moved higher Thursday to break a double top at $236. This 5 for 5'er moved to a positive trend in November and has been on an RS buy signal against the market since late-2002. ACN also ranks in the top half of the business products sector RS matrix. Weekly momentum just flipped positive, suggesting the potential for further upside from here. Exposure may be considered at current levels, with initial support offered at $216 and further support found at $212. |
| ADI Analog Devices, Inc. ($130.40) - Semiconductors - ADI rose Thursday to break a spread quadruple top at $128 before continuing to $130 intraday, marking a new all-time high. This 3 for 5'er moved to a positive trend in April and has been on an RS buy signal against the market since 2016. The overall technical picture is strong, however, the recent price appreciation has left ADI in overbought territory so those looking to add exposure would be best served to wait for a pullback or normalization of the trading band. Initial support can be found at $116 with further support offered at $112. Earnings are expected on 11/24. |
| AMP Ameriprise Financial ($174.00) - Finance - AMP shares moved higher today to break a triple top at $174 and return to a buy signal. This 4 for 5'er has been in a positive trend since May and on an RS buy signal versus its peer group since 2010. AMP is actionable at current levels with a weekly overbought/oversold reading of 36%. From here, support can be found at $156. |
| AMZN Amazon.com Inc. ($3,353.72) - Internet - AMZN returned to a buy signal with today’s market action at $3328. AMZN is a solid 4 for 5’er within the internet sector that has been trading in a positive trend since January 2015. Weekly momentum just flipped positive, suggesting the potential for higher prices. From here, support sits at $2976. |
| AWK American Water Works Company, Inc. ($159.28) - Waste Management - AWK, the best performing stock so far this year in the Utilities Select Sector SPDR Fund XLC with a gain of 26%, broke a double top at $162 today and is now trading at new all-time highs. Today’s breakout marks the second consecutive on the chart, signaling follow through. AWK is trading in a positive trend and has maintained a long-term market RS buy signal since September 2011. From here, support sits at $150. |
| BBIO BridgeBio Pharma, Inc. ($41.63) - Biomedics/Genetics - BBIO shares moved higher today to break a double top at $42 to mark its third consecutive buy signal. This 5 for 5'er has been in a positive trend since April and on an RS buy signal versus the market since September. BBIO is actionable at current levels with a weekly overbought/oversold reading of 28%. From here, support can be found at $38 and $37. Note that earnings are expected on 11/9. |
| BBY Best Buy Co., Inc. ($123.13) - Retailing - BBY broke a double top at $124, marking the stock’s 11th consecutive buy signal as well as a new all-time high. This stock is a perfect 5 for 5’er within the favored retailing sector that has maintained a long-term market RS buy signal since November 2016 and a peer RS buy signal since August 2013. BBY is trading well above the bullish support line. Demand is in control. From here, support sits at $110. Note BBY yields 1.85% and expects earnings on 11/24. |
| BLK BlackRock, Inc. ($671.22) - Wall Street - BLK shares pushed higher today to break a double top at $672 to mark its second consecutive buy signal. This 5 for 5'er has been in a positive trend since April and on an RS buy signal versus the market since June of 2010. Recent price action has put BLK into heavily overbought territory, so those wishing to initiate a new long position may be best served to wait for a pullback or price normalization. From here, support can be found at $592. BLK offers a 2.31% yield. |
| CLCT Collectors Universe, Inc. ($72.26) - Retailing - CLCT broke a double top at $71 before moving higher to $73, marking the second consecutive buy signal on the chart. As a result, this stock is now trading at new all-time highs with all 5 attributes in its favor. Weekly momentum just flipped positive, as well. From here, support sits at $67. Note CLCT is trading in heavily overbought territory. |
| EYE National Vision Holdings, Inc. ($45.08) - Retailing - EYE broke a double top at $44 before moving higher to $45, putting the stock just one point from its all-time high of $46 reached in 2018. EYE is a strong 5 for 5’er that moved into a positive trend in May. Additionally, weekly momentum has been positive for three weeks, suggesting the potential for higher prices. From here, support sits at $40. |
| LBRDA Liberty Broadband Corp ($151.44) - Media - LBRDA returned to a buy signal at $152, which also marks a new all-time high for the media stock. LBRDA is a 3 for 5’er that has been trading in a positive trend since April. Monthly momentum just flipped positive, suggesting the potential for higher prices. From here, support sits at $134. |
| MIDD The Middleby Corporation ($120.27) - Household Goods - MIDD broke a spread triple top at $110 on Thursday before moving higher to $120, marking a new all-time high as well as the stock’s second consecutive buy signal. MIDD is a solid 3 for 5’er within the favored household goods sector that has experienced three weeks of positive weekly momentum. Demand is in control however MIDD is now trading above the top of its 10-week trading band, indicating that it is heavily overbought. From here, support sits at $98. |
| QRVO Qorvo Inc. ($146.69) - Semiconductors - Shares of QRVO continued higher Thursday after their earnings release to break a double top at $140 before rising over 9% intraday to $152, marking its highest level since 2000. This 5 for 5'er moved to a positive trend in April and ranks in the top third of the semiconductors sector RS matrix. Exposure may be considered at current levels, with initial support offered at $126 and further support at $124. |
| SEAS SeaWorld Entertainment, Inc. ($24.58) - Leisure - SEAS broke a double top at $25, marking the fifth consecutive buy signal on the chart. SEAS is a strong 5 for 5’er that is trading in a positive trend. Weekly momentum just flipped positive. Demand is in control. From here, support sits at $20. |
| TXN Texas Instruments Incorporated ($155.56) - Semiconductors - TXN continued higher Thursday to break a double top at $156, marking a new all-time high. This 3 for 5'er has been on an RS buy signal against the market since mid-2016 and moved back to a positive trend in May. TXN also sits in the top half of the semiconductors sector RS matrix. Those looking to add exposure may consider the stock at current levels, with initial support offered at $142. Further support can be found at $136. Note that TXN carries a 2.77% yield. |
| TXRH Texas Roadhouse, Inc. ($72.09) - Restaurants - TXRH returned to a buy signal with a double top breakout at $73. TXRH is a solid 4 for 5’er within the favored restaurants sector that moved into a positive trend in July. In addition, weekly momentum has been positive for four weeks while momentum has been positive for four months. From here, support sits at $69. Year-to-date, TXRH is up over 27% while the SPX is up 6.58%. |
| Name | Option Symbol | Action | Stop Loss |
|---|---|---|---|
| Johnson Controls International PLC - $43.48 | O: 21D43.00D16 | Buy the April 43.00 calls at 3.80 | 39.00 |
| Name | Option | Action |
|---|---|---|
| Hanesbrands, Inc. ( HBI) | Jan. 15.00 Calls | Stopped at 13.00 (CP: 13.31) |
| Builders FirstSource, Inc. ( BLDR) | Jan. 31.00 Calls | Initiate an option stop loss of 3.10 (CP: 5.10) |
| Abbott Laboratories ( ABT) | Jan. 100.00 Calls | Initiate an option stop loss of 12.70 (CP: 14.70) |
| JD.COM INC ( JD) | Mar. 80.00 Calls | Raise the option stop loss to 14.25 (CP: 16.25) |
| Applied Materials, Inc. ( AMAT) | Jan. 57.50 Calls | Raise the option stop loss to 11.20 (CP: 13.20) |
| Target Corporation ( TGT) | Jan. 145.00 Calls | Raise the option stop loss to 14.45 (CP: 16.45) |
| Name | Option Symbol | Action | Stop Loss |
|---|---|---|---|
| Gilead Sciences, Inc. - $59.63 | O: 21N60.00D19 | Buy the February 60.00 puts at 4.55 | 64.00 |
| Name | Option | Action |
|---|---|---|
| Capital One Financial Corporation (COF) | Jan. 80.00 Puts | Stopped at 75.00 (CP: 78.54) |
| Name | Option Sym. | Call to Sell | Call Price | Investment for 500 Shares | Annual Called Rtn. | Annual Static Rtn. | Downside Protection |
|---|---|---|---|---|---|---|---|
| Williams Companies Inc. $19.09 | O: 21B20.00D19 | Feb. 20.00 | 0.94 | $9,085.00 | 34.68% | 17.81% | 4.92% |
| Name | Action |
|---|---|
| The Chemours Company (CC) - 21.33 | Sell the January 23.00 Calls. |
| L Brands Inc. (LB) - 33.70 | Sell the January 35.00 Calls. |
| Phillips-Van Heusen Corporation (PVH) - 61.08 | Sell the January 65.00 Calls. |
| General Motors (GM) - 35.24 | Sell the January 37.00 Calls. |
| QUALCOMM Incorporated (QCOM) - 128.97 | Sell the January 130.00 Calls. |
| Big Lots, Inc. (BIG) - 48.60 | Sell the January 52.50 Calls. |
| The Gap, Inc. (GPS) - 20.93 | Sell the January 23.00 Calls. |
| Steel Dynamics Inc. (STLD) - 30.76 | Sell the February 32.00 Calls. |
| Ryder System, Inc. (R) - 51.27 | Sell the February 52.50 Calls. |
| Discover Financial Services (DFS) - 67.87 | Sell the January 70.00 Calls. |
| Newmont Corp (NEM) - 65.08 | Sell the March 70.00 Calls. |
| Name | Covered Write |
|---|---|
|
|
|
Daily Equity & Market Analysis
Loading, Please Wait...
