We are now officially in the seasonally strong six-month period for the market, but that does not mean all sectors have historically been strong during this time. Today we look at which sectors have performed the best and worst during the seasonally strong period in the market.
As we have been discussing in the report for the last few days, we have officially entered the "seasonally strong" six-month period for the market and we have published a handful of articles around “market seasonality” and strategies that can be used to leverage this historical bias. Looking at the historical returns, there is no question that the November to May period, which we’ve just entered, has provided substantially better returns over time than the six month period from May through October. Whether you average it, annualize it, compound it, or complicate it further, there exists a wide performance spread between the average six-month returns of each holding period. We could hardly hope to explain this bias, much less the severity over time, but suffice it to say the "strong six-months" of the year have accounted for nearly all of the Dow's average annual compounded return since 1950. The average annualized return of the Dow during the seasonally strong six-months is close to 7%, while the "other" six months have produced an annualized return of less than one percent based upon an initial investment in 1950.
Those of you who have been following our research for any length of time know that sector rotation is a key aspect of many of our strategies. So, a natural extension of our market seasonality research is to examine how individual sectors are affected by the seasonality phenomenon. While we don't have the same longevity in terms of data for sectors as we do for broad market indices, we have observed performance biases within the past 20+ years, which we illustrate below using the 40 DWA equal-weighted sector indices.
Let's first look back at the six months ending October 30, 2020, during which the Dow Jones Industrial Average DJIA, posted a gain of 8.86% outperforming its median return of 5.88% during the seasonally strong period as well as the median return of 2.22% for the seasonally weak period. The best-performing sector was the gaming group DWAGAME, which was up a whopping 55.83%. Meanwhile, oil DWAOIL was the worst-performing sector, down -17.20%, which comes on the heels of seasonally strong period (Nov ’19 through April ’20) during which it was down more than 45%. .
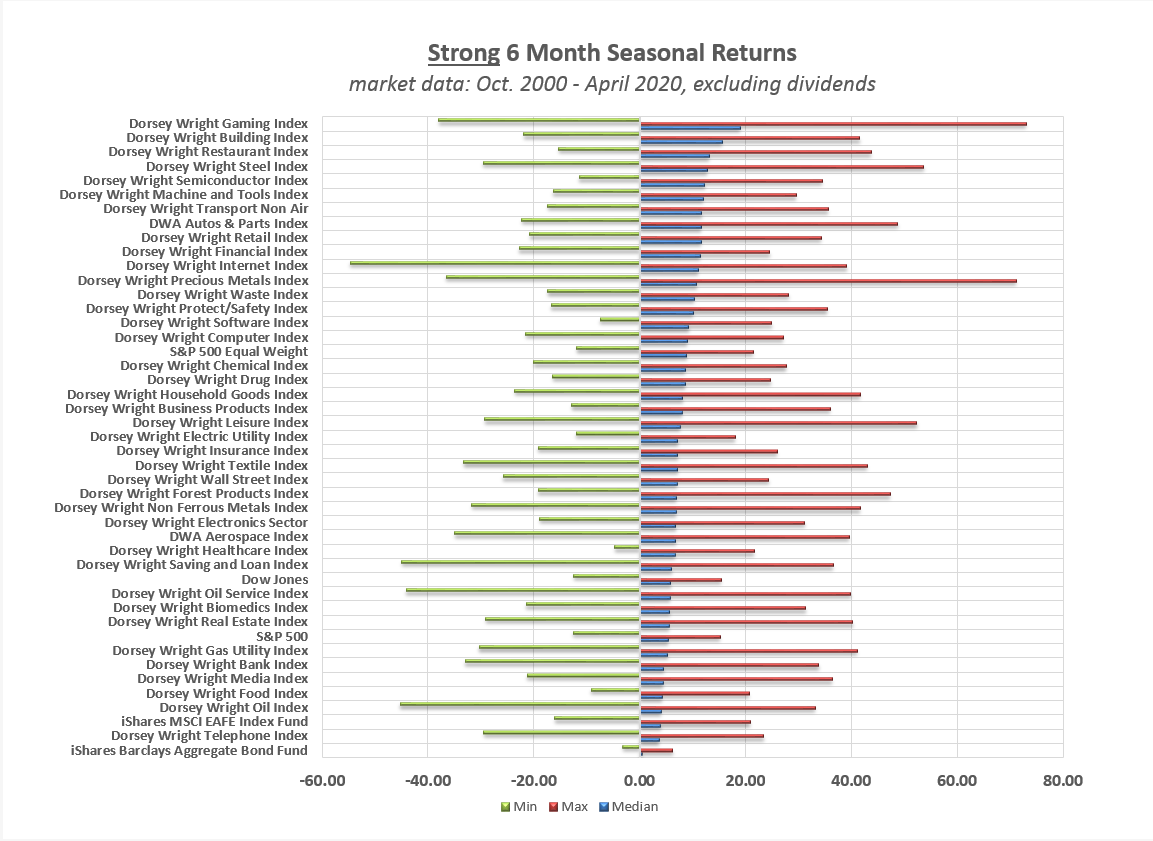
This graphic above utilizes our inventory of 40 DWA equal-weighted sector indices, which have been "live" for the duration of our study period (most have been published since 1998), as well as a handful of benchmarks tracking equity and bond markets. Combined with a second image below, the study includes market data from April 28, 2000, through October 30, 2020, tracking the returns of each index within the seasonal ranges defined by traditional studies (the weak period spans May 1 through October 31, while strong periods span November 1 through April 30 of the following year). The results are illustrated through graphs sorted by the "median" return of each index during each seasonal side of the study period, as well as the "min" and "max" return periods.
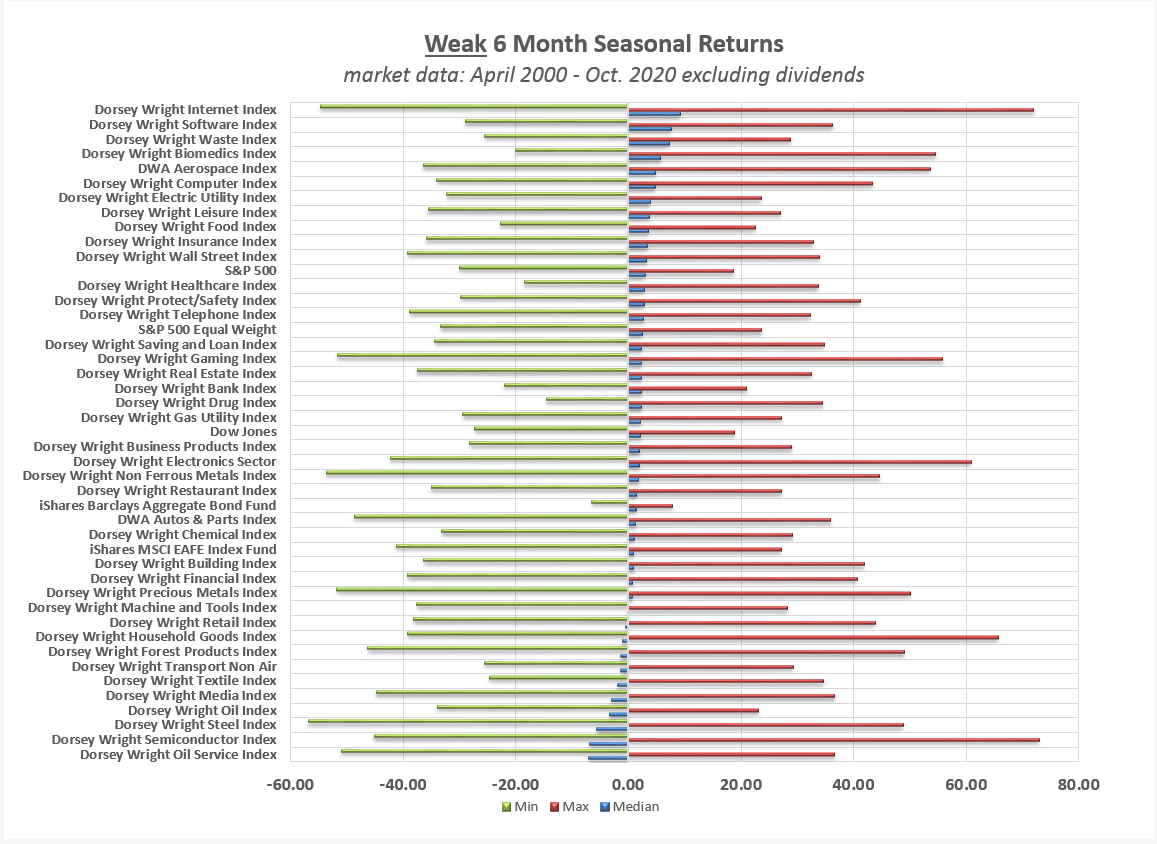
In terms of median return, oil index ranks at or near the bottom in both the seasonally strong and weak periods, which is at least partially attributable to the dismal run that energy companies have had over the last few years. Steel DWASTEE and semiconductors DWASEMI, are near the top of the pack during the strong period, however, both rank in the bottom three during the weak six-month period.
The overriding observation is that the seasonal bias of market returns is not limited to cap-weighted indices such as the S&P 500 Index SPX or blue-chip indices such as the Dow Jones Industrial Average DJIA All 40 DWA groups have positive median returns in the seasonally strong six months of the year during our study period, which now includes three significant bear markets. As shown below, many sectors tend to experience losses during the seasonally weak six months of the year, with semiconductors, steel, and oil services producing the worst median returns over the study period. In contrast, the internet, software, and waste sectors have historically produced the best median returns of the 40 sectors during the seasonally weak period.