
Most Requested Symbols

Today, we discuss the basics of Bitcoin ($BTC) and review a few ways to gain exposure to this alternative space. Additionally, we walk users through accessing crypto-asset trend charts on the NDW Research Platform.
Today's featured stock is Floor & Decor Holdings Inc (FND).
ANSS, BLK, DDS, FISV, FSLR, HD, PYPL & WRK.
Ca;;: Toll Brothers (TOL); Put: CIGNA Corporation (CI); Covered Write: VICI Properties (VICI).
Domestic equity markets have seen a further movement to the upside over the first few weeks of October, as shown by the 3.39% gain posted by the S&P 500 Index SPX from the end of September to market close last Friday (10/9). This improvement has also been reflected on many of the equity-focused indicators we track on the NDW platform, such as the bullish percent charts that reversed up at the beginning of the month. The continued strength has led to further follow through on some of the positive trend indicators, including the Percent Positive Trend for SPX ^PTSPX and MID ^PTMID, which each reversed back up into a column of Xs after the market close on Friday. As a refresher, these charts track the percentage of names in the S&P 500 and S&P MidCap 400, respectively, that are currently trading above their bullish support lines, or in an overall positive trend. The PTSPX chart saw a reversal down into Os in September from 78% down to 66%, before reversing back up after Friday to its current position at 72%. The PTMID chart saw a similar movement, falling to 58% before reversing back up to 64% after trading Friday. While each of these charts remained above the 50% line of demarcation in their recent decline, their movement back into Xs indicates speaks to the technical strength of the market from a longer-term perspective for the large- and mid-cap focused indices.

In order to determine how the PTSPX level corresponds to the total return of the S&P 500 Index TR.SPXX, we split up the chart into quartiles and ran performance comparisons on how the broad market index does when the chart is in Xs. Reversals up in this territory have tended to work out well for domestic equity investors, as a hypothetical backtest of those that invested in the S&P 500 each time it was in Xs while between 50 and 75% produced an annualized total return of 10.19%, just below the overall market average of 10.64%. The best performing quaritle was, perhaps unsurprisingly, those time periods when the chart was in Xs above 75%, which produced an average annualized gain of 11.68%. This also accounted for above 46% of the days examined, which demonstrates that the PTSPX indicator has been in elevated territory almost have of the time it is in Xs.


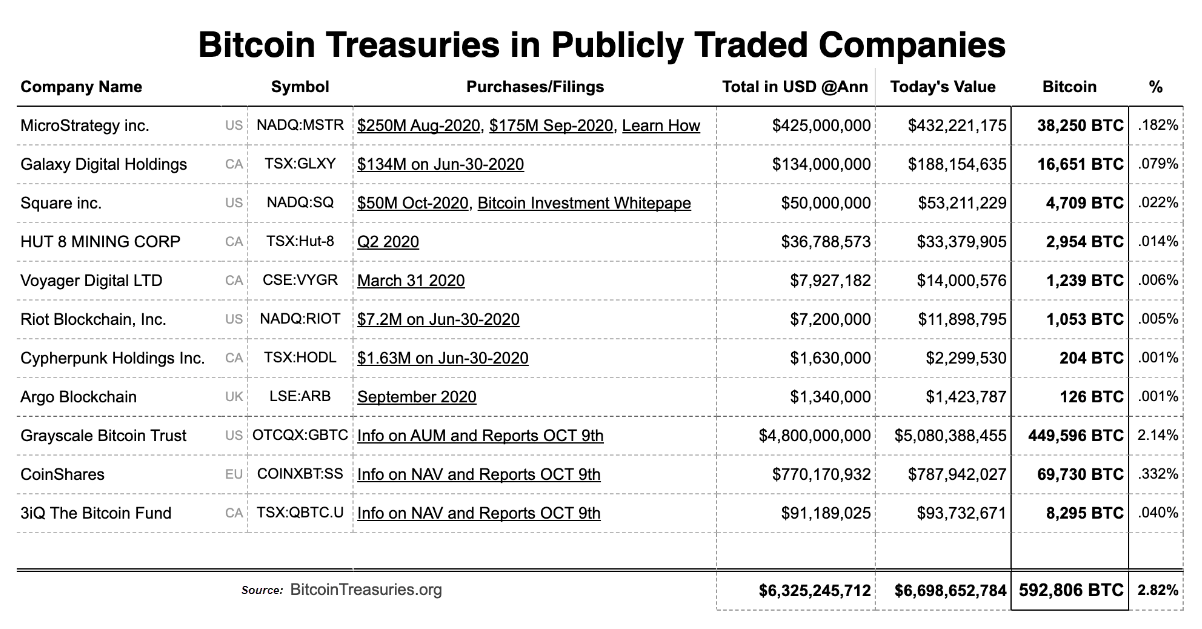
On October 8, Square SQ, the payments company helmed by Twitter CEO Jack Dorsey, announced that it purchased 4,709 bitcoins, a $50 million investment, representing 1% of the firm’s total asset. As a result, Square became the second technology firm to go long on bitcoin in recent months after MicroStrategy MSTR, a business intelligence firm, crowned the crypto as its treasury reserve asset of choice. SQ’s investment announcement not only injected fresh confidence into the crypto market but also caused $BTC to jump 2.5% in one day. As a result, $BTC finished the week up 6.6%, marking its strongest single week rise since the end of July. Due to the renewed interest we’ve seen in the crypto market and recent conversations we’ve had with advisors, today, we will discuss the basics of Bitcoin ($BTC). Additionally, we’ll review a few ways to gain exposure to this alternative space and walk users through accessing crypto-asset trend charts on the NDW Research Platform.
What is Bitcoin?
Launched in 2009, Bitcoin is the world's largest cryptocurrency by market cap which currently sits at around $200 billion. Per the Bitcoin Wiki, Bitcoin is a decentralized digital currency that enables instant payments to anyone, anywhere in the world. Bitcoin uses peer-to-peer technology to operate with no central authority: transaction management and money issuance are carried out collectively by the network. Bitcoin uses public-key cryptography, peer-to-peer networking, and proof-of-work to process and verify payments. Bitcoins are sent (or signed over) from one address to another with each user potentially having many, many addresses. Each payment transaction is broadcast to the network and included in the blockchain so that the included bitcoins cannot be spent twice. After an hour or two, each transaction is locked in time by the massive amount of processing power that continues to extend the blockchain. Using these techniques, Bitcoin provides a fast and extremely reliable payment network that anyone can use. For more information on bitcoin, be sure to visit www.bitcoin.org.
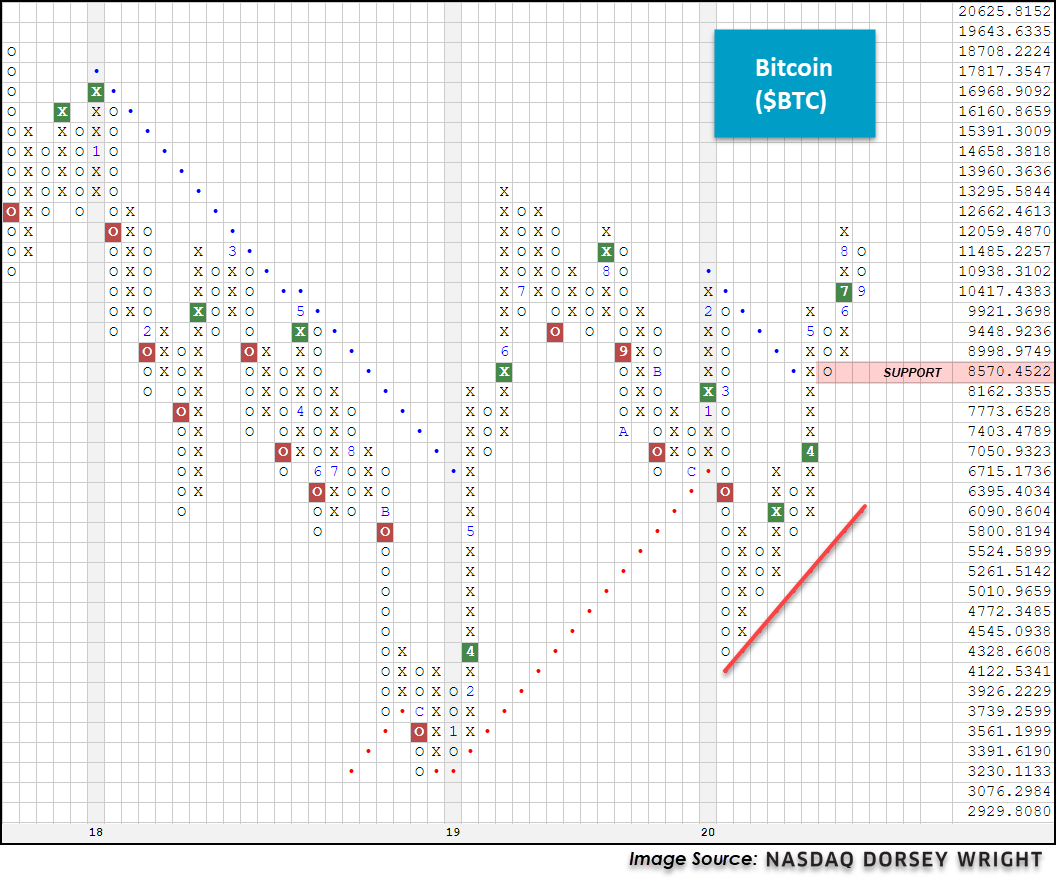
After a significant rally starting in 2015, the price of $BTC peaked at $19,643.63 in Q4 2017 before falling more than -84% to around $3,100 in December 2018. While $BTC remains below its high watermark, we have seen signs of technical improvement, undoubtedly aided by the recent investment announcement from SQ. Back in September, $BTC hit the $11,200 level, however, demand was unable to move the price any higher, triggering a four-day sell-off to $10,200. $BTC’s 6.6% rally over the last week enabled it to break through and close above resistance that had built up over the last month around the $11,000 level. Today, $BTC is trading around $11,500. Because of its strengthening correlation to the S&P 500 Index which has some in the industry calling $BTC the “Digital S&P” instead of “Digital Gold”, analysts suggest that macro-factors, such as the upcoming US election, stimulus talks, and the coronavirus pandemic, will play a strong role in determining the direction of $BTC from here. (Source: coinbase.com)
How can I invest in Bitcoin?
There are a few different ways to invest in $BTC at this time. Two of the options include purchasing $BTC on crypto trading platforms such as Coinbase, Robinhood, or Cash App SQ or by purchasing shares of the Grayscale Bitcoin Investment Trust GBTC. If you plan on purchasing $BTC outright, be sure to do your research and have a place to store them. This can be an online digital wallet attached to the account where you buy and sell, a program on your computer, or a physical device you plug into your computer. For more information on trading bitcoin, click here.

For those looking to gain exposure without buying bitcoins, there is the option to purchase shares of the GBTC. This digital currency investment product is the closest thing available to a bitcoin ETF in the U.S. as it owns bitcoins on behalf of investors and allows them to trade in shares of the trust, replicating some aspects of an ETF. Grayscale Investments calls it a traditional investment vehicle with shares titled in the investor's name. Although the Trust is not an ETF itself, Grayscale says it's modeled on popular commodity investment products like the SPDR Gold Trust GLD, a physically-backed ETF. Shares of Grayscale Bitcoin Trust are eligible to be held in certain IRA, Roth IRA, and other brokerage and investor accounts.
On January 21, 2020, GBTC became an SEC reporting company, registering its shares with the Commission and designating the Trust as the first digital currency investment vehicle to attain the status of a reporting company by the SEC. This allows accredited investors who purchased shares in the Trust’s private placement to have an earlier liquidity opportunity, as the statutory holding period of private placement shares would be reduced from 12 months to 6 months, according to SEC rules. The trust requires a minimum investment of $50,000 and charges an annual fee of 2.0 percent, which accrues daily, for accredited investors who wish to subscribe to the Trust as a private placement. On the other hand, investors are eligible to purchase as little as one share of the GBTC public quotation.
Grayscale lists the benefits of investing in GBTC on its website, including that it provides Titled, auditable ownership through a traditional investment vehicle, is eligible for tax-advantaged accounts, is publicly quoted on the OTCQX, is supported by a network of trusted service providers, and its assets are securely stored in “cold”/offline storage with Coinbase Custody Trust Company, LLC, as Custodian.
However, there are downsides to consider when purchasing GBTC. Because GBTC is the first of its kind for bitcoin, investors have been paying a high premium. In September 2018, shares of GBTC traded at a high of $7.95, which was around 20% higher than the value of the bitcoin within the trust that each share represented at that time. Although that premium is significant, it’s lower than it has been in the past — GBTC has closed at prices more than two times the value of its underlying bitcoins. The price of GBTC is driven by demand for GBTC shares, not necessarily by the price of bitcoin because unlike a regular ETF, there is no creation-redemption process to keep GBTC's market value in-line with its NAV. (Sources: Grayscale; Investopedia)
With today’s market action, GBTC pushed higher to $12.75, a move that violated the fund’s bearish resistance line. As a result, GBTC is now trading in an overall positive trend with a fund score of 3.19 and a strongly positive 2.37 score direction. From current levels, GBTC faces resistance between $14 and $14.75, the fund’s recent rally high, and remains -67% off of its all-time high of $38.50 from December 2017. Initial support sits at $10. Year-to-date, GBTC is up 43.71% while BTC is up 54.53% (through 10/9).

Tracking Cryptoassets on the NDW Research Platform
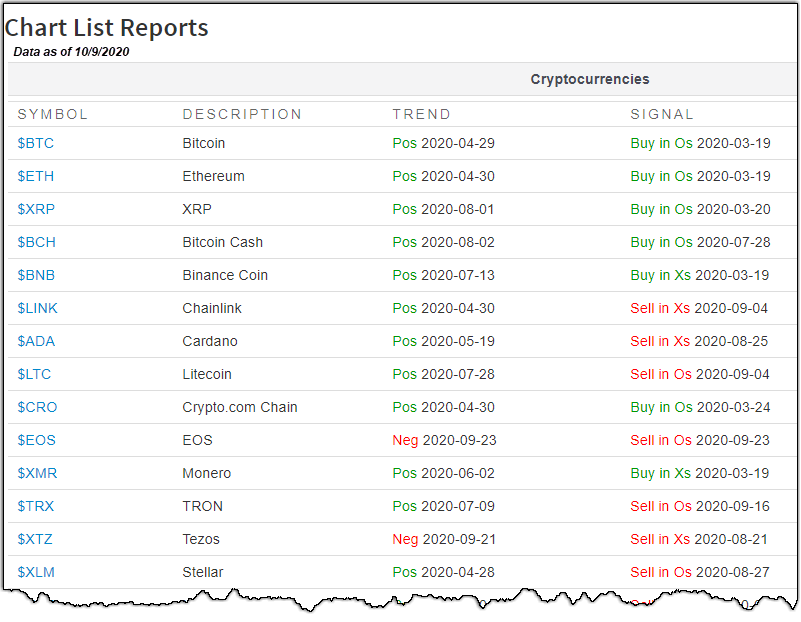
In 2019, we announced a partnership with Bitwise, a pioneer in the cryptoasset management space. This partnership has enabled us to expand our database, adding over 200 crypto assets and four Bitwise indexes to the NDW Research Platform, including the DWACRYPTO Index, an equal-weighted index comprised of the 10 largest cryptocurrencies as defined by their market caps. You can find a list of all crypto assets that we currently track under Security Selection -> Chart Lists -> Special Reports -> Cryptocurrencies or click here. Please note that cryptocurrency symbols start with the dollar sign $ on the site.
For those looking for additional insight/commentary on the crypto asset space or those who may need some talking points for an upcoming client meeting, we suggest reading Bitwise's Investor Letters, a monthly publication available online at bitwiseinvestments.com. To access this commentary, click here. Note: The views and opinions expressed in this article are those of the authors and do not necessarily reflect those of Nasdaq Dorsey Wright.

Average Level
12.24
| AGG | iShares US Core Bond ETF |
| USO | United States Oil Fund |
| DIA | SPDR Dow Jones Industrial Average ETF |
| DVY | iShares Dow Jones Select Dividend Index ETF |
| DX/Y | NYCE U.S.Dollar Index Spot |
| EFA | iShares MSCI EAFE ETF |
| FXE | Invesco CurrencyShares Euro Trust |
| GLD | SPDR Gold Trust |
| GSG | iShares S&P GSCI Commodity-Indexed Trust |
| HYG | iShares iBoxx $ High Yield Corporate Bond ETF |
| ICF | iShares Cohen & Steers Realty ETF |
| IEF | iShares Barclays 7-10 Yr. Tres. Bond ETF |
| LQD | iShares iBoxx $ Investment Grade Corp. Bond ETF |
| IJH | iShares S&P 400 MidCap Index Fund |
| ONEQ | Fidelity Nasdaq Composite Index Track |
| QQQ | Invesco QQQ Trust |
| RSP | Invesco S&P 500 Equal Weight ETF |
| IWM | iShares Russell 2000 Index ETF |
| SHY | iShares Barclays 1-3 Year Tres. Bond ETF |
| IJR | iShares S&P 600 SmallCap Index Fund |
| SPY | SPDR S&P 500 Index ETF Trust |
| TLT | iShares Barclays 20+ Year Treasury Bond ETF |
| GCC | WisdomTree Continuous Commodity Index Fund |
| VOOG | Vanguard S&P 500 Growth ETF |
| VOOV | Vanguard S&P 500 Value ETF |
| EEM | iShares MSCI Emerging Markets ETF |
| XLG | Invesco S&P 500 Top 50 ETF |

| Symbol | Company | Sector | Current Price | Action Price | Target | Stop | Notes |
|---|---|---|---|---|---|---|---|
| SHW | The Sherwin-Williams Company | Building | $698.40 | 670 - 710 | 840 | 552 | 4 for 5'er, top half of favored BUIL sector matrix, LT pos market RS, multiple buy signals, pullback from ATH Earnings 10/27 |
| CHRW | C.H. Robinson Worldwide, Inc. | Transports/Non Air | $105.45 | hi 90s - low 100s | 146 | 82 | 4 for 5'er, #6 of 43 names in TRAN sector matrix, one box from mkt RS buy signal, spread triple top, 2% yield Earnings 10/27 |
| PGR | The Progressive Corporation | Insurance | $99.88 | low to mid 90s | 101 | 76 | 4 for 5'er, top 20% of INSU sector matrix, multiple buy signals Earnings 10/14 |
| QCOM | QUALCOMM Incorporated | Semiconductors | $124.87 | mid $110s to upper $120s | $161 | $96 | 5 for 5'er, pullback from ATH, consec buy signals, pos mon mom, top 10% of DWASEMI, 2.22% yield Earnings 11/4 |
| LOGI | Logitech International S.A. | Computers | $79.54 | mid-to-high 70s | 91 | 64 | 5 for 5'er, top 20% of favored COMP sector matrix, triple top breakout, 1.1% yield, LT pos mkt RS |
| BLDR | Builders FirstSource, Inc. | Building | $34.00 | low-to-mid 30s | 54.50 | 27 | 5 for 5'er, #4 of 74 in BUIL sector matrix, multiple buy signals, R-R>3.0, pot. covered write. Earn. 10/29 |
| SWKS | Skyworks Solutions, Inc. | Semiconductors | $154.28 | low 140s to low 160s | 196 | 122 | 4 for 5'er, pullback from ATH, top 25% of DWASEMI, pos weekly momentum flip |
| VEEV | Veeva Systems Inc. | Software | $294.12 | 270s to 300s | 328 | 232 | 5 for 5'er, pullback from AT high, consec buy signals, long-term market RS buy signal, top 25% DWASOFT |
| ARNC | Arconic Corp. | Metals Non Ferrous | $22.67 | low 20s | 29.50 | 18 | 5 for 5'er, #2 of 14 in favored META sector matrix, triple top breakout, pot. covered write |
| FND | Floor & Decor Holdings Inc | Retailing | $79.64 | hi 70s - low 80s | 90 | 67 | 5 for 5'er, top third of favored RETA sector matrix, spread triple top, pos wkly mom flip, pot. covered write. |
| Symbol | Company | Sector | Current Price | Action Price | Target | Stop | Notes |
|---|
| Comment |
|---|
| ATSG Air Transport Services Group Inc. R ($27.29) - Aerospace Airline - We will now raise our stop to $23, the first potential sell signal on ATSG's default chart. |
| ZTS Zoetis Inc R. ($168.44) - Drugs - We will now raise our stop to $152, the second potential sell signal on ZTS's default chart. |
| PGR The Progressive Corporation R ($101.18) - Insurance - PGR has moved above the ideal action range. OK to hold here. Raise stop to $85, the potential trend line violation on PGR's default chart. |
FND Floor & Decor Holdings Inc R ($80.30) - Retailing - FND is a 5 for 5'er that ranks in the top third of the favored retailing sector matrix. The stock gave a second consecutive buy signal when it broke a spread triple top in last week's trading, also reaching a new all-time high. Meanwhile, a recent flip to positive weekly momentum is a is a positive sign of the stock's potential for additional upside. FND also offers a potential covered write opportunity on the January 2021 call options. Long exposure may be added in the hi $70s to low $80s and we will set our initial stop at $67, which would take out multiple levels of support on FND's default chart. We will use the bullish price objective, $90, as our target price. Earnings re expected on 10/29.
| 20 | |||||||||||||||||||||||||||||||||||||||||||||||||||||
| 81.00 | X | 81.00 | |||||||||||||||||||||||||||||||||||||||||||||||||||
| 80.00 | X | 80.00 | |||||||||||||||||||||||||||||||||||||||||||||||||||
| 79.00 | X | 79.00 | |||||||||||||||||||||||||||||||||||||||||||||||||||
| 78.00 | X | 78.00 | |||||||||||||||||||||||||||||||||||||||||||||||||||
| 77.00 | X | A | X | 77.00 | |||||||||||||||||||||||||||||||||||||||||||||||||
| 76.00 | X | X | O | X | O | X | 76.00 | ||||||||||||||||||||||||||||||||||||||||||||||
| 75.00 | 9 | O | X | O | X | X | O | X | 75.00 | ||||||||||||||||||||||||||||||||||||||||||||
| 74.00 | X | O | X | X | O | X | O | X | O | X | 74.00 | ||||||||||||||||||||||||||||||||||||||||||
| 73.00 | X | O | X | O | X | O | X | O | X | O | 73.00 | ||||||||||||||||||||||||||||||||||||||||||
| 72.00 | X | O | X | O | X | O | X | O | X | Mid | 72.00 | ||||||||||||||||||||||||||||||||||||||||||
| 71.00 | X | X | X | O | X | O | O | X | O | 71.00 | |||||||||||||||||||||||||||||||||||||||||||
| 70.00 | X | O | X | O | X | O | X | O | 70.00 | ||||||||||||||||||||||||||||||||||||||||||||
| 69.00 | X | O | X | O | X | O | X | 69.00 | |||||||||||||||||||||||||||||||||||||||||||||
| 68.00 | X | O | O | 8 | O | 68.00 | |||||||||||||||||||||||||||||||||||||||||||||||
| 67.00 | X | O | X | 67.00 | |||||||||||||||||||||||||||||||||||||||||||||||||
| 66.00 | X | O | X | 66.00 | |||||||||||||||||||||||||||||||||||||||||||||||||
| 65.00 | X | O | 65.00 | ||||||||||||||||||||||||||||||||||||||||||||||||||
| 64.00 | X | 64.00 | |||||||||||||||||||||||||||||||||||||||||||||||||||
| 63.00 | • | X | 63.00 | ||||||||||||||||||||||||||||||||||||||||||||||||||
| 62.00 | X | • | X | 62.00 | |||||||||||||||||||||||||||||||||||||||||||||||||
| 61.00 | X | O | • | X | X | 61.00 | |||||||||||||||||||||||||||||||||||||||||||||||
| 60.00 | X | O | • | X | O | X | 60.00 | ||||||||||||||||||||||||||||||||||||||||||||||
| 59.00 | X | O | • | 7 | O | X | • | Bot | 59.00 | ||||||||||||||||||||||||||||||||||||||||||||
| 58.00 | X | O | X | • | X | X | O | • | 58.00 | ||||||||||||||||||||||||||||||||||||||||||||
| 57.00 | X | O | X | O | • | X | X | O | X | • | 57.00 | ||||||||||||||||||||||||||||||||||||||||||
| 56.00 | X | O | X | O | • | X | O | X | O | X | • | 56.00 | |||||||||||||||||||||||||||||||||||||||||
| 55.00 | X | O | O | X | • | X | O | X | O | X | • | 55.00 | |||||||||||||||||||||||||||||||||||||||||
| 54.00 | X | O | X | O | • | X | 6 | O | X | O | • | 54.00 | |||||||||||||||||||||||||||||||||||||||||
| 53.00 | X | O | 3 | O | • | X | O | X | O | X | • | 53.00 | |||||||||||||||||||||||||||||||||||||||||
| 52.00 | 2 | X | O | X | O | • | X | O | X | O | X | • | 52.00 | ||||||||||||||||||||||||||||||||||||||||
| 51.00 | X | X | O | X | O | X | O | • | X | O | O | X | • | 51.00 | |||||||||||||||||||||||||||||||||||||||
| 50.00 | • | X | O | X | O | X | • | O | O | • | X | O | • | 50.00 | |||||||||||||||||||||||||||||||||||||||
| 49.00 | • | • | X | O | X | O | • | O | • | X | • | 49.00 | |||||||||||||||||||||||||||||||||||||||||
| 48.00 | X | • | X | 1 | X | • | O | • | X | X | • | 48.00 | |||||||||||||||||||||||||||||||||||||||||
| 47.00 | X | O | X | O | • | O | • | X | O | X | • | 47.00 | |||||||||||||||||||||||||||||||||||||||||
| 46.00 | X | X | O | X | • | O | • | X | O | X | • | 46.00 | |||||||||||||||||||||||||||||||||||||||||
| 45.00 | X | O | X | C | • | O | X | X | O | X | • | 45.00 | |||||||||||||||||||||||||||||||||||||||||
| 44.00 | X | O | X | • | O | X | O | X | O | • | 44.00 | ||||||||||||||||||||||||||||||||||||||||||
| 43.00 | X | O | • | O | X | X | O | X | • | 43.00 | |||||||||||||||||||||||||||||||||||||||||||
| 42.00 | X | • | O | X | O | X | O | X | • | 42.00 | |||||||||||||||||||||||||||||||||||||||||||
| 41.00 | X | • | O | X | O | X | O | X | • | 41.00 | |||||||||||||||||||||||||||||||||||||||||||
| 40.00 | • | O | X | 5 | X | O | • | 40.00 | |||||||||||||||||||||||||||||||||||||||||||||
| 39.00 | O | X | O | • | 39.00 | ||||||||||||||||||||||||||||||||||||||||||||||||
| 38.00 | O | X | • | 38.00 | |||||||||||||||||||||||||||||||||||||||||||||||||
| 37.00 | O | X | X | X | • | 37.00 | |||||||||||||||||||||||||||||||||||||||||||||||
| 36.00 | O | X | X | O | X | O | X | • | 36.00 | ||||||||||||||||||||||||||||||||||||||||||||
| 35.00 | O | X | O | X | O | X | O | X | • | 35.00 | |||||||||||||||||||||||||||||||||||||||||||
| 34.00 | O | X | O | X | O | X | O | • | 34.00 | ||||||||||||||||||||||||||||||||||||||||||||
| 33.00 | O | X | O | X | O | • | 33.00 | ||||||||||||||||||||||||||||||||||||||||||||||
| 32.00 | O | X | O | X | • | 32.00 | |||||||||||||||||||||||||||||||||||||||||||||||
| 31.00 | O | X | 4 | X | • | 31.00 | |||||||||||||||||||||||||||||||||||||||||||||||
| 30.00 | O | X | X | O | X | • | 30.00 | ||||||||||||||||||||||||||||||||||||||||||||||
| 29.00 | O | X | O | X | O | X | • | 29.00 | |||||||||||||||||||||||||||||||||||||||||||||
| 28.00 | O | X | O | X | O | X | • | 28.00 | |||||||||||||||||||||||||||||||||||||||||||||
| 27.00 | O | X | O | • | O | • | 27.00 | ||||||||||||||||||||||||||||||||||||||||||||||
| 26.00 | O | X | • | • | 26.00 | ||||||||||||||||||||||||||||||||||||||||||||||||
| 25.00 | O | • | 25.00 | ||||||||||||||||||||||||||||||||||||||||||||||||||
| 20 |
| ANSS Ansys Inc ($347.86) - Software - Shares of ANSS moved higher Monday to break a double top at $340 before continuing higher intraday to $348. This 4 for 5'er ranks in the top half of the software sector RS matrix and has been on an RS buy signal against the market since mid-2011. Weekly momentum also recently flipped positive, suggesting the potential for further upside from here. Those looking to add exposure may consider the stock at current levels, with initial support offered at $316. Note that further overhead resistance may be found at the all-time high of $352 seen in September of this year. Earnings are expected on 11/4. |
| BLK BlackRock, Inc. ($614.89) - Wall Street - BLK shares moved higher today to break a double top at $616 to return to a buy signal and reach a new all-time high. This 4 for 5'er has been in a positive trend since April and on an RS buy signal versus its peer group since 2011. BLK is actionable at current levels with a weekly overbought/oversold reading of 52%. From here, support can be found at $536. Note that earnings are expected 10/13. |
| DDS Dillard's, Inc. ($54.05) - Retailing - DDS broke a double top at $47 on Monday before moving higher to $61. This stock is a 4 for 5’er that ranks 5th out of 82 names in the favored retailing sector RS matrix. Monthly momentum has been positive for two months and DDS moved back into a positive trend earlier this month. Demand is in control. From here, support sits at $42. |
| FISV Fiserv, Inc. ($106.68) - Computers - FISV moved higher Monday to break a spread quintuple top at $106. This 3 for 5'er moved to a positive trend in May 2009 and has been on an RS buy signal against the market since 2008. The technical picture is sound here and improving. Exposure may be considered at current levels, with initial support offered at $97. Further support can be found at the bullish support line, which is currently positioned at $95. Note that earnings are expected on 10/27. |
| FSLR First Solar, Inc. ($79.31) - Semiconductors - Shares of FSLR continued higher Monday to break a spread triple top at $82, marking a new 52-week high. This 4 for 5'er moved to a positive trend in May and ranks 4th out of 63 names in the semiconductors sector RS matrix. Weekly momentum also just flipped positive, indicating the potential for higher prices. Those looking to add exposure may consider the stock at current levels, with initial support offered at $77. Note that earnings are expected on 10/22. |
| HD Home Depot, Inc. ($286.71) - Building - HD broke a double top at $288, marking the stock’s sixth consecutive buy signal. HD is a strong 4 for 5’er that has maintained a long-term market RS buy signal since January 2012. Demand is in control. From here, support sits at $264. Note HD offers a yield of 2.11%. |
| PYPL Paypal Holdings Inc ($201.51) - Software - PYPL rose Monday to break a double top at $204. This 5 for 5'er moved to a positive trend in April and ranks in the top quintile of the software sector RS matrix. Weekly momentum also just flipped positive, suggesting the potential for further price appreciation. The overall technical picture is positive here and strengthening. Exposure may be considered at current levels, with initial support offered at $190. Further support may be found at $180 and $172, while the potential for overhead resistance may come at the all-time high of $212 last seen in September. Earnings are expected on 10/21. |
| WRK WestRock Co ($38.98) - Forest Prods/Paper - WRK gave a third consecutive buy signal when it broke a double top at $40 in Monday's trading. The weight of the evidence is positive for WRK as it a 3 for 5'er that ranks in the top half of the forest products/paper sector matrix. However, those considering adding long exposure should note that WRK is approaching heavily-overbought territory. Earnings are expected on 11/5. WRK currently comes a 2.1% yield. |

| Name | Option Symbol | Action | Stop Loss |
|---|---|---|---|
| Toll Brothers, Inc. - $49.83 | O: 21A47.00D15 | Buy the January 47.00 calls at 6.90 | 46.00 |
| Name | Option | Action |
|---|---|---|
| Crocs, Inc. ( CROX) | Dec. 37.00 Calls | Raise the option stop loss to 9.10 (CP: 11.10) |
| Apple Inc. ( AAPL) | Jan. 110.00 Calls | Initiate an option stop loss of 16.75 (CP: 18.75) |
| JD.COM INC ( JD) | Jan. 75.00 Calls | Raise the option stop loss to 11.30 (CP: 13.30) |
| Name | Option Symbol | Action | Stop Loss |
|---|---|---|---|
| CIGNA Corporation - $177.46 | O: 21M180.00D15 | Buy the January 180.00 puts at 14.65 | 188.00 |
| Name | Option | Action |
|---|---|---|
|
|
||
| Name | Option Sym. | Call to Sell | Call Price | Investment for 500 Shares | Annual Called Rtn. | Annual Static Rtn. | Downside Protection |
|---|---|---|---|---|---|---|---|
| VICI Properties Inc $23.64 | O: 21C25.00D19 | Mar. 25.00 | 1.55 | $11,266.90 | 22.84% | 13.29% | 5.44% |
| Name | Action |
|---|---|
| Dynatrace, Inc. (DT) - 43.05 | Sell the December 45.00 Calls. |
| The Chemours Company (CC) - 22.99 | Sell the January 23.00 Calls. |
| Snap Inc (SNAP) - 27.00 | Sell the January 25.00 Calls. |
| Synchrony Financial (SYF) - 28.84 | Sell the January 28.00 Calls. |
| Twitter, Inc (TWTR) - 45.90 | Sell the January 47.00 Calls. |
| L Brands Inc. (LB) - 32.26 | Sell the January 35.00 Calls. |
| D.R. Horton, Inc. (DHI) - 78.09 | Sell the January 80.00 Calls. |
| Builders FirstSource, Inc. (BLDR) - 34.00 | Sell the January 34.00 Calls. |
| Paypal Holdings Inc (PYPL) - 197.27 | Sell the January 200.00 Calls. |
| Dow, Inc. (DOW) - 49.36 | Sell the January 50.00 Calls. |
| Williams Companies Inc. (WMB) - 19.42 | Sell the January 20.00 Calls. |
| Name | Covered Write |
|---|---|
| Apple Inc. ( AAPL - 116.97 ) | January 120.00 covered write. |
| Fiserv, Inc. ( FISV - 105.11 ) | January 105.00 covered write. |
Daily Equity & Market Analysis
Loading, Please Wait...
