
Most Requested Symbols

Small and micro-cap size and style categories make up 4 of the top 5 most-improved asset class groups. Small cap stocks are also moving back to buy signals. We explore these developments in today's feature.
Today's featured stock is Illinois Tool Works Inc (ITW)
AIMT, BBIO, GOOGL, INSW, MPC, SHAK, SHOP, THO, TSCO, & XLRN.
Call: Kansas City Southern (KSU); Put: Parsley Energy (PE); Covered Write: Crocs, Inc (CROX).
Initial Public Offerings (IPOs), the terminology for when companies first offer shares to the public market for purchase, tend to gather significant attention from the investment community. For example, companies like Uber UBER, Lyft LYFT, and Peloton PTON should sound familiar as some of the more prominent names that offered shares to the public earlier this year. Although U.S. based/listed companies tend to pull our attention and dominate the conversation, a Saudi-based oil company just set a record for the single largest IPO in history by raking in approximately $25.6 billion in proceeds. The state-owned oil mammoth set its initial share price at $8.53 (32 riyals) and is set to become the world’s most valuable publically traded company once it starts trading on Wednesday (bloomberg.com). Furthermore and perhaps more interestingly, the lucrative company is known to be a bit secretive and has no recorded borrowing from international debt markets yet will now be required to disclose financial documentation to the public. The unfolding event this week is a culmination of a process that began in 2016 and is certainly a place to monitor as we look towards the close of 2019.


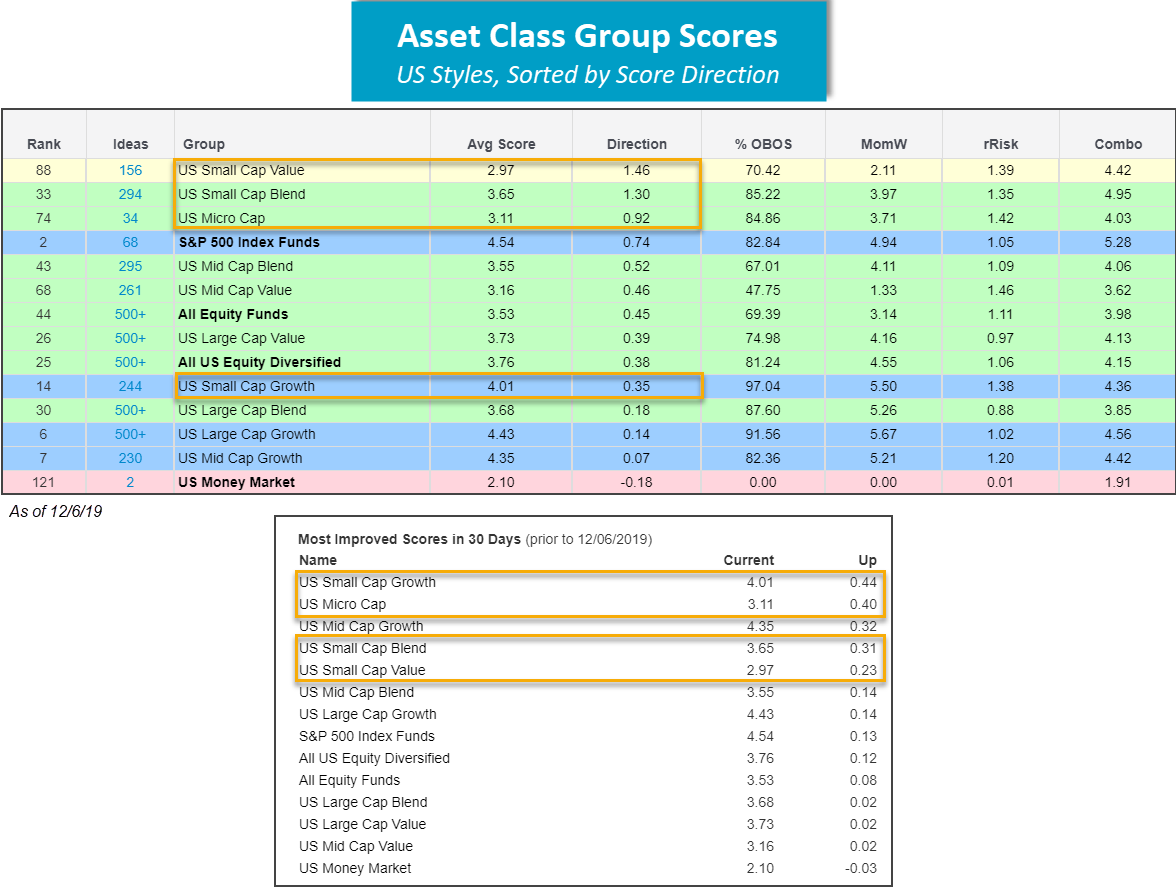
Improvements in relative strength among small-cap domestic equity mutual funds and ETFs is on full display on the Asset Class Group Scores (ACGS) tool. As a refresher, ACGS ranks asset class groups by their constituents’ average fund scores, with a reading of 0 being the worst possible score and a reading of 6 the best possible score. To specifically view US size and style categories, select “US Styles” under filters and then click “Set View”. While large-cap equities score better overall than their small-cap counterparts, notable small-cap style categories of value and blend post the best score improvement readings of all size and style categories over the past six-month period, as indicated by the “Direction” column. By using the “Group Score Report” tool found in the upper lefthand-hand corner of the tool, we can refine score direction to a 30-day lookback. On a near-term basis, small and micro-cap size and style categories make up 4 of the top 5 most-improved asset class groups, attesting to the aforementioned intermediate-term (default) view. In reaction to strong yet relatively sharp score improvement for small-cap variants, each asset class displays a heavily overbought % OBOS reading above 70%, which suggests that a pullback may present a better opportunity for long exposure at this time.
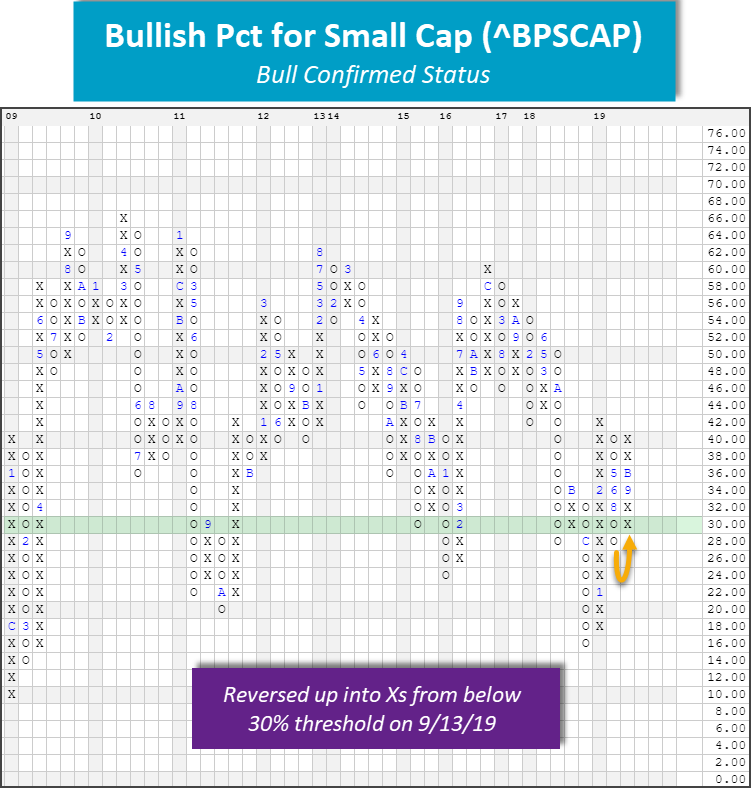
The Bullish Percents indicators or BPs for short, gauge bullish participation among a constituency of individual securities by assessing the percentage of positions on Point & Figure buy signals relative to the aggregate total. BP indicators offer a picture of intermediate-term market strength, with participation readings ranging from 0% to 100% of constituents on PnF buy signals. Additionally, column reversals down from above 70% or up from below 30% may be interpreted as a necessity for offense or defense. In September, we witnessed such an event among small-cap domestic equity stocks from the Bullish Percent for Small Cap ^BPSCAP with a reversal up into Xs from below the 30% threshold to 34%. Coupled with a bull confirmed status resulting from higher tops and higher bottoms on the indicator, this development heralded and continues to affirm a highly-bullish event for small-cap stocks. Since the reversal, BPSCAP has continued higher to its current reading of 40%, displaying a mid-field position that offers an attractive point of entry for long exposure in this area.
To build a shopping list of strong small cap stocks, we can utilize the Security Screener tool (Security Selection -> Security Screener), using the search criteria below. For this particular screen, we focused on strength and actionability by zeroing in on high attribute rated small cap stocks with plenty of trading volume. We then screened for actionable opportunities as well as provided stocks from a diverse array of sectors (There were many sectors represented in the list, ranging from perennial leaders, like technology to up and comers, like healthcare). The table below contains the shopping list. Clicking the symbol will provide access to the stock's PnF chart. If you have a question, feel free to give us a call at (804) 320-8511.
Search Criteria:
Observations:
Small Cap Shopping List:
| Symbol | Name | Price | Tech Attrib/Score | DWA Sector | Yield |
|---|---|---|---|---|---|
| AIMT | Aimmune Therapeutics Inc | 29.65 | 4 |
Drugs | 0.00 |
| BOOT | Boot Barn Holdings Inc | 42.04 | 5 |
Retailing | 0.00 |
| CATM | Cardtronics PLC | 41.07 | 5 |
Finance | 0.00 |
| CCXI | ChemoCentryx Inc. | 31.28 | 5 |
Biomedics/Genetics | 0.00 |
| ELY | Callaway Golf Company | 21.02 | 5 |
Leisure | 0.19 |
| FSLY | Fastly, Inc. Class A | 21.18 | 4 |
Computers | 0.00 |
| INST | Instructure Inc | 49.12 | 5 |
Software | 0.00 |
| MTSI | MACOM Technology Solutions Holdings Inc. | 25.04 | 4 |
Semiconductors | 0.00 |
| RCII | Rent-A-Center, Inc. | 26.74 | 3 |
Retailing | 3.74 |
| RDFN | Redfin Corporation | 21.22 | 3 |
Real Estate | 0.00 |
| SYNA | Synaptics Incorporated | 58.27 | 4 |
Computers | 0.00 |
| TNK | Teekay Tankers, Ltd. | 20.24 | 5 |
Transports/Non Air | 0.59 |
| WGO | Winnebago Industries, Inc. | 48.39 | 4 |
Leisure | 0.91 |
Spotlight Idea: Boot Barn Holdings Inc. (BOOT)
BOOT Boot Barn Holdings Inc ($41.77) - Retailing - Shares of BOOT continue to advance and it's now sitting two boxes away from surpassing the previous all-time high made on November 18th. The perfect 5 for 5’er ranks ninth out of 83 names in the retailing stock sector matrix and currently trades on four consecutive buy signals. Furthermore, the stock demonstrates long –term relative strength versus the market as well as its peer group, remaining on an RS buy signal since November of 2017 and August of 2016, respectively. Additionally, monthly momentum recently flipped to positive, indicating the potential for further upside from here. Overall the technical picture is positive and BOOT is actionable at current levels. Overhead resistance resides at $44 on the default chart and initial support is offered at $38 and $35. Note a move to $33 would violate the bullish support line.

Average Level
29.91
| AGG | iShares US Core Bond ETF |
| USO | United States Oil Fund |
| DIA | SPDR Dow Jones Industrial Average ETF |
| DVY | iShares Dow Jones Select Dividend Index ETF |
| DX/Y | NYCE U.S.Dollar Index Spot |
| EFA | iShares MSCI EAFE ETF |
| FXE | Invesco CurrencyShares Euro Trust |
| GLD | SPDR Gold Trust |
| GSG | iShares S&P GSCI Commodity-Indexed Trust |
| HYG | iShares iBoxx $ High Yield Corporate Bond ETF |
| ICF | iShares Cohen & Steers Realty ETF |
| IEF | iShares Barclays 7-10 Yr. Tres. Bond ETF |
| LQD | iShares iBoxx $ Investment Grade Corp. Bond ETF |
| IJH | iShares S&P 400 MidCap Index Fund |
| ONEQ | Fidelity Nasdaq Composite Index Track |
| QQQ | Invesco QQQ Trust |
| RSP | Invesco S&P 500 Equal Weight ETF |
| IWM | iShares Russell 2000 Index ETF |
| SHY | iShares Barclays 1-3 Year Tres. Bond ETF |
| IJR | iShares S&P 600 SmallCap Index Fund |
| SPY | SPDR S&P 500 Index ETF Trust |
| TLT | iShares Barclays 20+ Year Treasury Bond ETF |
| GCC | WisdomTree Continuous Commodity Index Fund |
| VOOG | Vanguard S&P 500 Growth ETF |
| VOOV | Vanguard S&P 500 Value ETF |
| EEM | iShares MSCI Emerging Markets ETF |
| XLG | Invesco S&P 500 Top 50 ETF |

| Symbol | Company | Sector | Current Price | Action Price | Target | Stop | Notes |
|---|---|---|---|---|---|---|---|
| SWK | Stanley Black & Decker, Inc. | Machinery and Tools | $158.87 | mid 150s - mid 160s | 190 | 126 | 4 for 5'er, top half of favored MACH sector matrix, spread triple top, 1.8% yield |
| DHI | D.R. Horton, Inc. | Building | $54.20 | lower-to-upper $50s | $79 | $43 | 5 for 5'er, pos trend, all-time high, consec buy signals, LT market RS buy signal |
| BMI | Badger Meter Inc. | Electronics | $61.35 | 59 - 63 | 82 | 50 | 4 for 5'er. top half of favored ELEC sector matrix, spread triple top to ATH |
| NI | Nisource, Inc. | Utilities/Electricity | $26.80 | 26 - 29 | 43.25 | 22 | 4 for 5'er, favored EUTI sector, LT pos trend, LT pos mkt RS, 3.0% yield, R-R>3.0 |
| LOW | Lowe's Companies, Inc. | Building | $116.28 | $110s - $120 | $159 | $94 | 4 for 5'er, all-time high, LT market RS buy signal, consec buy signals, 1.89% yield |
| TDG | TransDigm Group, Inc. | Aerospace Airline | $570.11 | 530s - 560s | 728 | 448 | 5 for 5'er, #6 of 46 names in AERO matrix, spread triple top, pullback from ATH, LT pos mkt RS |
| BOOT | Boot Barn Holdings Inc | Retailing | $42.04 | hi 30s - low 40s | 48 | 34 | 5 for 5'er, top 10% of RETA sector matrix, spread triple top, pullback from ATH, pot. cov write, pos mnthly mom flip |
| CPRT | Copart Incorporated | Autos and Parts | $88.58 | upper $80s to mid/lower $90s | $148 | $72 | 5 for 5'er, LT pos trend, LT market RS buy signal, pull back from ATH |
| KSU | Kansas City Southern | Transports/Non Air | $152.64 | uppers 140s - mid 150s | 172 | 124 | 5 for 5'er, #5 of 45 in TRAN sector matrix, multiple buy signals, pullback from ATH, 1% yield |
| ITW | Illinois Tool Works Inc. | Machinery and Tools | $174.19 | low $170s to low $180s | $222 | $136 | 4 for 5'er, fav DWAMACH, LT market RS, pullback from matching ATH, 2.45% yield |
| Symbol | Company | Sector | Current Price | Action Price | Target | Stop | Notes |
|---|---|---|---|---|---|---|---|
| WORK | Slack Technologies, Inc. Class A | Internet | $22.50 | (21 - 19) | 17 | 24 | 0 for 5'er. bottom 20% of unfavored INET sector matrix, multi consec sell signals |
| EYE | National Vision Holdings, Inc. | Retailing | $30.74 | (30 - 26) | 21 | 33 | 2 for 5'er, spread quad bottom, rally from all-time low, LT neg. trend |
| Symbol | Company | Sector | Current Price | Action Price | Target | Stop | Notes |
|---|---|---|---|---|---|---|---|
| TTC | The Toro Company | Machinery and Tools | $78.80 | mid to high 70s | 93 | 64 | See follow comment below. |
| Comment |
|---|
| TTC The Toro Company R ($78.90) - Machinery and Tools - Okay to add exposure at current levels. We will maintain our $64 stop. |
ITW Illinois Tool Works Inc. R ($174.84) - Machinery and Tools - ITW is a solid 4 for 5’er within the favored machinery and tools sector that ranks in the top quartile of the sector RS matrix. In addition, this stock has maintained a long-term market RS buy signal since July 2016 as it has continued to exhibit superior strength when compared to the broader market. ITW has given two consecutive buy signals this year and most recently matched its all-time high from January 2018 at $178. In addition, monthly momentum has been positive for three months, suggesting the potential for higher prices. Okay to add new exposure in the low $170s to lower $180s. We will set our initial stop at $136, which would violate five levels of previous support on ITW’s default chart. We will use the bullish price objective of $222 as our price target. ITW offers a yield of 2.45%.
| 19 | |||||||||||||||||||||||||||||||||||||||||||||||||||||
| 178.00 | X | 178.00 | |||||||||||||||||||||||||||||||||||||||||||||||||||
| 176.00 | O | X | O | 176.00 | |||||||||||||||||||||||||||||||||||||||||||||||||
| 174.00 | O | X | O | 174.00 | |||||||||||||||||||||||||||||||||||||||||||||||||
| 172.00 | 2 | X | B | O | 172.00 | ||||||||||||||||||||||||||||||||||||||||||||||||
| 170.00 | O | X | X | O | X | C | 170.00 | ||||||||||||||||||||||||||||||||||||||||||||||
| 168.00 | O | X | O | X | O | X | 168.00 | ||||||||||||||||||||||||||||||||||||||||||||||
| 166.00 | O | X | X | X | O | X | O | Mid | 166.00 | ||||||||||||||||||||||||||||||||||||||||||||
| 164.00 | O | X | O | X | O | X | O | X | 164.00 | ||||||||||||||||||||||||||||||||||||||||||||
| 162.00 | O | X | O | X | O | X | O | • | • | X | 162.00 | ||||||||||||||||||||||||||||||||||||||||||
| 160.00 | O | X | O | X | 3 | X | O | X | X | X | • | X | • | • | X | 160.00 | |||||||||||||||||||||||||||||||||||||
| 158.00 | O | O | X | O | O | X | O | X | O | X | X | O | • | X | O | A | • | X | 158.00 | ||||||||||||||||||||||||||||||||||
| 156.00 | O | O | X | O | X | O | X | O | 5 | X | O | • | • | X | O | X | O | X | 156.00 | ||||||||||||||||||||||||||||||||||
| 154.00 | O | X | O | X | O | X | O | X | O | X | X | O | X | • | X | O | X | O | X | • | 154.00 | ||||||||||||||||||||||||||||||||
| 152.00 | 4 | O | O | X | O | X | O | X | O | X | 8 | X | X | O | 9 | O | X | O | X | • | 152.00 | ||||||||||||||||||||||||||||||||
| 150.00 | O | X | 6 | • | X | O | X | O | X | O | X | O | X | O | X | O | X | O | O | X | • | 150.00 | |||||||||||||||||||||||||||||||
| 148.00 | O | X | O | X | O | X | X | • | 4 | O | O | X | O | X | O | X | O | X | O | X | • | O | • | Bot | 148.00 | ||||||||||||||||||||||||||||
| 146.00 | O | X | O | X | O | X | O | X | O | • | X | X | O | X | 7 | X | O | • | O | • | O | X | • | • | 146.00 | ||||||||||||||||||||||||||||
| 144.00 | O | X | O | O | 7 | O | X | X | O | • | X | O | X | O | 6 | O | • | • | O | • | 144.00 | ||||||||||||||||||||||||||||||||
| 142.00 | O | X | O | X | O | X | O | 9 | O | • | X | O | X | O | X | • | • | 142.00 | |||||||||||||||||||||||||||||||||||
| 140.00 | 5 | O | X | O | X | O | X | A | C | • | X | 3 | O | X | • | 140.00 | |||||||||||||||||||||||||||||||||||||
| 138.00 | O | O | X | 8 | X | O | X | O | • | • | X | O | • | 138.00 | |||||||||||||||||||||||||||||||||||||||
| 136.00 | O | O | O | X | O | X | • | X | • | X | • | 136.00 | |||||||||||||||||||||||||||||||||||||||||
| 134.00 | O | B | O | X | X | O | X | O | X | • | 134.00 | ||||||||||||||||||||||||||||||||||||||||||
| 132.00 | O | X | O | X | O | X | O | X | O | X | • | 132.00 | |||||||||||||||||||||||||||||||||||||||||
| 130.00 | O | X | O | X | O | X | O | 2 | • | 130.00 | |||||||||||||||||||||||||||||||||||||||||||
| 128.00 | • | O | X | O | O | 1 | • | 128.00 | |||||||||||||||||||||||||||||||||||||||||||||
| 126.00 | • | O | X | O | X | • | 126.00 | ||||||||||||||||||||||||||||||||||||||||||||||
| 124.00 | • | O | X | O | X | • | 124.00 | ||||||||||||||||||||||||||||||||||||||||||||||
| 122.00 | • | O | X | O | X | • | 122.00 | ||||||||||||||||||||||||||||||||||||||||||||||
| 120.00 | • | O | O | X | • | 120.00 | |||||||||||||||||||||||||||||||||||||||||||||||
| 118.00 | • | O | • | 118.00 | |||||||||||||||||||||||||||||||||||||||||||||||||
| 19 |
| AIMT Aimmune Therapeutics Inc ($29.96) - Drugs - Shares of AIMT moved higher Monday to break a double top at $30, marking its fourth consecutive buy signal and a new 52-week high. This 4 for 5'er moved to a positive trend in August and ranks 6th out of 52 names in the drugs sector RS matrix. The overall weight of the evidence for this stock continues to strengthen. Those looking to add exposure may consider AIMT at current levels, with initial support at $26 and further support at the bullish support line, which is currently found at $24. |
| BBIO BridgeBio Pharma, Inc. ($36.04) - Biomedics/Genetics - BridgeBio shares broke a double top at $36 during today's action, marking a fourth consecutive buy signal, before advancing further to a new all-time high of $38. BBIO is a 3 for 5'er, which is the highest possible TA rating given limited relative strength chart data. Additionally, the stock is trading well-above its recently-established bullish support line and has witnessed a recent flip to positive monthly momentum, suggesting the potential for further gains. It should be noted that today's advance puts the stock in heavily overbought territory. Those considering long exposure may be best served to wait for a pullback to the mid $30s. Initial support is offered at $29. |
| GOOGL Alphabet Inc. Class A ($1,345.40) - Internet - GOOGL broke a double top at $1344 on Monday, marking the fourth consecutive buy signal on the chart. GOOGL is a 4 for 5’er within the internet sector that has been trading in a positive trend since July. Demand is in control and the technical picture is positive however GOOGL is nearing overbought territory. From here, initial support is offered at $1280. |
| INSW International Seaways Inc ($27.59) - Oil Service - International Seaways shares broke a double top at $28 during today's action, marking a second consecutive buy signal and a new all-time high. INSW is a strong 5 for 5'er trading well above its recently established bullish support line. Additionally, the stock moved to a market RS buy signal since October, confirming long-term strength against the broader market. Okay to add long exposure here with initial support offered at $24. |
| MPC Marathon Petroleum Corp. ($58.80) - Oil - Marathon Petroleum shares broke a double bottom at $59 today, marking a second consecutive sell signal. While the weight of the evidence remains positive for this 5 for 5'er, recent consecutive sell signals suggest that supply is in control in the near-term. No new positions at this time. Those long find support at the current price level of $59, with subsequent support offered at the bullish support line of $54. MPC returns to a buy signal with adouble top break at $64. |
| SHAK Shake Shack Inc ($57.62) - Restaurants - SHAK fell Monday to break a double bottom at $58, marking its eighth consecutive sell signal. This 2 for 5'er moved to a negative trend in November and ranks 23rd out of 28 names in the restaurants sector RS matrix. The technical picture for SHAK continues to weaken. Long exposure should be avoided, while those looking for short ideas should note that the stock is in heavily oversold territory and currently at support from April of this year. Initial overhead resistance can be found at $63. |
| SHOP Shopify Inc ($376.80) - Internet - Shares of SHOP reversed up into a column of Xs Monday and broke a double top at $380, marking the stock's fourth consecutive buy signal. This 5 for 5'er moved to a positive trend in November and ranks in the top half of the internet sector RS matrix. Weekly momentum also recently flipped positive, adding to the positive technical picture. The stock has also been on an RS buy signal against the market since late-2016. Those looking to add exposure may consider the stock at current levels, or upon a pullback/normalization of the trading band as SHOP is nearing overbought territory. Initial support can be found at $364 with further support at $312. Further overhead resistance may come initially at $392 from September of this year, and at the all-time chart high of $408 seen this past August. |
| THO Thor Industries, Inc. ($65.22) - Leisure - THO continued higher Monday morning following their earnings release to complete a shakeout pattern with a triple top break at $69, before pulling back towards normalized distribution levels with intraday movement to $65 in afternoon trading. This 3 for 5'er moved to a positive trend in September and ranks 4th out of 51 names in the favored leisure sector RS matrix. The stock also carries a yield of 2.45%. Initial support can be found at $62, with further support at $52 and $51, the current location of the bullish support line. Further overhead resistance may be found at $71 from April of this year. |
| TSCO Tractor Supply Company ($98.23) - Retailing - TSCO moved higher Monday to break a quadruple top at $99, which also moved the stock back to a positive trend and gave it 4 out of the 5 possible technical attributes. The stock has also been on an RS buy signal against the market since mid-2018 and carries a yield of 1.42%. The weight of the evidence continues to improve. Initial support can be found at $94 with further support at $92, $91, and $89. The potential for further overhead resistance may be found initially at $106 from September of this year. |
| XLRN Acceleron Pharma, Inc. ($50.25) - Drugs - XLRN reversed up into a column of Xs Monday and broke a double top at $50, marking its third consecutive buy signal. This 5 for 5'er moved to a positive trend in November and ranks in the top third of the drugs sector RS matrix. The stock has also been on an RS buy signal against the market since mid-2017. Exposure to XLRN may be considered at current levels, with initial support at $46. Further support can be found at $42, which is the current location of the bullish support line, and $41. |

| Name | Option Symbol | Action | Stop Loss |
|---|---|---|---|
| Kansas City Southern - $151.37 | O: 20C150.00D20 | Buy the March 150.00 calls at 8.50 | 138.00 |
| Name | Option | Action |
|---|---|---|
| American Water Works Company, Inc. ( AWK) | Mar. 120.00 Calls | Initiate an option stop loss of 3.80 (CP: 5.80) |
| Name | Option Symbol | Action | Stop Loss |
|---|---|---|---|
| Parsley Energy Inc - $16.32 | O: 20O17.50D20 | Buy the March 17.50 puts at 2.40 | 18.00 |
| Name | Option | Action |
|---|---|---|
| Embraer - Empresa Brasileira de Aeronau (Brazil) ADR (ERJ) | Apr. 17.50 Puts | Stopped at 18.00 (CP: 17.84) |
| Nektar Therapeutics (NKTR) | Feb. 21.00 Puts | Stopped at 23.00 (CP: 22.96) |
| Name | Option Sym. | Call to Sell | Call Price | Investment for 500 Shares | Annual Called Rtn. | Annual Static Rtn. | Downside Protection |
|---|---|---|---|---|---|---|---|
| Crocs, Inc. $35.46 | O: 20C37.00D20 | Mar. 37.00 | 36.27 | $16,781.85 | 32.77% | 28.85% | 7.46% |
| Name | Action |
|---|---|
| Boot Barn Holdings Inc (BOOT) - 42.04 | Sell the February 40.00 Calls. |
| Boot Barn Holdings Inc (BOOT) - 42.04 | Sell the February 40.00 Calls. |
| United Rentals, Inc. (URI) - 157.26 | Sell the March 160.00 Calls. |
| KB Home (KBH) - 34.19 | Sell the April 36.00 Calls. |
| Chegg Inc (CHGG) - 37.95 | Sell the April 40.00 Calls. |
| Micron Technology, Inc. (MU) - 47.93 | Sell the April 50.00 Calls. |
| XPO Logistics Inc (XPO) - 82.19 | Sell the May 90.00 Calls. |
| Vertex Pharmaceuticals Incorporated (VRTX) - 223.25 | Sell the April 230.00 Calls. |
| Lattice Semiconductor Corp (LSCC) - 19.09 | Sell the March 20.00 Calls. |
| Take-Two Interactive Software, Inc. (TTWO) - 123.73 | Sell the March 125.00 Calls. |
| Advanced Micro Devices, Inc. (AMD) - 39.63 | Sell the April 40.00 Calls. |
| Centene Corporation (CNC) - 60.98 | Sell the March 62.50 Calls. |
| Manhattan Associates, Inc. (MANH) - 81.83 | Sell the April 85.00 Calls. |
| JD.COM INC (JD) - 32.93 | Sell the March 35.00 Calls. |
| Name | Covered Write |
|---|---|
|
|
|
Daily Equity & Market Analysis
Loading, Please Wait...
