
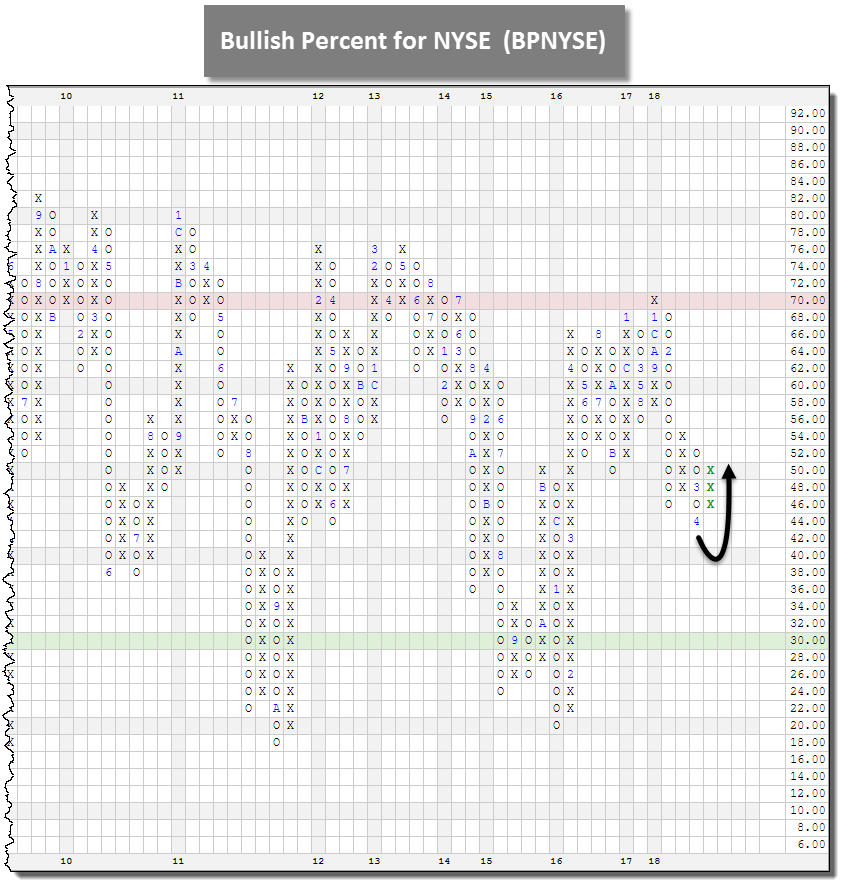
The Bullish Percent for NYSE (BPNYSE) reversed back up into X's - We have possession of the football.
With action yesterday (4/17), the Bullish Percent for NYSE BPNYSE reversed back up into a column of X’s at 50% from O’s at 44%. This means roughly 6% of stocks within the NYSE universe (which is roughly 2,000) returned to a buy signal over the past week. This reversal puts the offense back on the field in neutral territory – i.e. the 50-yard line. The chart pattern is now Bear Correction meaning the chart is in a column of X’s but on a Point & Figure sell signal. As Tom Dorsey would say, we are at a flashing red light - come to a full stop, look both ways, and proceed with caution. So this reversal into X’s is well-received, but it carries more risk than one that occurs below the 30% mark since that is a lower risk environment, technically speaking. We have to deal with the information we have at hand and though it seems like we've been dealt 7, 2 off-suit so far this year we have to accept that we won’t always be dealt aces. What we can do, given this information, is ease up on the amount of hard stops you may have set over the past month and focus our new buying on strong relative strength groups wherever they may present themselves, be it within US Equity or another asset class.
It is good to see all the major indices return to positive territory on the year and as we have covered in reports, videos, and podcasts over the past few weeks many of the same relative strength trends witnessed in 2017 still hold true today. Just because some areas of the market have been in favor a while does not mean that things must or should change. We have rules in place to move us out of areas of weakness and into areas of strength. This is a time where you can display to your clients that you have set them up for success and have a plan should volatility, geopolitical conflict, or anything else disrupt those areas which currently find themselves in a favorable position.
Here are a couple observations and ways we interpret this chart:
- The Y Axis gauges the percentage of stocks within the universe that are trading on a Point & Figure buy signal - not a price
- Column of X’s means the percentage is increasing – we have the football
- Column of O’s means the percentage is decreasing – we are on defense
- X’s indicate more breadth and participation to the upside and vice versa
- It is not a directional call – the market could move higher or lower regardless of column
- It does not gauge how long the market will move in any direction
- The 70/30 lines are the end zones – high and low risk, respectively
- This universe is predominantly Small-Cap and Mid-Cap names from the Energy, Industrials, and Financial sectors
- The sectors that contributed the most to the reversal up were Industrial (24.04%), Energy (19.23%), and Consumer Cyclical (16.35%).
- Click here to view the stocks in a portfolio on the DWA Platform - You can download them to excel from here if you so desire
- Click here to download the Dorsey Wright Playbook
Given the reversal on this chart, we are able to feel more comfortable putting money to work that may be from either a new account or cash that was sitting on the sidelines. Ideally we would be looking for names that are solid citizens (Tech Attribute 3, 4, or 5), trading in a positive trend, are trading on Point & Figure buy signals, and are trading above February support. Two more well known names that caught our attention from the list of stocks that recently returned to a buy signal within the NYSE include Lockheed Martin LMT and Mastercard MA. What would be even better are names that are trading at highs as these are examples of positive divergers from the rest of the broad market. Stay tuned for a feature on these type of names posted in the report on Friday night. In the meantime, if you would like help screening a particular stock or searching for names that would be attractive for your portfolio, take advantage of our tools like DALI ideas or the Query Engine. You may also call our research office to speak with an analyst (804-320-8511).
