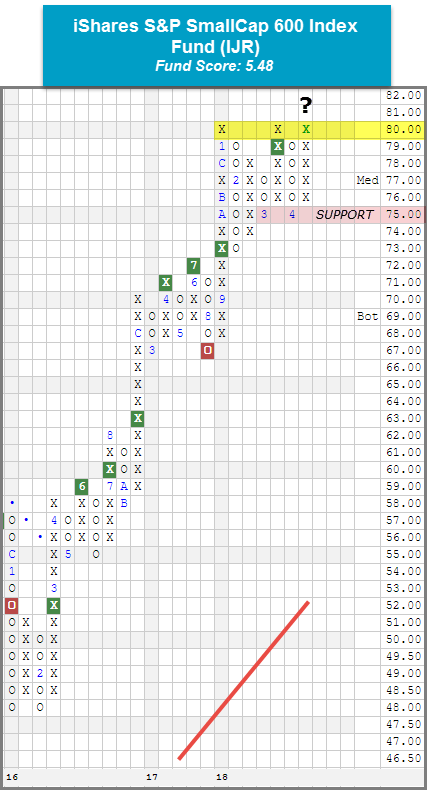
It was a generally positive week (4/10 – 4/17) across the board for the 10 major market ETFs as eight finished higher on the week and two finished lower. As a result of yesterday's action IJR is now sitting up against its all-time high and is one box away from completing a spread triple top break.
Portfolio View - Major Market ETFs
| Symbol | Name | Price | Yield | Trend | RS Signal | RS Col. | Score | 200 Day MA | Weekly Mom |
| DIA | SPDR Dow Jones Industrial Average ETF Trust | 247.80 | 2.00 | Positive | X | 3.63 | 235.77 | -11W | |
| EFA | iShares MSCI EAFE ETF | 71.22 | 2.53 | Positive | Sell | O | 2.66 | 69.24 | +2W |
| FRN | PowerShares Frontier Markets ETF | 16.15 | 3.34 | Positive | Sell | X | 4.47 | 15.06 | -4W |
| IJH | iShares S&P MidCap 400 Index Fund | 191.43 | 1.27 | Positive | Buy | X | 4.16 | 183.55 | -5W |
| IJR | iShares S&P SmallCap 600 Index Fund | 79.87 | 1.17 | Positive | Buy | X | 5.48 | 74.57 | -4W |
| QQQ | PowerShares QQQ Trust | 166.10 | 0.79 | Positive | Buy | X | 5.58 | 153.90 | -5W |
| RSP | PowerShares S&P 500 Equal Weight ETF | 101.43 | 1.59 | Positive | Buy | X | 4.70 | 98.03 | -5W |
| SPY | SPDR S&P 500 ETF Trust | 270.19 | 1.80 | Positive | O | 2.76 | 259.85 | -5W | |
| VWO | Vanguard FTSE Emerging Markets ETF | 46.62 | 2.31 | Positive | Sell | O | 4.77 | 45.34 | -5W |
| XLG | PowerShares S&P 500 Top 50 ETF | 192.10 | 1.82 | Positive | O | 2.61 | 184.87 | -5W |
Additional Comments:
It was a generally positive week (4/10 – 4/17) across the board for the 10 major market ETFs as eight finished higher on the week and two finished lower. The PowerShares QQQ Trust QQQ was the biggest mover to the upside with a gain of 3.03% while the worst performer for the week was the PowerShares Frontier Markets ETF FRN, down -1.64%. As a result of yesterday’s market action, each of the major market ETFs covered in this report are now sitting in positive territory for the year. If you are a regular reader of this report, it comes as no surprise that Small Caps have been an area of strength so far in 2018. In fact, when looking at the Asset Class Group Scores Page, Small Cap Growth and Small Cap Blend both reside in the coveted “blue zone”, meaning they have an average group score of 4 or higher. In DALI, Small Cap Growth is the most improved size and style box in 2018 with a gain of 15 signals. It is sitting in the #2 spot just and only four signals behind #1 ranked Large Cap Growth. The strength in this area of the market is reflected on the chart of the iShares S&P SmallCap 600 Index Fund IJR, which moved higher with yesterday’s trading session to $80. IJR is now testing its all-time high from January and March. From here, a move to $81 would break a spread triple top, which would mark a new all-time high and the third consecutive buy signal since September 2017 at $73. A strong fund score of 5.48 paired with a positive score direction of 0.75 speaks to the fund's absolute strength and relative and improvement over the past six months. When comparing scores, IJR outscores the average Small Cap fund (4.18), the average All US Fund (3.50), and the average US Small Cap Blend fund (4.07) by at least a full score point. Overall, we find that the technical picture remains strong. From here, initial support lies at $75, a level held in both March and April of this year.