Most Requested Symbols

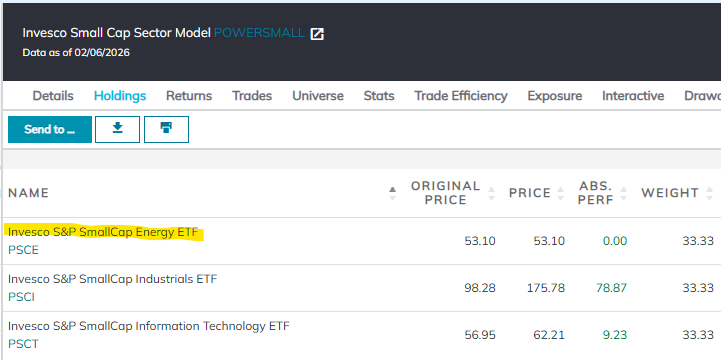
There are changes to two Invesco models this week. The Invesco Small Cap Sector Model (POWERSMALL) sold the Invesco S&P Smallcap Financials ETF (PSCF) and bought the Invesco S&P Smallcap Energy ETF (PSCE). PSCF was sold because its rank in the model’s relative strength matrix fell below the threshold to remain a holding in the model. In its place, the model added PSCE as it was the highest-ranking fund in the matrix that was not already a model holding. PSCE currently has a strong 5.41 fund score, which is 1.14 points better than the average for all energy and natural resource funds, and a positive 5.24 score direction. On its default chart, PSCE has completed three consecutive buy signals and reached a new 52-week high in last week’s trading. Year-to-date (through 2/6) PSCE has gained 23.57% on a price return basis; the fund also carries a 2.04% yield.
In addition to PSCE, POWERSMALL also has exposure to industrials and technology. Year-to-date, the model has gained 11.65%, while the Russell 2000 (RUT) is up 7.59%.
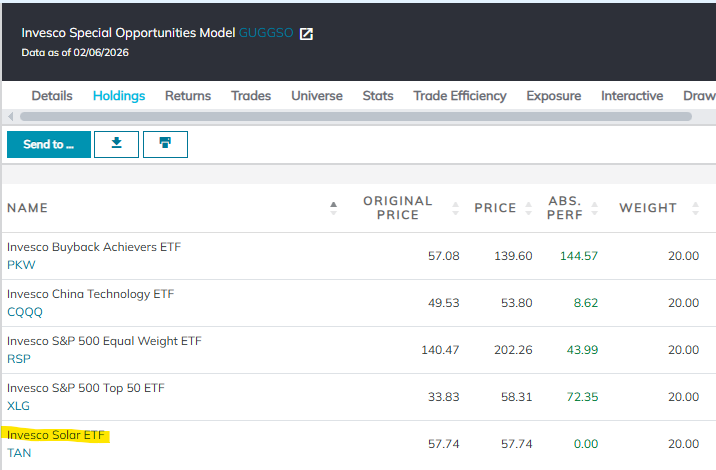
The Invesco Special Opportunities Model (GUGGSO) sold the Invesco Bloomberg Analyst Rating Improvers ETF (UPGD) and bought the Invesco Solar ETF (TAN). UPGD was sold because its rank in the model’s relative strength matrix fell below the threshold to remain a holding in the portfolio. In its place, the model added TAN as it was the highest-ranking fund in the matrix that was not already a holding in the model. TAN currently has a near-perfect 5.86 fund score, which is 1.59 points better than the average for all energy and natural resources funds, and a positive 1.37 score direction. On its default chart, TAN has completed two consecutive buy signals and reached a new multi-year high earlier this month. Year-to-date, TAN has gained 17.55% on a price return basis.
In addition to TAN, GUGGSO also has exposure to buybacks, Chinese technology, the S&P 500 equal weight, and the S&P 500 top 50. Year-to-date, GUGGSO has gained 3.45%.

The distribution curve places each ETF on a bell curve according to their respective degrees of overbought or oversold status using a 10-week distribution. ETFs that are statistically oversold will appear on the left-hand side of the bell curve, while those that have become statistically overbought will appear on the right-hand side of the bell curve. Perhaps the most useful attribute of this feature is that it displays the entire universe on the curve at one time to give us a general picture of whether the Invesco ETF universe is generally overbought on a near-term basis, or generally oversold. Our best opportunities are to buy strong relative strength ETFs that have regressed back toward mean conditions based on market weakness, or have become oversold based upon extreme market weakness. Weekly Distribution is a short-term gauge that is most helpful in timing entry and exit points, while the longer-term information of trend and relative strength is a more controlling factor in the decision of whether to buy or sell.
Average Level
47.20
| < - -100 | -100 - -80 | -80 - -60 | -60 - -40 | -40 - -20 | -20 - 0 | 0 - 20 | 20 - 40 | 40 - 60 | 60 - 80 | 80 - 100 | 100 - > |
|---|---|---|---|---|---|---|---|---|---|---|---|
|
Buy signalpjp
|
|||||||||||
|
Buy signalrfg
|
|||||||||||
|
Buy signalPPA
|
|||||||||||
|
Sell signalpsr
|
|||||||||||
|
Buy signalrsp
|
|||||||||||
|
Buy signalpin
|
Sell signalPBW
|
Buy signalpicb
|
Buy signalPYZ
|
Buy signalPRN
|
|||||||
|
Sell signalpgf
|
Buy signalDBB
|
Sell signalPHO
|
Buy signalCZA
|
Buy signalPSI
|
|||||||
|
Buy signalpcy
|
Buy signalDBP
|
Buy signaldbc
|
Buy signalcut
|
Buy signalPXH
|
Buy signalprf
|
||||||
|
Sell signalpgj
|
Sell signalphb
|
Buy signaldbo
|
Buy signalcgw
|
Buy signalRPV
|
Buy signalRFV
|
||||||
|
Sell signaldba
|
Buy signalpfi
|
Buy signalRPG
|
Buy signaldbe
|
Buy signalTAN
|
Buy signalPIZ
|
Buy signalPDN
|
|||||
|
Buy signalkbwd
|
Buy signalpgx
|
Buy signalgsy
|
Buy signalPDP
|
Buy signalrzg
|
Buy signalRZV
|
Buy signalpxi
|
|||||
|
Sell signalCQQQ
|
Buy signalpbp
|
Buy signalpza
|
Buy signalpie
|
Buy signalCSD
|
Buy signalcvy
|
Buy signalPXJ
|
|||||
|
Sell signalPTH
|
Buy signalPEJ
|
Buy signalpwz
|
Buy signalprfz
|
Sell signalkbwy
|
Buy signalpbd
|
Buy signalpfm
|
Buy signalPXF
|
||||
|
Sell signalpvi
|
Sell signaludn
|
Buy signalpez
|
Buy signalpui
|
Buy signalPKW
|
Buy signalpio
|
Buy signalpey
|
Buy signalpbj
|
||||
|
Sell signalPNQI
|
Sell signalpsp
|
Sell signaluup
|
Buy signalXLG
|
Buy signalpzt
|
Buy signalPBE
|
Buy signalPWB
|
Sell signalptf
|
Buy signalpid
|
Buy signalPKB
|
Sell signalpsl
|
|
| < - -100 | -100 - -80 | -80 - -60 | -60 - -40 | -40 - -20 | -20 - 0 | 0 - 20 | 20 - 40 | 40 - 60 | 60 - 80 | 80 - 100 | 100 - > |
Legend:
The table below is a review of important technical data on a select group of Invesco ETFs. Significant changes within the past week are highlighted in Green if positive or Red if negative. This portfolio is designed to be used as a "radar" screen to bring your attention to potentially important technical changes that may require your attention and potential action. Below this week's featured portfolio is the ability to see other Invesco portfolios including Market, Sector, International, Dynamic family, and RAFI family.
| Symbol | Name | Price | Yield (%) | PnF Trend | RS Signal | RS Col. | 200 Day MA | Weekly Mom | OBOS (Weekly) | ||
|---|---|---|---|---|---|---|---|---|---|---|---|
| BMVP | Invesco Bloomberg MVP Multi-factor ETF | 52.95 | 1.69 | Positive | Sell | X | 48.42 | + 6W |
|
||
| PDN | Invesco RAFI Developed Markets ex-U.S. Small-Mid | 45.66 | 3.15 | Positive | Buy | X | 40.25 | + 11W |
|
||
| PGJ | Invesco Golden Dragon Halter USX | 29.90 | 3.29 | Negative | Sell | O | 29.97 | + 8W |
|
||
| PID | Invesco International Dividend Achievers ETF | 23.12 | 3.17 | Positive | Sell | X | 21.22 | + 5W |
|
||
| PIE | Invesco Nasdaq Dorsey Wright Emerging Markets Momentum ETF | 26.02 | 2.09 | Positive | Sell | X | 22.75 | + 6W |
|
||
| PIN | Invesco India ETF | 23.92 | 0.00 | Positive | Sell | O | 24.20 | - 12W |
|
||
| PIO | Invesco Global Water ETF | 47.26 | 0.98 | Positive | Sell | X | 44.55 | + 6W |
|
||
| PIZ | Invesco Nasdaq Dorsey Wright Developed Markets Momentum ETF | 53.24 | 1.46 | Positive | Buy | X | 46.92 | + 10W |
|
||
| PXF | Invesco RAFI Developed Markets ex-U.S. ETF | 72.02 | 3.38 | Positive | Buy | X | 60.92 | + 11W |
|
||
| PXH | Invesco RAFI Emerging Markets | 27.94 | 3.76 | Positive | Buy | X | 24.75 | + 7W |
|
928= Intl.
929 = Mkt
930 = Sect
931 = commod
932 = dyn

| Ticker | Name | Buys | Xs |
Tech
Attribute/ Score |
|---|---|---|---|---|
| QQQ | Invesco QQQ Trust | 15 | 6 | 4.00 |
| PWB | Invesco Large Cap Growth ETF | 14 | 13 | 5.45 |
| PKW | Invesco Buyback Achievers ETF | 13 | 10 | 5.28 |
| XMMO | Invesco S&P MidCap Momentum ETF | 13 | 8 | 5.05 |
| XMHQ | Invesco S&P MidCap Quality ETF | 10 | 3 | 4.01 |
| XMVM | Invesco S&P MidCap Value with Momentum ETF | 9 | 13 | 5.68 |
| XSMO | Invesco S&P SmallCap Momentum ETF | 9 | 10 | 5.34 |
| PRF | Invesco RAFI US 1000 ETF | 8 | 13 | 4.42 |
| PFM | Invesco Dividend Achievers ETF | 7 | 4 | 4.15 |
| PDP | Invesco Nasdaq Dorsey Wright Momentum ETF | 6 | 6 | 5.08 |
| XSVM | Invesco S&P SmallCap Value with Momentum ETF | 5 | 9 | 4.49 |
| PRFZ | Invesco RAFI US 1500 Small-Mid ETF | 4 | 10 | 4.17 |
| BMVP | Invesco Bloomberg MVP Multi-factor ETF | 4 | 4 | 4.02 |
| DBC | Invesco DB Commodity Index Tracking | 3 | 8 | 2.99 |
| PEY | Invesco High Yield Equity Dividend Achievers ETF | 1 | 2 | 2.98 |
| PBP | Invesco S&P 500 BuyWrite | 0 | 0 | 2.39 |
| Market | Sector | International | Dynamic Sector | Commodity |
| ETF Name | Symbol | NDW Suggested Weighting | Yield | Date Added |
|---|---|---|---|---|
| Invesco Wilderhill Clean Energy | PBW | 14.286% | 0.7127 | 09/19/2025 |
| Invesco Pharmaceuticals ETF | PJP | 14.286% | 0.9712 | 01/09/2026 |
| Invesco Semiconductors ETF | PSI | 14.286% | 0.0819 | 10/10/2025 |
| Invesco Next Gen Connectivity ETF | KNCT | 14.286% | 0.8061 | 11/21/2025 |
| Invesco Building & Construction ETF | PKB | 14.286% | 0.1277 | 01/23/2026 |
| Invesco Aerospace & Defense ETF | PPA | 14.286% | 0.3777 | 06/24/2022 |
| Invesco Global Clean Energy ETF | PBD | 14.286% | 2.4618 | 11/14/2025 |
* - Dates prior to 1/24/2011, which is when the Invesco Sector Seven ETF Model Portfolio became available in the Invesco Weekly ETF Report, are representative of when the position was added to the backtested model.
| ETF Name | Symbol | NDW Suggested Weighting | Yield | Date Added |
|---|---|---|---|---|
| Invesco S&P SmallCap Energy ETF | PSCE | 33.333% | 2.0374 | 02/06/2026 |
| Invesco S&P SmallCap Industrials ETF | PSCI | 33.333% | 0.4908 | 02/24/2023 |
| Invesco S&P SmallCap Information Technology ETF | PSCT | 33.333% | 0.0234 | 11/14/2025 |
* - Dates prior to 6/1/10, which is when the Invesco Small Cap Sector Model ETF Portfolio became available in the Invesco Weekly ETF Report, are representative of when the position was added to the backtested model.
| ETF Name | Symbol | NDW Suggested Weighting | Yield | Date Added |
|---|---|---|---|---|
| Invesco Nasdaq Dorsey Wright Momentum ETF | PDP | 25.000% | 0.1654 | 12/15/2023 |
| Invesco Nasdaq Dorsey Wright Emerging Markets Momentum ETF | PIE | 25.000% | 2.0869 | 07/25/2025 |
| Invesco Nasdaq Dorsey Wright Developed Markets Momentum ETF | PIZ | 50.000% | 1.4582 | 02/09/2024 |
* - Dates prior to 6/7/13, which is when the DWA Global Technical Leaders Portfolio became available in the Invesco Weekly ETF Report, are representative of when the position was added to the backtested model.
| ETF Name | Symbol | NDW Suggested Weighting | Yield | Date Added |
|---|---|---|---|---|
| Invesco Nasdaq Dorsey Wright Basic Materials | PYZ | 25.000% | 0.6522 | 10/31/2025 |
| Invesco Nasdaq Dorsey Wright Financial Momentum Inc. | PFI | 25.000% | 0.6720 | 02/02/2024 |
| Invesco Nasdaq Dorsey Wright Industrials Momentum ETF | PRN | 25.000% | 0.1496 | 12/30/2022 |
| Invesco Nasdaq Dorsey Wright Technology Momentum ETF | PTF | 25.000% | 0.1856 | 05/02/2025 |
| ETF Name | Symbol | NDW Suggested Weighting | Yield | Date Added |
|---|---|---|---|---|
| Invesco S&P Emerging Markets Low Volatility ETF | EELV | 4.500% | 3.5516 | 07/03/2025 |
| Invesco Nasdaq Dorsey Wright SmallCap Momentum ETF | DWAS | 24.500% | 0.0680 | 07/03/2025 |
| Invesco Nasdaq Dorsey Wright Momentum ETF | PDP | 24.500% | 0.1654 | 07/03/2025 |
| Invesco Nasdaq Dorsey Wright Emerging Markets Momentum ETF | PIE | 10.500% | 2.0869 | 07/03/2025 |
| Invesco Nasdaq Dorsey Wright Developed Markets Momentum ETF | PIZ | 10.500% | 1.4582 | 07/03/2025 |
| Invesco S&P International Developed Low Volatility ETF | IDLV | 4.500% | 4.4901 | 07/03/2025 |
| Invesco S&P 500 Low Volatility ETF | SPLV | 10.500% | 2.0234 | 07/03/2025 |
| Invesco S&P SmallCap Low Volatility ETF | XSLV | 10.500% | 2.0569 | 07/03/2025 |
* - Dates prior to 8/31/15, which is when the Invesco Multi Factor Global Equity Model became available in the Invesco Weekly ETF Report, are representative of when the position was added to the backtested model.
| ETF Name | Symbol | NDW Suggested Weighting | Yield | Date Added |
|---|---|---|---|---|
| Invesco DB Precious Metals Fund | DBP | 50.000% | 2.2321 | 04/11/2025 |
| Invesco DB Base Metals Fund | DBB | 50.000% | 2.4925 | 01/30/2026 |
| ETF Name | Symbol | NDW Suggested Weighting | Yield | Date Added |
|---|---|---|---|---|
| Invesco China Technology ETF | CQQQ | 20.000% | 2.0096 | 03/07/2025 |
| Invesco Buyback Achievers ETF | PKW | 20.000% | 0.9811 | 06/12/2020 |
| Invesco S&P 500 Equal Weight ETF | RSP | 20.000% | 1.5840 | 03/10/2023 |
| Invesco S&P 500 Top 50 ETF | XLG | 20.000% | 0.6445 | 06/09/2023 |
| Invesco Solar ETF | TAN | 20.000% | 0.0000 | 02/06/2026 |
* - Dates prior to 10/14/08, which is when the Invesco Special Opportunities Model ETF Portfolio became available in the Invesco Weekly ETF Report, are representative of when the position was added to the backtested model.
| ETF Name | Symbol | NDW Suggested Weighting | Yield | Date Added |
|---|---|---|---|---|
| Invesco S&P Equal Weight Industrials ETF | RSPN | 33.333% | 0.8126 | 01/31/2025 |
| Invesco S&P Equal Weight Materials ETF | RSPM | 33.333% | 1.8905 | 01/30/2026 |
| Invesco S&P Equal Weight Technology ETF | RSPT | 33.333% | 0.3738 | 05/30/2025 |
* - Dates prior to 8/15/2017, which is when the Invesco Dynamic Equal Weight Sector Model became available in the Invesco Weekly ETF Report, are representative of when the position was added to the backtested model.
Invesco (Mon.)
LISTEN TO PODCAST
Apr 02, 2026
Loading, Please Wait...
