Most Requested Symbols

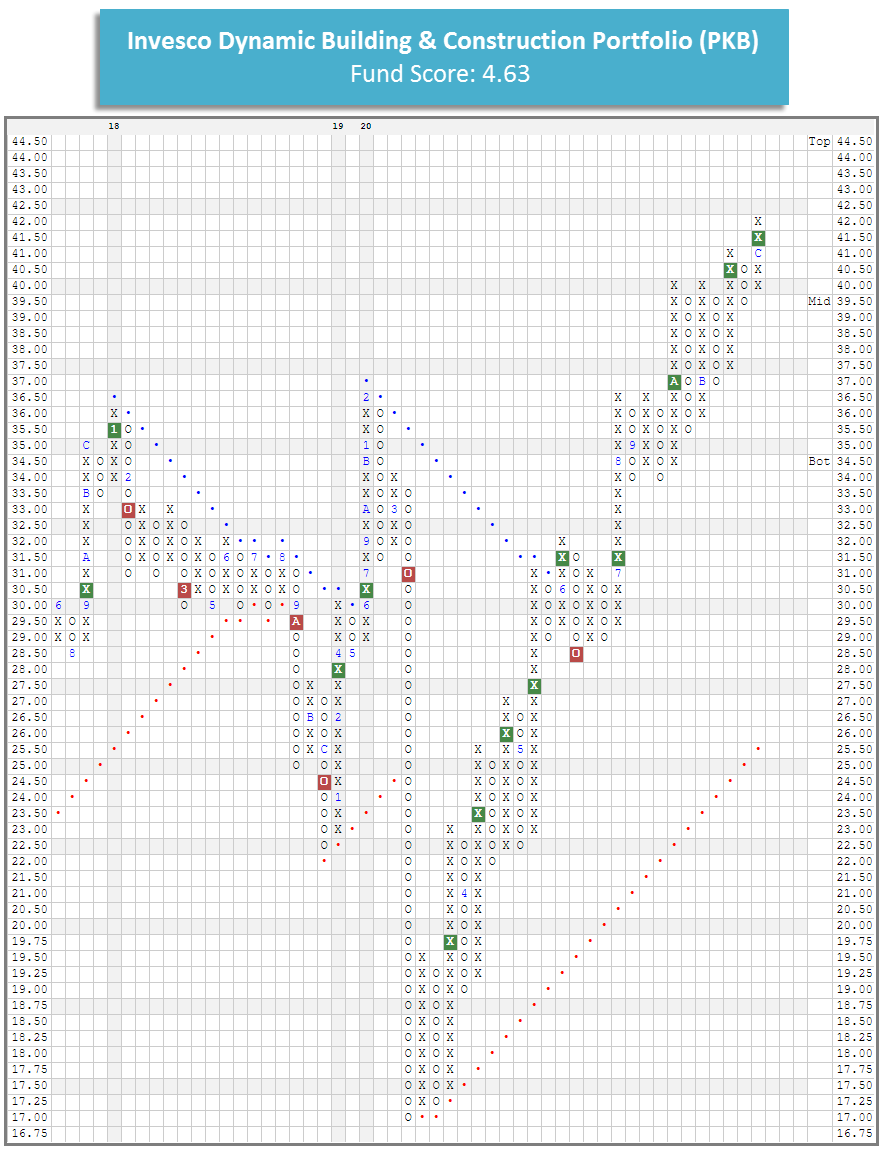
There are no changes to any of the Invesco models this week. In trading earlier this month, the Invesco Dynamic Building & Construction Portfolio PKB gave a fourth consecutive buy signal when it completed a bullish catapult at $41.50, also marking a new all-time high for the fund. PKB currently has a favorable 4.63 fund score, which is 0.95 points better than the average for all infrastructure funds. PKB tracks an index that is comprised of securities of 30 US building and construction companies. These are companies that are primarily engaged in providing construction and related engineering services for building and remodeling residential properties, commercial or industrial buildings, or working on large-scale infrastructure projects, such as highways, tunnels, bridges, dams, power lines, and airports (Source: Invesco). Year-to-date (through 12/24) PKB has gained 25.86% on a price return basis, outpacing the S&P SPX which is up 14.62% over the same period.
Despite sitting at an all-time high on its default chart, PKB remains in actionable territory with a weekly overbought/oversold (OBOS) reading of 44%, so those interested in adding exposure may be do so here. PKB has most recently found support at $39.50, with multiple additional levels of support in the $30s.

The distribution curve places each ETF on a bell curve according to their respective degrees of overbought or oversold status using a 10-week distribution. ETFs that are statistically oversold will appear on the left-hand side of the bell curve, while those that have become statistically overbought will appear on the right-hand side of the bell curve. Perhaps the most useful attribute of this feature is that it displays the entire universe on the curve at one time to give us a general picture of whether the Invesco ETF universe is generally overbought on a near-term basis, or generally oversold. Our best opportunities are to buy strong relative strength ETFs that have regressed back toward mean conditions based on market weakness, or have become oversold based upon extreme market weakness. Weekly Distribution is a short-term gauge that is most helpful in timing entry and exit points, while the longer-term information of trend and relative strength is a more controlling factor in the decision of whether to buy or sell.
Average Level
58.15
| <--100 | -100--80 | -80--60 | -60--40 | -40--20 | -20-0 | 0-20 | 20-40 | 40-60 | 60-80 | 80-100 | 100-> | |||
 |
||||||||||||||
Legend:
The table below is a review of important technical data on a select group of Invesco ETFs. Significant changes within the past week are highlighted in Green if positive or Red if negative. This portfolio is designed to be used as a "radar" screen to bring your attention to potentially important technical changes that may require your attention and potential action. Below this week's featured portfolio is the ability to see other Invesco portfolios including Market, Sector, International, Dynamic family, and RAFI family.
| Symbol | Name | Price | Yield (%) | PnF Trend | RS Signal | RS Col. | 200 Day MA | Weekly Mom | OBOS (Weekly) | ||
|---|---|---|---|---|---|---|---|---|---|---|---|
| ADRE | Invesco BLDRs Emerging Markets 50 ADR Index | 54.43 | 1.10 | Positive | Sell | X | 43.91 | -3W |
|
||
| PDN | Invesco FTSE RAFI Developed Markets ex-U.S. Small-Mid | 34.19 | 1.94 | Positive | Sell | O | 28.49 | -1W |
|
||
| PGJ | Invesco Golden Dragon Halter USX | 60.02 | 0.19 | Positive | Sell | X | 49.66 | -4W |
|
||
| PID | Invesco International Dividend Achievers ETF | 15.40 | 3.93 | Positive | Sell | O | 12.91 | -1W |
|
||
| PIE | Invesco DWA Emerging Markets Momentum ETF | 22.40 | 1.60 | Positive | Sell | O | 18.60 | +12W |
|
||
| PIN | Invesco India ETF | 22.80 | 0.63 | Positive | Sell | O | 18.19 | +7W |
|
||
| PIO | Invesco Global Water ETF | 34.60 | 0.84 | Positive | Sell | O | 30.04 | -3W |
|
||
| PIZ | Invesco DWA Developed Markets Momentum ETF | 33.46 | 0.81 | Positive | Sell | O | 28.63 | +5W |
|
||
| PWC | Invesco Dynamic Market ETF | 109.79 | 1.27 | Positive | O | 90.59 | +6W |
|
|||
| PXF | Invesco FTSE RAFI Developed Markets ex-U.S. ETF | 42.25 | 2.27 | Positive | Sell | O | 35.44 | -1W |
|
||
| PXH | Invesco FTSE RAFI Emerging Markets | 20.74 | 3.18 | Positive | Sell | O | 17.89 | -1W |
|

| Ticker | Name | Buys | Xs | Tech Attribute/ Score |
|---|---|---|---|---|
| QQQ | Invesco QQQ Trust | 12 | 6 | 4.69 |
| PWB | Invesco Dynamic Large Growth | 12 | 4 | 4.55 |
| XSMO | Invesco S&P SmallCap Momentum ETF | 11 | 11 | 5.26 |
| XSVM | Invesco S&P SmallCap Value with Momentum ETF | 10 | 15 | 4.05 |
| XMVM | Invesco S&P MidCap Value with Momentum ETF | 10 | 12 | 4.18 |
| XMHQ | Invesco S&P MidCap Quality ETF | 10 | 11 | 4.66 |
| XMMO | Invesco S&P MidCap Momentum ETF | 10 | 10 | 5.58 |
| PDP | Invesco DWA Momentum ETF | 10 | 9 | 4.77 |
| PRFZ | Invesco FTSE RAFI US 1500 Small-Mid ETF | 8 | 12 | 4.31 |
| PKW | Invesco Buyback Achievers ETF | 8 | 9 | 5.15 |
| PRF | Invesco FTSE RAFI US 1000 ETF | 6 | 4 | 3.17 |
| PFM | Invesco Dividend Achievers ETF | 6 | 2 | 4.07 |
| PWC | Invesco Dynamic Market ETF | 3 | 5 | 3.41 |
| PEY | Invesco High Yield Equity Dividend Achievers ETF | 1 | 6 | 2.93 |
| DBC | Invesco DB Commodity Index Tracking | 1 | 3 | 2.63 |
| PBP | Invesco S&P 500 BuyWrite | 1 | 1 | 2.24 |
| Market | Sector | International | Dynamic Sector | Commodity |
| ETF Name | Symbol | DWA Suggested Weighting | Yield | Date Added |
|---|---|---|---|---|
| Invesco Wilderhill Clean Energy | PBW | 14.286% | 0.3812 | 04/18/2019 |
| Invesco Dynamic Semiconductors ETF | PSI | 14.286% | 0.2940 | 12/27/2019 |
| Invesco Dynamic Software ETF | PSJ | 14.286% | 0.0757 | 10/09/2015 |
| Invesco Dynamic Building & Construction Port | PKB | 14.286% | 0.3443 | 06/26/2020 |
| Invesco DWA Healthcare Momentum ETF | PTH | 14.286% | 0.0000 | 01/31/2020 |
| Invesco DWA Technology Momentum ETF | PTF | 14.286% | 0.0000 | 04/18/2019 |
| Invesco Nasdaq Internet ETF | PNQI | 14.286% | 0.0000 | 03/27/2020 |
* - Dates prior to 1/24/2011, which is when the Invesco Sector Seven ETF Model Portfolio became available in the Invesco Weekly ETF Report, are representative of when the position was added to the backtested model.
| ETF Name | Symbol | DWA Suggested Weighting | Yield | Date Added |
|---|---|---|---|---|
| Invesco S&P SmallCap Consumer Discretionary ETF | PSCD | 33.333% | 0.8014 | 08/14/2020 |
| Invesco S&P SmallCap Healthcare ETF | PSCH | 33.333% | 0.0000 | 09/04/2020 |
| Invesco S&P SmallCap Information Technology ETF | PSCT | 33.333% | 0.1145 | 03/01/2019 |
* - Dates prior to 6/1/10, which is when the Invesco Small Cap Sector Model ETF Portfolio became available in the Invesco Weekly ETF Report, are representative of when the position was added to the backtested model.
| ETF Name | Symbol | DWA Suggested Weighting | Yield | Date Added |
|---|---|---|---|---|
| Invesco DWA SmallCap Momentum ETF | DWAS | 16.667% | 0.2833 | 08/07/2020 |
| Invesco DWA Momentum ETF | PDP | 50.000% | 0.1697 | 01/15/2016 |
| Invesco DWA Emerging Markets Momentum ETF | PIE | 16.667% | 1.6038 | 08/07/2020 |
| Invesco DWA Developed Markets Momentum ETF | PIZ | 16.667% | 0.8125 | 08/07/2020 |
* - Dates prior to 6/7/13, which is when the DWA Global Technical Leaders Portfolio became available in the Invesco Weekly ETF Report, are representative of when the position was added to the backtested model.
| ETF Name | Symbol | DWA Suggested Weighting | Yield | Date Added |
|---|---|---|---|---|
| Invesco DWA Basic Materials Momentum ETF | PYZ | 25.000% | 1.2935 | 12/04/2020 |
| Invesco DWA Consumer Cyclicals Momentum ETF | PEZ | 25.000% | 0.2938 | 05/29/2020 |
| Invesco DWA Industrials Momentum ETF | PRN | 25.000% | 0.1635 | 10/30/2020 |
| Invesco DWA Technology Momentum ETF | PTF | 25.000% | 0.0000 | 05/01/2020 |
| ETF Name | Symbol | DWA Suggested Weighting | Yield | Date Added |
|---|---|---|---|---|
| Invesco S&P Emerging Markets Low Volatility ETF | EELV | 4.500% | 3.3148 | 12/04/2020 |
| Invesco DWA SmallCap Momentum ETF | DWAS | 24.500% | 0.2833 | 12/04/2020 |
| Invesco DWA Momentum ETF | PDP | 24.500% | 0.1697 | 12/04/2020 |
| Invesco DWA Emerging Markets Momentum ETF | PIE | 10.500% | 1.6038 | 12/04/2020 |
| Invesco DWA Developed Markets Momentum ETF | PIZ | 10.500% | 0.8125 | 12/04/2020 |
| Invesco S&P International Developed Low Volatility ETF | IDLV | 4.500% | 5.5603 | 12/04/2020 |
| Invesco S&P 500 Low Volatility ETF | SPLV | 10.500% | 2.2315 | 12/04/2020 |
| Invesco S&P SmallCap Low Volatility ETF | XSLV | 10.500% | 3.3960 | 12/04/2020 |
* - Dates prior to 8/31/15, which is when the Invesco Multi Factor Global Equity Model became available in the Invesco Weekly ETF Report, are representative of when the position was added to the backtested model.
| ETF Name | Symbol | DWA Suggested Weighting | Yield | Date Added |
|---|---|---|---|---|
| Invesco DB Oil Fund | DBO | 50.000% | 2.1878 | 11/13/2020 |
| Invesco DB Base Metals Fund | DBB | 50.000% | 1.5720 | 10/23/2020 |
| ETF Name | Symbol | DWA Suggested Weighting | Yield | Date Added |
|---|---|---|---|---|
| Invesco S&P Global Water Index Fund | CGW | 20.000% | 1.3408 | 08/14/2020 |
| Invesco China Technology ETF | CQQQ | 20.000% | 0.0068 | 07/10/2020 |
| Invesco Buyback Achievers ETF | PKW | 20.000% | 1.6034 | 06/12/2020 |
| Invesco S&P 500 Top 50 ETF | XLG | 20.000% | 1.2810 | 08/15/2016 |
| Invesco Solar ETF | TAN | 20.000% | 0.1074 | 05/29/2020 |
* - Dates prior to 10/14/08, which is when the Invesco Special Opportunities Model ETF Portfolio became available in the Invesco Weekly ETF Report, are representative of when the position was added to the backtested model.
| ETF Name | Symbol | DWA Suggested Weighting | Yield | Date Added |
|---|---|---|---|---|
| Invesco S&P Equal Weight Consumer Discretionary ETF | RCD | 33.333% | 1.1724 | 05/29/2020 |
| Invesco S&P Equal Weight Industrials ETF | RGI | 33.333% | 1.0556 | 12/04/2020 |
| Invesco S&P Equal Weight Technology ETF | RYT | 33.333% | 1.1814 | 05/01/2020 |
* - Dates prior to 8/15/2017, which is when the Invesco Dynamic Equal Weight Sector Model became available in the Invesco Weekly ETF Report, are representative of when the position was added to the backtested model.
| Group | Symbol | Percent | |
|---|---|---|---|
| Cash | CASH$ | 0.00% | |
| Invesco S&P Mid Cap 400 Revenue ETF TR | All US Mid Cap | RWK.TR | 19.99% |
| Invesco S&P Small Cap 600 Revenue ETF TR | All US Small Cap | RWJ.TR | 40.02% |
| Invesco S&P 500 Revenue ETF TR | Growth-Domestic | RWL.TR | 19.99% |
| Invesco S&P Ultra Dividend Revenue ETF TR | Growth & Income | RDIV.TR | 20.00% |
Invesco (Mon.)
Loading, Please Wait...
