
Most Requested Symbols

There were no changes to the KraneShares Dynamic China Rotation Model this week, as each of the holdings continued to maintain sufficient relative strength against the Chinese fixed income representative.
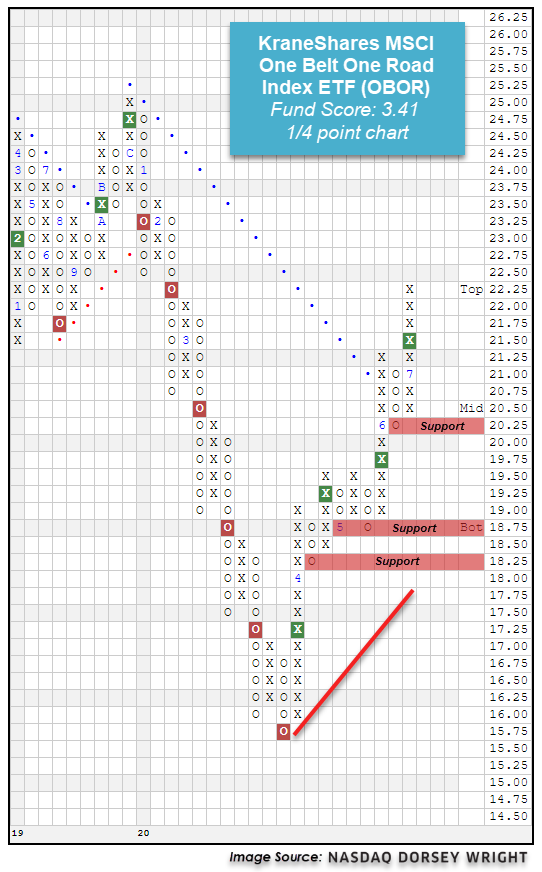
Broad Chinese equities have continued to demonstrate strength over the past week, leading to many areas outside the Chinese borders to benefit from this push higher. One such fund that seeks to capitalize on improvement from the Chinese economy without a specific focus on Chinese equities is the KraneShares MSCI One Belt One Road Index ETF OBOR. This ETF seeks to take advantage of the One Belt One Road initiative from China, which aims at modernizing the original Silk Road trading routes through cooperation agreements with 134 countries and international organizations (source: kraneshares.com).
The fund has shown continued upside participation over the past several weeks, rising off its all-time low of $15.75 in March to give four consecutive buy signals on its more sensitive ¼ point per box chart. OBOR also moved back to a positive trend in early June and has seen its fund score improve drastically to a recent posting of 3.41, which bests the average infrastructure fund of 3.17 as well as the average global equity fund of 3.28, paired with a strongly positive 3.01 score direction. Furthermore, the fund also carries a yield of 4.69% and saw monthly momentum recently flip positive, suggesting the potential for higher prices from here. The overall technical picture of the fund continues to improve, however, those looking to add exposure may be best served by waiting for a pullback or normalization of the trading band as the recent price movement has left OBOR in heavily overbought territory. Initial support can be found on the ¼ point chart at $20.25 with further support offered at $18.75 and $18.25.

The table below is a review of important technical data on a select group of KraneShares ETFs. Significant changes within the past week are highlighted in Green if positive or Red if negative. This portfolio is designed to be used as a "radar" screen to bring your attention to potentially important technical changes that may require your attention and potential action. When evaluating the Fund Score, the strongest issues have scores of 4 or higher while those ETFs with scores below a 3 are no longer considered solid citizens.
| Symbol | Name | Price | Yield (%) | PnF Trend | RS Signal | RS Col. | 200 Day MA | Weekly Mom | OBOS (Weekly) | ||
|---|---|---|---|---|---|---|---|---|---|---|---|
| KALL | KraneShares MSCI All China Index ETF | 30.19 | 1.27 | Positive | Sell | X | 25.43 | +15W |
|
||
| KARS | KraneShares Electric Vehicles & Future Mobility Index ETF | 27.94 | 1.56 | Positive | X | 22.89 | +2W |
|
|||
| KBA | KraneShares Bosera MSCI China A ETF | 39.04 | 1.28 | Positive | Buy | X | 31.90 | +14W |
|
||
| KCCB | KraneShares CCBS China Corporate High Yield Bond USD ETF | 40.02 | 4.76 | Negative | O | 40.05 | -1W |
|
|||
| KCNY | Kraneshares E Fund China Commercial Paper ETF | 32.19 | 2.47 | Negative | Sell | O | 32.09 | +1W |
|
||
| KEMQ | KraneShares Emerging Markets Consumer Technology Index ETF | 27.60 | 1.53 | Positive | X | 23.16 | -1W |
|
|||
| KEMX | KraneShares MSCI Emerging Markets EX China Index ETF | 23.22 | 3.17 | Positive | O | 23.66 | +15W |
|
|||
| KFYP | KraneShares CICC China Leaders 100 Index ETF | 29.66 | 0.17 | Positive | Sell | O | 26.56 | +9W |
|
||
| KGRN | KraneShares MSCI China Environment Index ETF | 26.19 | 4.15 | Positive | X | 18.74 | +14W |
|
|||
| KMED | KraneShares Emerging Markets Healthcare Index ETF | 30.74 | 1.23 | Positive | X | 22.84 | +15W |
|
|||
| KURE | KraneShares MSCI All China Health Care Index ETF | 33.62 | 0.17 | Positive | X | 25.41 | +8W |
|
|||
| KWEB | KraneShares CSI China Internet ETF | 66.75 | 0.06 | Positive | Sell | X | 50.27 | -1W |
|
||
| OBOR | KraneShares MSCI One Belt One Road Index ETF | 22.32 | 4.69 | Positive | O | 21.70 | +15W |
|
The distribution curve places each ETF on a bell curve according to their respective degrees of overbought or oversold status using a 10-week distribution. ETFs that are statistically oversold will appear on the left-hand side of the bell curve, while those that have become statistically overbought will appear on the right-hand side of the bell curve. Perhaps the most useful attribute of this feature is that it displays the entire universe on the curve at one time to give us a general picture of whether the KraneShares ETF universe is generally overbought on a near-term basis, or generally oversold. Our best opportunities are to buy strong relative strength ETFs that have regressed back toward mean conditions based on market weakness, or have become oversold based upon extreme market weakness. Weekly Distribution is a short-term gauge that is most helpful in timing entry and exit points, while the longer-term information of trend and relative strength is a more controlling factor in the decision of whether to buy or sell.
Average Level 110.20
Legend:

The KraneShares Dynamic China Rotation Model is designed to identify major themes in the Chinese marketplace through the use of the Point & Figure relative strength tools. For more information on the portfolio construction and back testing, see the model info file on the models page. (Note: The KraneShares ETF Models will be updated Tuesday mornings by 9:30 am EST)
Weekly Changes:
| ETF Name | Symbol | DWA Suggested Weighting | Yield | Date Added |
|---|---|---|---|---|
| KraneShares CSI China Internet ETF TR | KWEB.TR | 14.286% | 0.0630 | 05/18/2020 |
| KraneShares MSCI All China Health Care Index ETF TR | KURE.TR | 14.286% | 0.1710 | 03/30/2020 |
| KraneShares CICC China Leaders 100 Index ETF TR | KFYP.TR | 14.286% | 0.1730 | 07/06/2020 |
| KraneShares Bosera MSCI China A ETF TR | KBA.TR | 14.286% | 1.3090 | 02/25/2019 |
| KraneShares MSCI All China Index ETF TR | KALL.TR | 14.286% | 1.3060 | 08/29/2016 |
| KraneShares Emerging Markets Consumer Technology Index ETF TR | KEMQ.TR | 14.286% | 1.5440 | 06/08/2020 |
| KraneShares Emerging Markets Healthcare Index ETF TR | KMED.TR | 14.286% | 1.2480 | 11/04/2019 |
* - Dates prior to 10/15/2019, which is when the KraneShares Dynamic China Rotation Model became available on the NDW Research Platform, are representative of when the position was added to the backtested model.
KraneShares (Tue.)
Loading, Please Wait...
