Most Requested Symbols


There are no changes to any of the iShares models this week. As discussed in Tuesday’s report, We have recently seen strength in emerging markets as the iShares Emerging Markets ETF EEM has outperformed the S&P 500 SPX over the last month and the average score of the emerging markets group has moved above 4.0. From a geographical perspective, Asian pacific countries have been one of the major drivers of the recent strength of emerging markets.
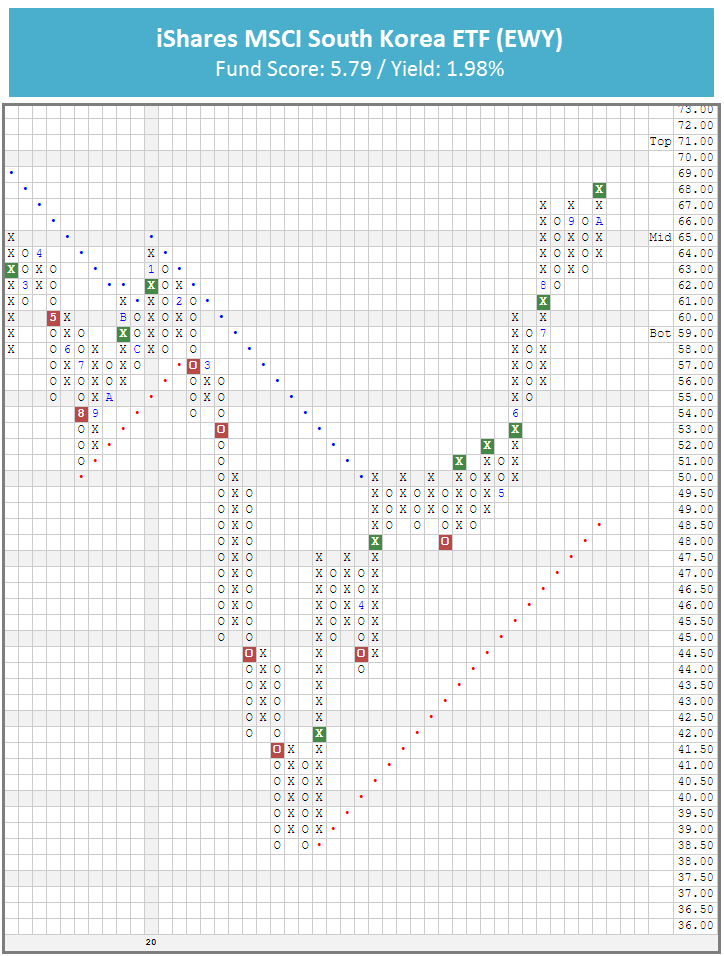
In trading earlier this month, the iShares MSCI South Korea ETF EWY gave a fifth consecutive buy signal when it broke a triple top at $68, marking a new 52-week high for the fund and a recent flip to positive weekly momentum is a positive sign of its potential for additional upside. EWY has a near-perfect 5.79 fund score, 2.46 points better than the average for all non-US equity funds, and a positive 3.66 fund score direction. Year-to-date (through 10/28) EWY has gained 6.18% on a price return basis. The fund also carries a 1.98% yield.
Despite sitting at a 52-week high, EWY remains well within actionable territory with a weekly overbought/oversold reading of 10%, so those interested in adding exposure may do so here. EWY has most recently found support at $63, with additional support found at $62.

This section of the report categorizes select iShares Fixed Income and Currency ETPs by their respective fund groups. Along with each group, you can view the Average Group Score, which is an average of the scores of all funds represented in that particular group. Those iShares ETFs that meet or exceed the Average Group Score will be highlighted in green in order to easily view those ETFs that have superior strength within their respective group. You want to focus on those ETFs that exhibit superior strength when looking to add new exposure to a particular group.
Inflation Protection Bonds
Symbol
Name
Score
Average Group Score: 4.4
TIP
iShares Barclays US Treasury Inflation Protected Securities
4.36
STIP
iShares Barclays 0-5 Year TIPS Bond ETF
3.95
High Yield
Symbol
Name
Score
Average Group Score: 3.9
HYG
iShares iBoxx $ High Yield Corporate Bond ETF
2.42
Corporate Bonds
Symbol
Name
Score
Average Group Score: 3.8
FLOT
iShares Floating Rate Note ETF
3.87
LQD
iShares iBoxx $ Investment Grade Corp. Bond ETF
2.93
Global Fixed Income
Symbol
Name
Score
Average Group Score: 3.7
IGOV
iShares S&P Citigroup International Treasury Bond ETF
5.09
ISHG
iShares S&P Citigroup 1-3 Year Intl. Treas. Bond ETF
4.24
EMB
iShares JP Morgan USD Emerging Markets Bond ETF
3.43
IPFF
iShares S&P International Preferred Stock ETF
2.40
Agency Bonds
Symbol
Name
Score
Average Group Score: 3.6
AGZ
iShares Barclays Agency Bond ETF
2.93
Treasury Bonds
Symbol
Name
Score
Average Group Score: 3.6
GVI
iShares Barclays Intermediate Government/Credit Bond ETF
4.00
TLH
iShares Barclays 10-20 Year Treasury Bond ETF
3.75
SHY
iShares Barclays 1-3 Year Tres. Bond ETF
3.70
GBF
iShares Barclays Government Credit Bond ETF
3.05
IEI
iShares Barclays 3-7 Year Treasury Bond ETF
3.04
IEF
iShares Barclays 7-10 Year Tres. Bond ETF
2.88
SHV
iShares Barclays Short Treasury Bond ETF
2.82
TLT
iShares Barclays 20+ Year Treasury Bond ETF
2.57
Broad Fixed Income
Symbol
Name
Score
Average Group Score: 3.6
IGIB
iShares Trust iShares 5-10 Year Investment Grade Corporate Bond ETF
4.21
AGG
iShares US Core Bond ETF
3.70
MBB
iShares Barclays MBS Fixed-Rate Bond ETF
3.66
USIG
iShares Broad USD Investment Grade Corporate Bond ETF
2.69
IGLB
iShares 10+ Year Investment Grade Corporate Bond ETF
2.56
Municipal Bonds
Symbol
Name
Score
Average Group Score: 3.6
SUB
iShares Short-Term National Muni Bond ETF
3.68
NYF
iShares New York Muni Bond ETF
3.36
MUB
iShares National Municipal Bond ETF
2.64
CMF
iShares California Municipal Bond ETF
1.48
The distribution curve places each ETF on a bell curve according to their respective degrees of overbought or oversold status using a 10-week distribution. ETFs that are statistically oversold will appear on the left-hand side of the bell curve, while those that have become statistically overbought will appear on the right-hand side of the bell curve. Perhaps the most useful attribute of this feature is that it displays the entire universe on the curve at one time with an "average level" to give us a general picture of whether the iShare ETF universe is generally overbought on a near-term basis, or generally oversold. Our best opportunities are to buy strong market ETFs that have regressed back toward mean conditions based on market weakness, or have become oversold based upon extreme market weakness.
Weekly Distribution is a short-term gauge that is most helpful in timing entry and exit points, while the longer-term information of trend and relative strength is a more controlling factor in the decision of whether to buy or sell. The Distribution Curve below displays those ETFs with positive RS in uppercase letters and those ETFs with poor RS versus the market in lowercase letters. As well, those ETFs that are on a Point & Figure Buy signal appear in Green letters, while those on Sell signals can appear in Red letters. Box Color indicates the Sector Status Rating. Green = Favored, Yellow = Average, and Red = Unfavored.
Average Level
-47.27
| <--100 | -100--80 | -80--60 | -60--40 | -40--20 | -20-0 | 0-20 | 20-40 | 40-60 | 60-80 | 80-100 | 100-> | |||
 |
||||||||||||||

This section of the report categorizes select iShares ETFs by their respective broad group. Along with each group, you can view the Average Group Score, which is an average of the scores of all funds represented in that particular group. Those iShares ETFs that meet or exceed the Average Group Score will be highlighted in green in order to easily view those ETFs that have superior strength within their respective group. You want to focus on those ETFs that exhibit superior strength when looking to add new exposure to a particular group.
| Large Cap Funds | Symbol | Name | Score |
|---|---|---|---|
| Average Group Score: 3.8 | IWY | iShares Russell Top 200 Growth ETF | 5.62 |
| IVW | iShares S&P 500 Growth ETF | 5.56 | |
| OEF | iShares S&P 100 ETF | 5.40 | |
| IYY | iShares Dow Jones U.S. ETF | 4.44 | |
| IWL | iShares Russell Top 200 ETF | 4.38 | |
| IWB | iShares Russell 1000 ETF | 4.31 | |
| IVV | iShares S&P 500 Index | 4.12 | |
| IWD | iShares Russell 1000 Value ETF | 2.54 | |
| IVE | iShares S&P 500 Value ETF | 2.32 | |
| IWX | iShares Russell Top 200 Value ETF | 2.19 |
| Small Cap Funds | Symbol | Name | Score |
|---|---|---|---|
| Average Group Score: 3.8 | IWO | iShares Russell 2000 Growth ETF | 5.43 |
| IJT | iShares S&P SmallCap 600 Growth ETF | 4.61 | |
| IWM | iShares Russell 2000 ETF | 3.10 | |
| IWN | iShares Russell 2000 Value ETF | 2.80 | |
| IJR | iShares S&P SmallCap 600 Index Fund | 2.80 | |
| IJS | iShares S&P SmallCap 600 Value ETF | 2.75 |
| Global Funds | Symbol | Name | Score |
|---|---|---|---|
| Average Group Score: 3.5 | EEM | iShares MSCI Emerging Markets ETF | 4.93 |
| BKF | iShares MSCI BRIC ETF | 4.91 | |
| JPXN | iShares JPX-Nikkei 400 ETF | 3.35 | |
| EPP | iShares MSCI Pacific ex-Japan Index Fund | 2.64 | |
| EFA | iShares MSCI EAFE ETF | 2.23 | |
| IEV | iShares Europe ETF | 1.92 | |
| ILF | iShares S&P Latin America 40 ETF | 0.50 |
| Mid Cap Funds | Symbol | Name | Score |
|---|---|---|---|
| Average Group Score: 3.4 | IWP | iShares Russell Midcap Growth ETF | 5.62 |
| IJK | iShares S&P MidCap 400 Growth ETF | 5.15 | |
| IWR | iShares Russell Midcap ETF | 4.36 | |
| IJH | iShares S&P MidCap 400 Index Fund | 3.06 | |
| IWS | iShares Russell Midcap Value ETF | 2.87 | |
| IJJ | iShares S&P MidCap 400 Value ETF | 2.72 |
| Sector Funds | Symbol | Name | Score |
|---|---|---|---|
| Average Group Score: 3.2 | IGV | iShares North American Tech-Software ETF | 5.70 |
| IYK | iShares U.S. Consumer Goods ETF | 5.67 | |
| ITB | iShares U.S. Home Construction ETF | 5.57 | |
| IHI | iShares U.S. Medical Devices ETF | 5.53 | |
| SOXX | iShares PHLX Semiconductor ETF | 5.48 | |
| IYW | iShares U.S. Tech. ETF | 5.33 | |
| IYC | iShares U.S. Consumer Services ETF | 5.17 | |
| IHF | iShares U.S. Healthcare Providers ETF | 4.42 | |
| IBB | iShares NASDAQ Biotech ETF | 4.16 | |
| IYJ | iShares U.S. Industrial ETF | 4.10 | |
| IYM | iShares U.S. Basic Materials ETF | 4.01 | |
| IYH | iShares U.S. Healthcare ETF | 3.95 | |
| IYT | iShares U.S. Transportation ETF | 3.94 | |
| IAI | iShares U.S. Broker Dealers & Securities Exchanges ETF | 3.73 | |
| IAI | iShares U.S. Broker Dealers & Securities Exchanges ETF | 3.73 | |
| IYF | iShares U.S. Financial ETF | 3.27 | |
| IHE | iShares U.S. Pharmaceuticals ETF | 3.26 | |
| IDU | iShares U.S. Utilities ETF | 2.99 | |
| IAT | iShares U.S. Regional Banks ETF | 2.54 | |
| ICF | iShares Cohen & Steers Realty ETF | 2.24 | |
| IYZ | iShares U.S. Telecom ETF | 1.69 | |
| IGN | iShares North American Tech-Multimedia Networking ETF | 1.25 | |
| ITA | iShares U.S. Aerospace & Defense ETF | 1.22 | |
| IAK | iShares U.S. Insurance ETF | 1.07 | |
| IGE | iShares North American Natural Resources ETF | 0.33 | |
| IEZ | iShares U.S. Oil Equip. & Svcs. ETF | 0.16 | |
| IEO | iShares U.S. Oil & Gas Exploration & Production ETF | 0.11 | |
| IYE | iShares U.S. Energy ETF | 0.10 |
Weekly Updates: No changes.
| ETF Name | Symbol | DWA Suggested Weighting | Yield | Date Added |
|---|---|---|---|---|
| iShares Expanded Tech Sector ETF | IGM | 12.500% | 0.4200 | 03/04/2009 |
| iShares North American Tech-Software ETF | IGV | 12.500% | 0.3990 | 11/07/2007 |
| iShares U.S. Consumer Services ETF | IYC | 12.500% | 0.7780 | 04/28/2010 |
| iShares U.S. Healthcare ETF | IYH | 12.500% | 1.2390 | 04/22/2020 |
| iShares U.S. Industrial ETF | IYJ | 12.500% | 1.2270 | 02/09/2011 |
| iShares U.S. Transportation ETF | IYT | 12.500% | 1.1700 | 09/16/2020 |
| iShares U.S. Tech. ETF | IYW | 12.500% | 0.6630 | 03/04/2009 |
| iShares PHLX Semiconductor ETF | SOXX | 12.500% | 1.0560 | 06/18/2014 |
| ETF Name | Symbol | DWA Suggested Weighting | Yield | Date Added |
|---|---|---|---|---|
| iShares North American Tech-Software ETF | IGV | 12.500% | 0.3990 | 01/27/2016 |
| iShares S&P 500 Index | IVV | 12.500% | 1.7990 | 09/16/2020 |
| iShares U.S. Consumer Services ETF | IYC | 12.500% | 0.7780 | 04/29/2010 |
| iShares U.S. Industrial ETF | IYJ | 12.500% | 1.2270 | 10/07/2020 |
| iShares U.S. Transportation ETF | IYT | 12.500% | 1.1700 | 09/09/2020 |
| iShares U.S. Medical Devices ETF | IHI | 12.500% | 0.2800 | 01/20/2016 |
| iShares U.S. Home Construction ETF | ITB | 12.500% | 0.4440 | 05/20/2020 |
| iShares PHLX Semiconductor ETF | SOXX | 12.500% | 1.0560 | 08/28/2019 |
| ETF Name | Symbol | DWA Suggested Weighting | Yield | Date Added |
|---|---|---|---|---|
| iShares MSCI Switzerland ETF | EWL | 20.000% | 1.5940 | 03/11/2020 |
| iShares MSCI Netherlands ETF | EWN | 20.000% | 0.9650 | 03/04/2020 |
| iShares MSCI Taiwan ETF | EWT | 20.000% | 2.2480 | 12/04/2019 |
| iShares MSCI New Zealand ETF | ENZL | 20.000% | 2.6717 | 05/22/2019 |
| iShares Dow Jones U.S. ETF | IYY | 20.000% | 1.5540 | 08/29/2018 |
iShares Fixed Income Model ISHRFIXED
ETF Name
Symbol
DWA Suggested Weighting
Yield
Date Added
iShares 10+ Year Investment Grade Corporate Bond ETF
IGLB
20.000%
3.4380
07/22/2020
iShares International High Yield Bond ETF
HYXU
20.000%
1.1820
07/29/2020
IShares Emerging Markets High Yield Bond ETF
EMHY
20.000%
5.8990
05/27/2020
iShares iBoxx $ Investment Grade Corp. Bond ETF
LQD
20.000%
2.8650
07/01/2020
iShares Preferred & Income Securities ETF
PFF
20.000%
5.4369
04/15/2020
iShares (Thurs.)
Loading, Please Wait...
