Most Requested Symbols

An update on a previously published study that looks at forecasting volatility using the S&P 500 Volatility Index (VIX) and the VIX Volatility Index (VVIX)
NDW Morning Pulse - October 9, 2026
Below are highlights from the NDW Morning Update Video for the morning of 10/08. Access the video on the NDW Morning Update Video page.
The S&P 500 Index (SPX) declined 0.22% on 10/7, followed by the Dow Jones Industrial Average (.DJIA), which fell 0.66%. International equities also weakened, with the iShares Emerging Markets ETF down 1.32% for the day.
The Ten week for the S&P 500 (^TWSPX) reversed back up into Xs from washed out levels, signaling an increase in near-term participation. However, the bullish percent for the S&P 500 (^BPSPX) remains in a column of Os, as the intermediate-term participation remains on fragile footing.
Futures markets are currently pricing in more than an 80% chance of a rate hike at the December 9, 2026 Fed meeting. Higher rate expectations could weigh on growth-oriented sectors, which tend to be more sensitive to changes in interest rates.
On the earnings front, a few major companies are expected to report earnings over the next week: Taiwan Semiconductor (TSM 5/5 TA Score on 10/15), J.P. Morgan Chase & Co. (JPM 4/5 TA Score on 10/13), and ASML Holding (ASML 4/5 TA on 10/14).
Yesterday’s research highlighted the latest ETF leaders over Q3. The last quarter’s performance was driven primarily by technology, energy, and biotechnology-related ETFs, although leadership rotated beneath the surface and some tech segments, particularly semiconductors, struggled. Looking year-to-date, technology remains the dominant theme despite recent weakness, while China, metals, homebuilders, and other cyclical areas have been persistent laggards, highlighting the importance of focusing on sustained momentum trends rather than short-term performance swings.

About a month ago, we published an article titled “Volatility on the Horizon?” which is based on a study called “Forecasting a Volatility Tsunami” in which the author examines forecasting a spike in volatility using the CBOE S&P 500 Volatility Index (VIX). The paper found that spikes in volatility are typically preceded by extended periods when the VIX is subdued. The author attempted to improve reliability by including the CBOE VIX Volatility Index (VVIX), which measures the expected volatility of the VIX itself, i.e., the volatility of volatility. They found that almost every large spike in volatility had been preceded by the 20-day standard deviation of the VIX and VVIX simultaneously falling to extreme low levels, which they defined as below the 15th percentile.
The original paper and our updated study looked only at the increase in volatility around these periods. But after we published the article we received requests to look at how the market behaved during these periods. So, today we have updated our study to include the most recent period of low VIX & VVIX readings and looked at the drawdown the S&P has experienced around these periods.
The chart below shows the daily closing values of the VIX, and, in red, the times when VIX and VVIX’s 20-day standard deviation were below the 15th percentile. As you can see, there have been multiple occasions when both indexes breached the 15th percentile threshold since the end of the original study period in 2016. In some instances, there were relatively moderate volatility spikes, while other times, like early 2018, the VIX rose by more than 100%. You will also notice that there is a cluster of red at the end of the graph as both indexes’ 20-day standard deviation fell below the 15th percentile in the final week of August through the first week of September.

To get a clearer picture of how the VIX behaves following periods when both index’s 20-day standard deviation falls below the 15th percentile, we looked out at the maximum increase and decrease in the VIX over the next 30 days. Because the sub-15 periods are often clusters of days, we looked 30 days forward from both the beginning of the cluster and the end of the cluster (only in two instances were there single-day periods.) The results are summarized in the table below and as you can see there was a noticeable bias towards the VIX rising over the next 30 days with an average increase of 28% from the beginning of the sub-15 period reading and a 46% average increase from the end of the period.

For this study we also looked at how the S&P has behaved around these periods. Volatility spikes are typically accompanied by declines in the equity market. To get an idea of the magnitude of these drawdowns we took a similar approach to measuring the spike in volatility. We looked at the max drawdown in the S&P 500 over the 30 days from the beginning and end of each sub-15 period. As the table below shows, the S&P has experienced an average drawdown of about 2.8% after a sub-15 period ends. As previously mentioned, the most recent sub-15 period happened in late August/early September, from the start of that period on the S&P experienced a max drawdown of 2.32%. From a percentage standpoint, the change in the S&P is not nearly as large as seen in the VIX, that being said, a drawdown of 2.8% is more than we expect to see in a typical 30-day period.

Average Level
-34.16
| < - -100 | -100 - -80 | -80 - -60 | -60 - -40 | -40 - -20 | -20 - 0 | 0 - 20 | 20 - 40 | 40 - 60 | 60 - 80 | 80 - 100 | 100 - > |
|---|---|---|---|---|---|---|---|---|---|---|---|
|
Sell signalief
|
|||||||||||
|
Sell signalfxe
|
|||||||||||
|
Sell signalhyg
|
Buy signalefa
|
||||||||||
|
Sell signalagg
|
Buy signaldia
|
||||||||||
|
Sell signaltlt
|
Buy signalijr
|
Buy signalIJH
|
Buy signalgcc
|
Buy signalxlg
|
|||||||
|
Buy signalicf
|
Sell signalshy
|
Buy signaliwm
|
Buy signalgld
|
Sell signalUSO
|
Buy signalGSG
|
Buy signalONEQ
|
|||||
|
Sell signallqd
|
Sell signaldvy
|
Buy signalrsp
|
Buy signalVOOV
|
Sell signalEEM
|
Buy signalSPY
|
Buy signalVOOG
|
Buy signalQQQ
|
Buy signaldx/y
|
|||
| < - -100 | -100 - -80 | -80 - -60 | -60 - -40 | -40 - -20 | -20 - 0 | 0 - 20 | 20 - 40 | 40 - 60 | 60 - 80 | 80 - 100 | 100 - > |
| AGG | iShares US Core Bond ETF |
| USO | United States Oil Fund |
| DIA | SPDR Dow Jones Industrial Average ETF |
| DVY | iShares Dow Jones Select Dividend Index ETF |
| DX/Y | NYCE U.S.Dollar Index Spot |
| EFA | iShares MSCI EAFE ETF |
| FXE | Invesco CurrencyShares Euro Trust |
| GLD | SPDR Gold Trust |
| GSG | iShares S&P GSCI Commodity-Indexed Trust |
| HYG | iShares iBoxx $ High Yield Corporate Bond ETF |
| ICF | iShares Cohen & Steers Realty ETF |
| IEF | iShares Barclays 7-10 Yr. Tres. Bond ETF |
| LQD | iShares iBoxx $ Investment Grade Corp. Bond ETF |
| IJH | iShares S&P 400 MidCap Index Fund |
| ONEQ | Fidelity Nasdaq Composite Index Track |
| QQQ | Invesco QQQ Trust |
| RSP | Invesco S&P 500 Equal Weight ETF |
| IWM | iShares Russell 2000 Index ETF |
| SHY | iShares Barclays 1-3 Year Tres. Bond ETF |
| IJR | iShares S&P 600 SmallCap Index Fund |
| SPY | SPDR S&P 500 Index ETF Trust |
| TLT | iShares Barclays 20+ Year Treasury Bond ETF |
| GCC | WisdomTree Continuous Commodity Index Fund |
| VOOG | Vanguard S&P 500 Growth ETF |
| VOOV | Vanguard S&P 500 Value ETF |
| EEM | iShares MSCI Emerging Markets ETF |
| XLG | Invesco S&P 500 Top 50 ETF |

| Symbol | Company | Sector | Current Price | Action Price | Target | Stop | Notes |
|---|---|---|---|---|---|---|---|
| AME | Ametek Inc | Electronics | $248.62 | mid 230s - mid 250s | 342 | 204 | 4 for 5'er, LT pos mkt RS, bullish catapult, buy on pullback, R-R>2.0, Earn. 10/29 |
| CENTA | Central Garden & Pet Company | Household Goods | $34.74 | mid-to-hi 30s | 48 | 31 | 4 for 5'er, favored HOUS sector, LT pos peer RS, spread quad top, buy on pullback |
| CLH | Clean Harbors Inc | Waste Management | $315.54 | 310s - 320s | 356 | 288 | 5 for 5'er, #3 of 22 in WAST sector matrix, LT pos peer & mkt RS |
| ASC | Ardmore Shipping Corporation | Transports/Non Air | $18.48 | 17 - 19 | 24 | 15.50 | 5 for 5'er, top 20% of favored TRAN sector matrix, triple top, good R-R, 7.5% yield |
| MTCH | Match Group, Inc. | Leisure | $40.84 | low-to-mid 40s | 55 | 36 | 4 for 5'er, top 20% of LEIS sector matrix, one box from RS buy, triple top, 1.8% yield, Earn. 11/3 |
| FTNT | Fortinet Inc. | Software | $189.28 | hi 160s - hi 170s | 226 | 142 | 5 for 5'er, top third of favored SOFT sector matrix, LT pos mkt RS, spread quad top, Earn. 10/28 |
| CSTL | Castle Biosciences, Inc. | Biomedics/Genetics | $33.00 | 32 - 35 | 63.50 | 28 | 4 for 5'er, top 10% of favored BIOM sector matrix, multiple buy signals, pos trend flip, R-R~4.0, Earn. 11/2 |
| ANET | Arista Networks Inc | Telephone | $215.83 | 190s - mid 210s | 262 | 178 | 5 for 5'er, top quintile of Telephone matrix, pos. trend, matched ATH on 9/25. |
| ABBV | AbbVie Inc. | Drugs | $271.36 | 250s - 260s | 302 | 216 | 5 for 5'er, top third of favored DRUG sector matrix, LT pos peer & mkt RS, triple top, 2.6% yield, Earn. 10/30 |
| ACT | Enact Holdings Inc | Finance | $45.82 | low-to-mid 40s | 69 | 37 | 5 for 5'er, top 25% of FINA sector matrix, LT pos trend & mkt RS, triple top, heavily oversold |
| LPG | Dorian LPG Limited | Oil Service | $56.21 | 53 - 59 | 69 | 47 | 5 for 5'er since July, top quintile of Oil Svcs. matrix, pos. trend, consolidating below high at $59. |
| TNK | Teekay Tankers, Ltd. | Transports/Non Air | $102.12 | hi 90s - low 100s | 133 | 83 | 5 for 5'er, top 10% of TRAN sector matrix, multiple buy signals, 1% yield. |
| ELF | Elf Beauty Inc | Household Goods | $105.03 | 98 - 110 | 123 | 90 | 5 for 5'er since Aug., ranked 1st in Hous. Goods matrix, pos. trend, Earn. 11/4 |
| NVT | nVent Electric plc | Electronics | $167.82 | 160s | 206 | 142 | 5 for 5'er, top 10% of ELEC sector matrix, LT pos peer & mkt RS, buy on pullback, Earn. 10/30 |
| NVDA | NVIDIA Corporation | Semiconductors | $237.47 | 220 - 240 | 300 | 204 | 4 for 5'er, top third of Semis matrix, pos. ST Mkt and Peer RS, ATH on 10/2. |
| Symbol | Company | Sector | Current Price | Action Price | Target | Stop | Notes |
|---|---|---|---|---|---|---|---|
| ADBE | Adobe Systems Incorporated | Software | $232.77 | (230s - 240s) | 192 | 268 | 2 for 5'er, bottom 25% of SOFT sector matrix, LT neg mkt & peer RS, spread triple bottom |
| Comment | |||||||
|---|---|---|---|---|---|---|---|
|
|
|||||||
NVDA NVIDIA Corporation R ($230.33) - Semiconductors - NVDA improved to a 4 for 5’er after seeing the market RS chart return to a column of Xs to kick off October, highlighting positive near-term relative strength against the broader equity space. Along with positive long-term market RS, NVDA maintains positive near-term peer RS and ranks within the top third of the Semiconductors sector matrix. On the trend chart, NVDA has maintained a positive trend since August this year and returned to a buy signal at $236 to kick off October as shares moved to a new chart high at $240. Okay to consider in the $220 to $240. The bullish price objective of $300 will serve as the price target, while the initial stop loss will be set for $204.
| 240.00 | X | 240.00 | |||||||||||||||||||||||||||
| 236.00 | X | A | 236.00 | ||||||||||||||||||||||||||
| 232.00 | X | O | X | X | X | 232.00 | |||||||||||||||||||||||
| 228.00 | X | O | X | O | X | X | O | X | 228.00 | ||||||||||||||||||||
| 224.00 | X | O | 6 | O | X | X | O | X | O | X | 224.00 | ||||||||||||||||||
| 220.00 | X | O | X | O | X | O | X | O | X | O | X | Mid | 220.00 | ||||||||||||||||
| 216.00 | X | X | O | X | O | • | X | O | X | 9 | O | X | 216.00 | ||||||||||||||||
| 212.00 | X | O | X | O | O | X | X | X | • | X | O | X | O | 212.00 | |||||||||||||||
| 208.00 | X | O | X | O | X | O | X | O | X | O | X | O | • | 208.00 | |||||||||||||||
| 204.00 | X | O | X | O | X | O | X | O | X | O | 8 | • | 204.00 | ||||||||||||||||
| 200.00 | X | O | X | O | O | X | X | X | O | X | O | X | • | 200.00 | |||||||||||||||
| 198.00 | X | 5 | X | O | X | O | X | O | X | O | O | X | • | 198.00 | |||||||||||||||
| 196.00 | X | O | O | X | O | X | O | X | O | X | • | 196.00 | |||||||||||||||||
| 194.00 | X | O | X | 7 | O | X | • | O | X | • | 194.00 | ||||||||||||||||||
| 192.00 | X | O | X | O | • | O | • | 192.00 | |||||||||||||||||||||
| 190.00 | X | O | • | • | 190.00 | ||||||||||||||||||||||||
| 188.00 | • | X | • | 188.00 | |||||||||||||||||||||||||
| 186.00 | O | • | X | • | 186.00 | ||||||||||||||||||||||||
| 184.00 | O | • | X | • | 184.00 | ||||||||||||||||||||||||
| 182.00 | O | X | • | 182.00 | |||||||||||||||||||||||||
| 180.00 | O | X | X | • | 180.00 | ||||||||||||||||||||||||
| 178.00 | O | X | O | X | • | Bot | 178.00 | ||||||||||||||||||||||
| 176.00 | O | X | O | 4 | • | 176.00 | |||||||||||||||||||||||
| 174.00 | O | X | O | X | • | 174.00 | |||||||||||||||||||||||
| 172.00 | O | O | X | • | 172.00 | ||||||||||||||||||||||||
| 170.00 | O | X | • | 170.00 | |||||||||||||||||||||||||
| 168.00 | O | X | • | 168.00 | |||||||||||||||||||||||||
| 166.00 | O | • | 166.00 |
| DINO HF Sinclair Corporation ($119.87) - Oil Service - DINO returned to a buy signal and reached a new all-time high Thursday when it broke a double top at $120. Thursday's action adds to an already positive technical picture as DINO is a 5 for 5'er that ranks in the top decile of the oil service sector matrix. From here, the first level of support sits at $104. |
| FANG Diamondback Energy Inc ($191.80) - Oil - After giving two consecutive sell signals, FANG returned to a buy signal Thursday when it broke a double top at $192. Thursday's move adds to a modestly positive technical picture as FANG is a 3 for 5'er. From here, the next test for the stock is its bearish resistance line at $200. |
| SBUX Starbucks Corporation ($91.14) - Restaurants - SBUX broke a double bottom at $92 for a second sell signal as shares fell to $88. This break follows the stock moving into a negative trend and will cause the market RS chart to reverse down into Os, dropping the stock down to a 1 for 5'er. The move into the upper $80s puts SBUX in oversold territory, below the bottom of the 10-week trading band. From here, support now lies at $86. |
| WDC Western Digital Corporation ($393.31) - Computers - Shares of WDC broke a double bottom at $396 for its third consecutive sell signal. The 3 for 5'er has moved consistently lower over the last couple months, with it losing near-term relative strength as well. WDC remains more of a hold for now, but investors should remain very watchful for further weakness given its precarious technical situation. From here, initial support lies at $376. |

The option suggestions featured here are pulled from the NDW Options Ideas tool. These are just a sample of the ideas that can be found there. The Options Idea tool contains numerous additional income and speculative plays. It also offers relative strength-based screens targeting the highest (and lowest) relative strength stocks and ETFs that have recently moved counter to their longer-term trend. To access or subscribe to the Options Ideas tool, click here.
Call
Phillip Morris International Inc. (PM) Jan 15 $200 Call

| Addiitional Data: | |
| Bid/Ask Spread | 5.34% |
| Delta | 58.41 |
| Gamma | 1.36 |
| Implied Volatility | 28.48% |
| Expiry Date | 99 |
| Earnings Date | 10/21/2026 |
Put
Chipotle Mexican Grill 'A' (CMG) Jan 15 $35 Put

| Additional Data: | |
| Bid/Ask Spread | 9.86% |
| Delta | -55.28 |
| Gamma | 5.75 |
| Implied Volatility | 40.42% |
| Expiry Date | 99 |
| Earnings Date | 10/28/2026 |
Income
Morgan Stanely (MS) Nov 20 $175 Short Put
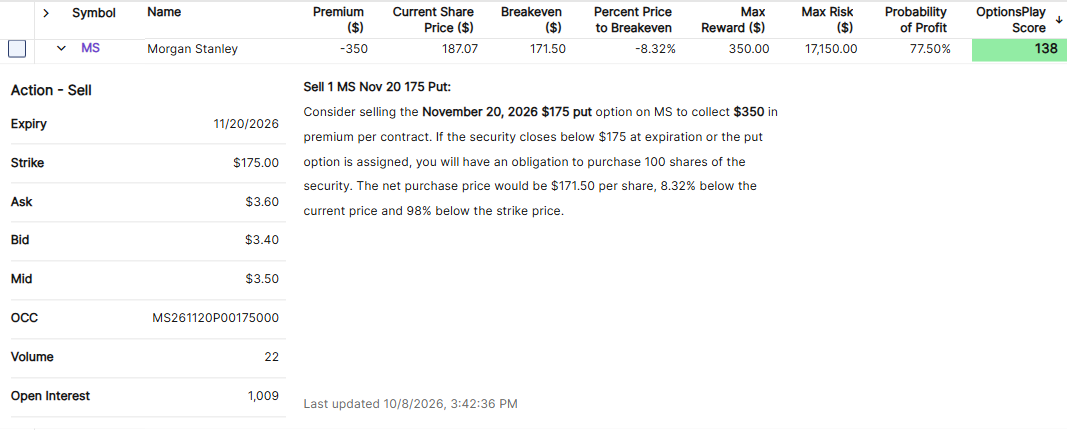
| Additional Data: | |
| Ann. Static Return | 17.30% |
| Bid/Ask Spread | 5.88% |
| Delta | 25.20 |
| Gamma | -1.46 |
| Implied Volatility | 31.35% |
| Expiry Date | 43 |
| Earnings Date | 10/14/2026 |
Daily Equity & Market Analysis
Loading, Please Wait...

