As we do each quarter, we will take today’s report to look across different asset classes and focus on the best and worst performing funds for the third quarter.
As we do each quarter, we will take today’s report to look across different asset classes and focus on the best- and worst-performing funds for the third quarter and year to date. Note, during our screen, we filtered out leveraged and inverse funds while implementing minimum volume and AUM requirements to focus solely on those funds most likely to come across your desk. We also did our best to avoid similar kinds of funds, when possible, but there will likely be similar themes during our analysis. Note, “similar” can take on a wide range of definitions. For example, different weighting methodologies can produce vastly different returns, so we won’t exclude an equally weighted tech fund if a cap weight option is already on the list.
We will start broadly by peering across all the different asset groups at once. Despite some rotation underneath the hood of the sector, it might come as a surprise that the top ten have several different-technology-focused names across our best performing funds. Outside of “extended” technology, leading performers also came from energy as unrest in the Middle East pushed energy names back and forth. Biotechnology was also a leader, with standout performances pushing healthcare options towards the top of NDW’s rankings. Side note, it is also interesting to see focused magnificent seven fund MAGS in the top ten as market has narrowed. In the bottom ten, there were several other tech options which struggled (semiconductors included) in Q3. China makes up the only pure international representative of the group, as well as homebuilders, clean energy, and a handful of other industrial metals focused names.
For the year, leaders include more technology options as the sector maintains a strong long-term posture. Asia (sans China) has a handful of top performers as well, rounding out or all funds yearly performance table with representation across the global investment landscape. Towards the downside, China remains a point of weakness, followed by the likes of metals, long-duration treasures, home builders, consumer discretionary names, among a few others. One takeaway from this table is that some technology struggled in Q3, but remains quite strong so far in 2026. Keep this in mind as you discuss positions/performance with clients in end of year discussions.

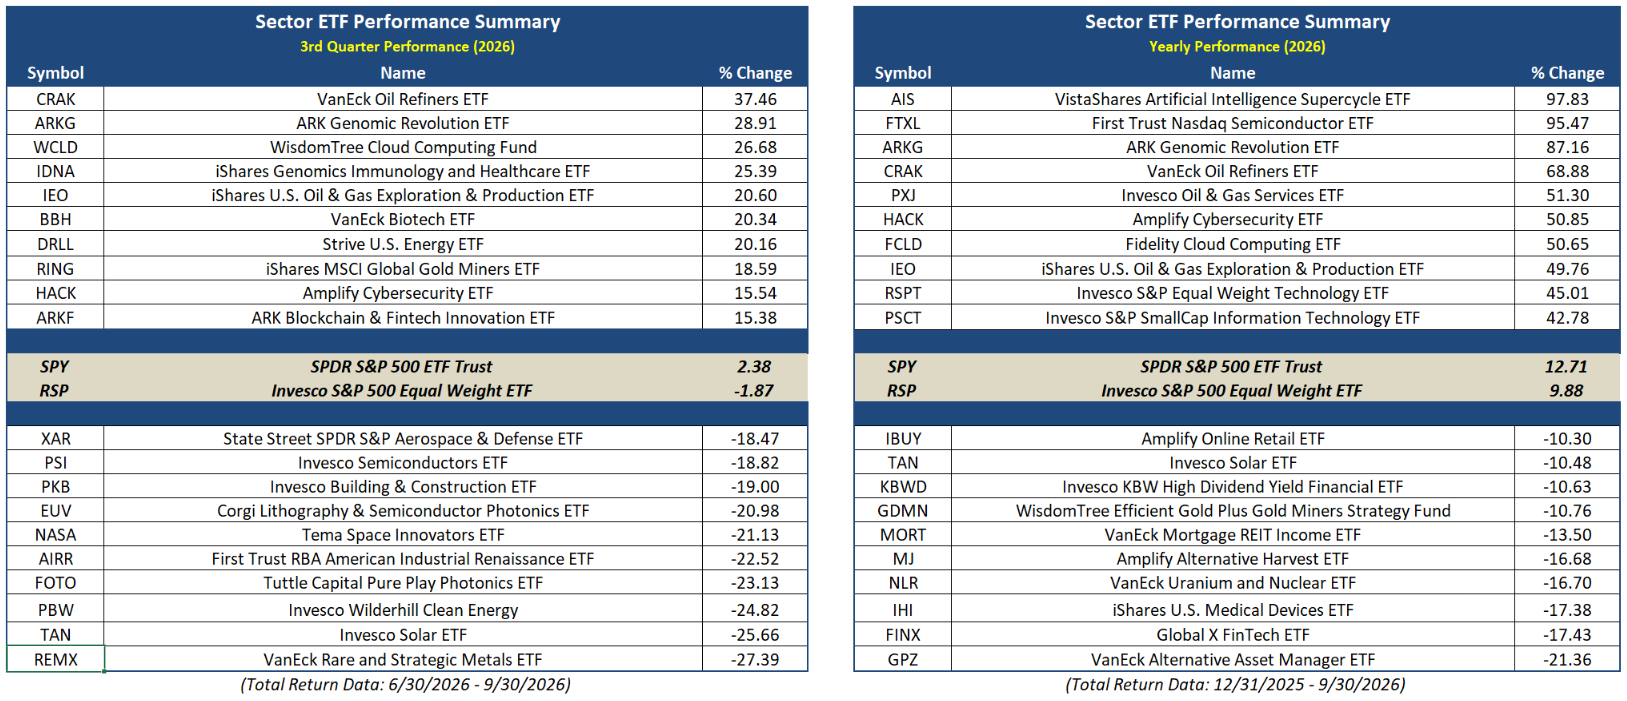
We can also focus more specifically on individual sectors to identify possible points of strength/weakness on a more granular level. Some high-level touchpoints: performance leaders in Q3 (energy, some tech, etc.) fell largely in line with major themes for the entire year. Towards the downside, quarterly laggards included a handful of industrial options as the sector lost strength quickly (homebuilders, aerospace and defense, etc.), as well as clean energy, metals, and semiconductor areas. Besides the semiconductor struggles, Q3’s laggards followed similar themes to losers for the majority of 2026. Remember, consistent winners and losers can lead to productive momentum environments.
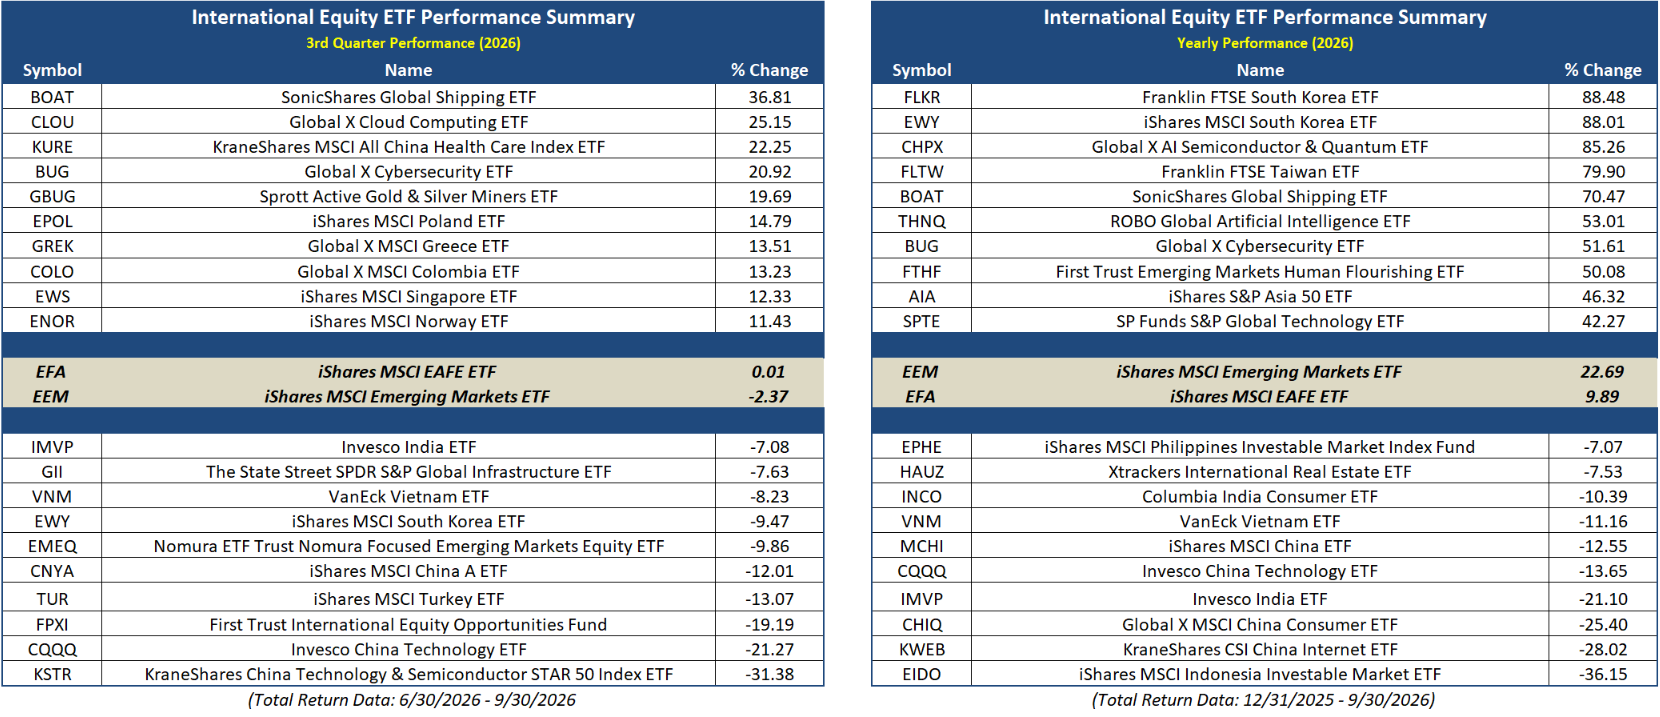
As it is at the top of the NDW DALI broad asset level rankings, we can also hone in specifically on the international asset class to help identify what parts of the globe are winning and losing. After all, the international asset class has gained some favor (and popularity) over the course of the last few years… and you need to have a list of possible names if clients come asking about their possible exposure. For Q3, the top ten points of strength included options largely from Europe, with the remainder coming from general tech/Chinese healthcare. This strength from China in Q3 was rather isolated, seeing other representatives litter the bottom 10 of both quarterly and yearly performance. For the year, other Asia-Pacific areas (South Korea, Taiwan) lead the way to the upside, while previously mentioned China and India are laggards so far in 2026.