The market has been supported by the largest stocks over the last several years, with the mega cap technology titans consistently pushing the markets to new heights. But this year has been different, and relative strength is finally starting to shift away from the largest companies.
The market has been supported by the largest stocks over the last several years, with the mega cap technology titans consistently pushing the markets to new heights. But this year has been different, and relative strength is finally starting to shift away from the largest companies.
Looking at the Invesco S&P 500 Top 50 ETF (XLG), the fund has put together a surpassingly slow start to the year. While the S&P 500 is up around 10%, the mega cap representative has gone up by a meager 2.5%, trailing the S&P 500 equal weight index by around 10% as well. Even going back to the end of October, the fund has gone essentially nowhere over the last nine months, with it currently sitting within 1.5% of its price at that time. All of this stagnation within mega caps has resulted in several notable relative strength developments.
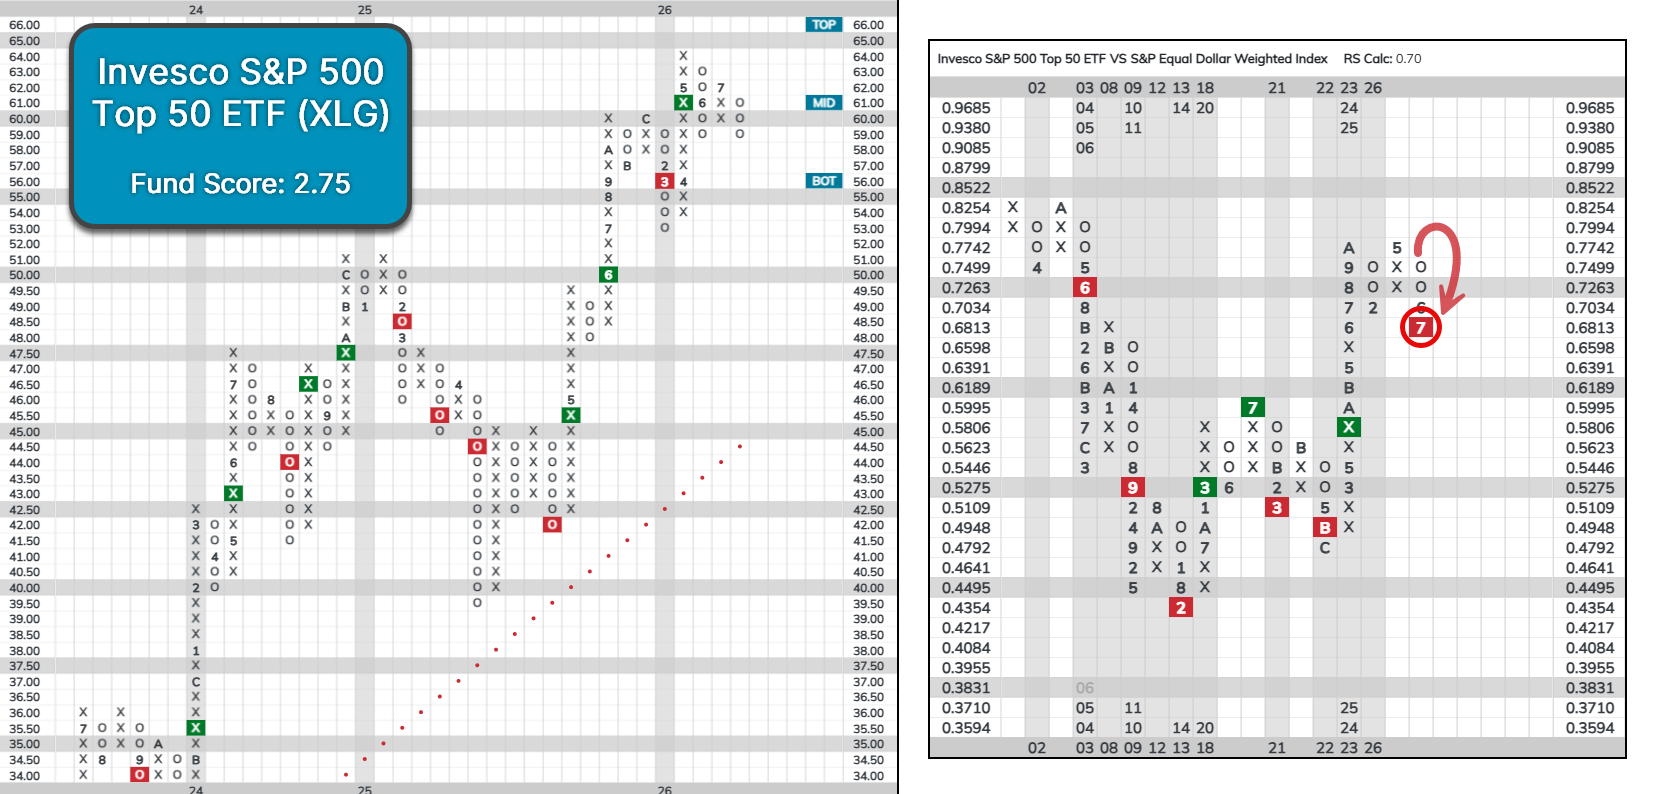
While XLG is still on a buy signal, it has consolidated notably over the last several months. On a relative basis, the fund lost near-term relative strength versus the S&P 500 equal weight index. Following that reversal, the fund moved to its first market RS sell signal since 2022, underscoring the intensity of relative strength deterioration of the mega caps in recent months.
Given these RS changes, XLG has also seen its fund score cut in half from its highs. On May 19th, XLG displayed a fund score of 5.59, which is in line with where it has been for several years. The last time XLG held a fund score below 3.5 was in early 2023… until now. XLG currently holds a fund score of 2.75, sitting below the acceptable 3.0 threshold for the first time in almost four years, marking a significant departure from its prior strength. XLG’s fund score is even more notable in the context of the average stock. The Invesco S&P 500 Equal Weight ETF (RSP) has held a mediocre fund score below 3.5 for the last two and a half years, but recent action saw RSP’s score move above that level. RSP now holds more strength than XLG for the first time since 2023 as well. So, while mega caps have been weakening, the averages joes of the market have strengthened.

Recent weakness within mega caps has been primarily at the hands of the mega cap growth companies, with semiconductor manufacturers and other tech titans pulling back. The Nasdaq-100 moved to a sell signal last week for the first time since March, briefly entering correction territory. Additionally, the index also lost near-term market relative strength, reversing into a column of Os against the S&P 500 equal weight index (SPXEWI). Looking at the Invesco QQQ Trust (QQQ), its fund score has dropped nearly 1.5 points from its peak in May. That said, the index continues to hold long-term market relative strength, and QQQ’s fund score of 4.36 is still in very solid territory.

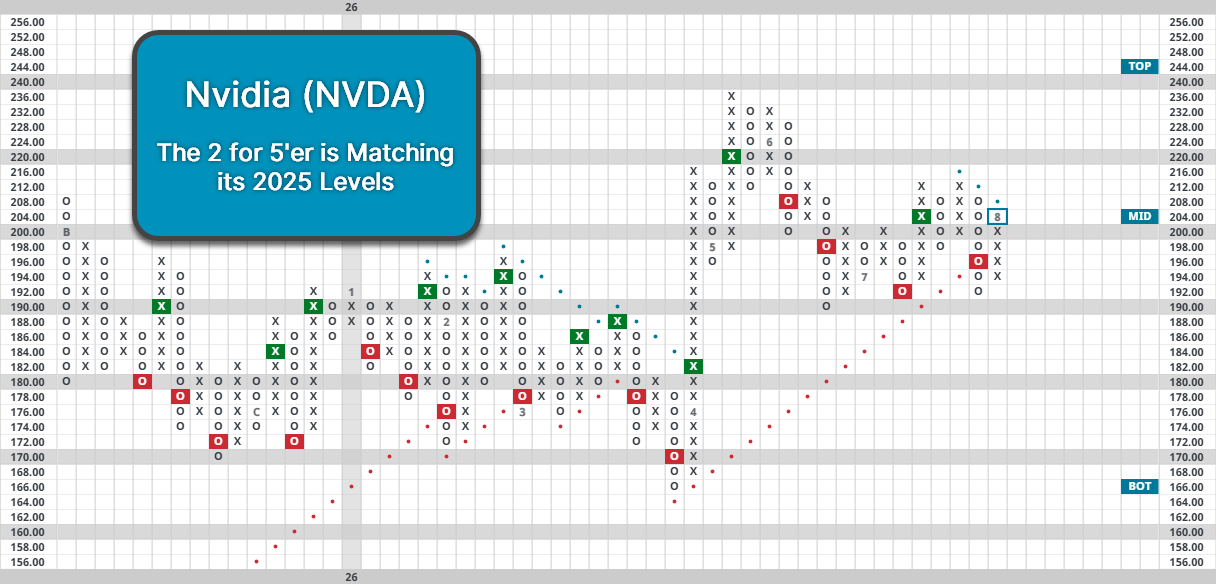
One stock that is reminiscent of the broader mega cap space is Nvidia (NVDA), as it has somewhat mirrored the movement of XLG over the last two years. The stock is essentially flat over the last year after pulling back from May highs. The rangebound trading of the stock has seen it move to technically unfavorable territory as a 2 for 5’er. The stock currently faces resistance at $212, but movement above that level would return it to a positive trend. NVDA also lacks some peer and market relative strength, and it certainly doesn’t have the steam behind it that it once did.