Most Requested Symbols

NDW Model Competition Update
The market has been supported by the largest stocks over the last several years, with the mega cap technology titans consistently pushing the markets to new heights. But this year has been different, and relative strength is finally starting to shift away from the largest companies.
NDW Morning Pulse - August 4, 2026
Below are highlights from the NDW Morning Update Video for the morning of 8/3/2026. Access the the video on the NDW Morning Update Video page.


We are now one full month into the NDW Custom Model Competition. As a group, our competitor models are a bit worse off than they were at our last our performance update as even the top performing model is now slightly in the red (and slightly behind the S&P 500 over the same period). This has been a challenging period for trend following strategies as the existing leadership (i.e., semiconductors and other AI-related segments of the market) were mostly lower in July. The negative effects of the leaders lagging was potentially compounded as some trend following strategies may have exited positions soon before semis rallied at the end of July. That being said, we are only a third of the way through our three-month competition so there is still time for trends to solidify and our competitor models to regain their footing.
The market has been supported by the largest stocks over the last several years, with the mega cap technology titans consistently pushing the markets to new heights. But this year has been different, and relative strength is finally starting to shift away from the largest companies.
Looking at the Invesco S&P 500 Top 50 ETF (XLG), the fund has put together a surpassingly slow start to the year. While the S&P 500 is up around 10%, the mega cap representative has gone up by a meager 2.5%, trailing the S&P 500 equal weight index by around 10% as well. Even going back to the end of October, the fund has gone essentially nowhere over the last nine months, with it currently sitting within 1.5% of its price at that time. All of this stagnation within mega caps has resulted in several notable relative strength developments.
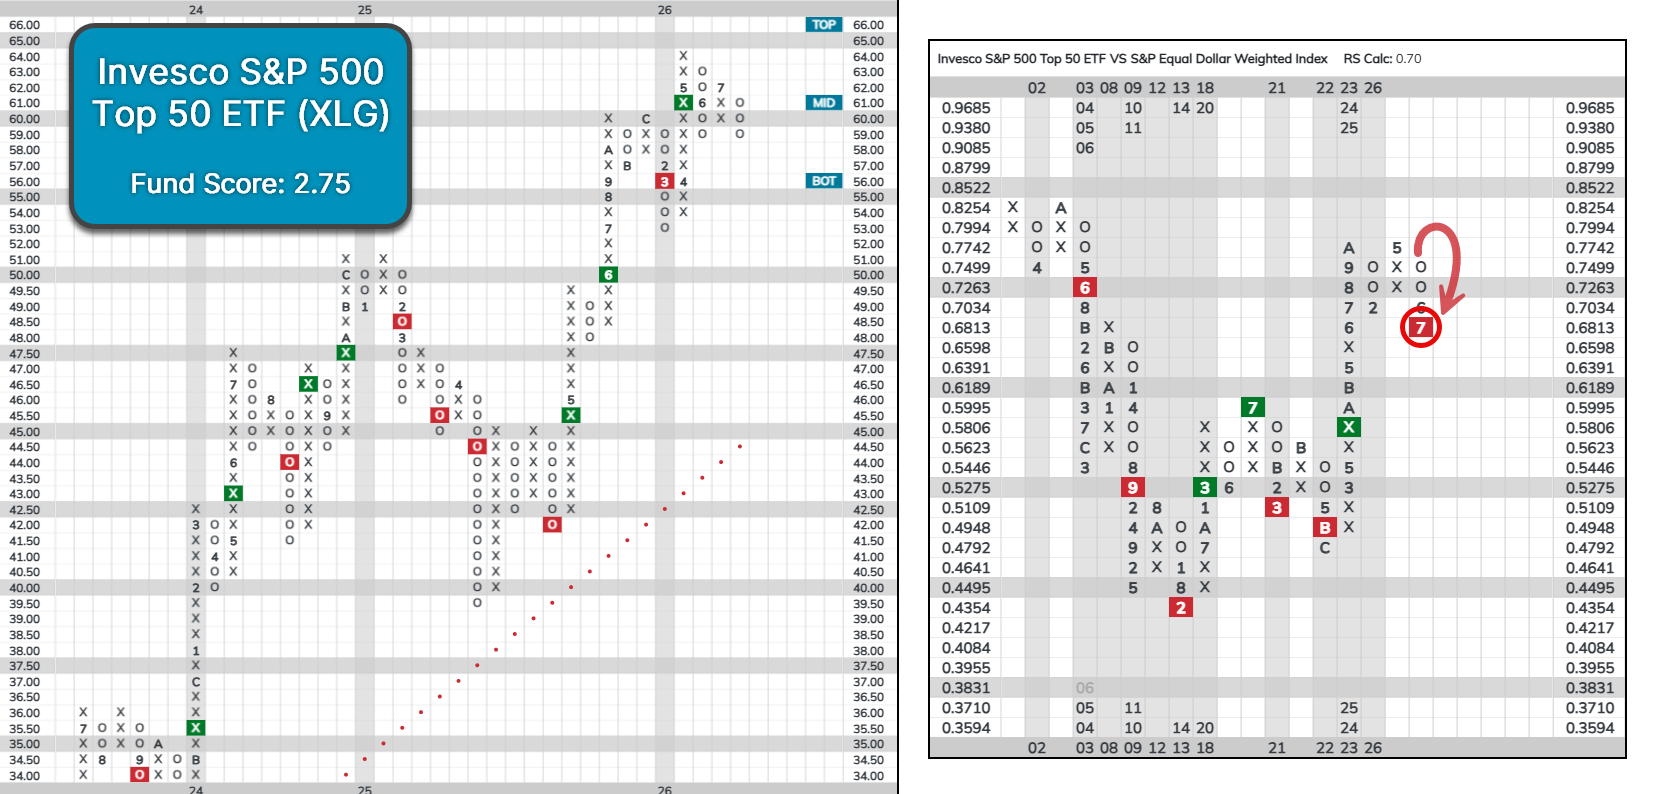
While XLG is still on a buy signal, it has consolidated notably over the last several months. On a relative basis, the fund lost near-term relative strength versus the S&P 500 equal weight index. Following that reversal, the fund moved to its first market RS sell signal since 2022, underscoring the intensity of relative strength deterioration of the mega caps in recent months.
Given these RS changes, XLG has also seen its fund score cut in half from its highs. On May 19th, XLG displayed a fund score of 5.59, which is in line with where it has been for several years. The last time XLG held a fund score below 3.5 was in early 2023… until now. XLG currently holds a fund score of 2.75, sitting below the acceptable 3.0 threshold for the first time in almost four years, marking a significant departure from its prior strength. XLG’s fund score is even more notable in the context of the average stock. The Invesco S&P 500 Equal Weight ETF (RSP) has held a mediocre fund score below 3.5 for the last two and a half years, but recent action saw RSP’s score move above that level. RSP now holds more strength than XLG for the first time since 2023 as well. So, while mega caps have been weakening, the averages joes of the market have strengthened.

Recent weakness within mega caps has been primarily at the hands of the mega cap growth companies, with semiconductor manufacturers and other tech titans pulling back. The Nasdaq-100 moved to a sell signal last week for the first time since March, briefly entering correction territory. Additionally, the index also lost near-term market relative strength, reversing into a column of Os against the S&P 500 equal weight index (SPXEWI). Looking at the Invesco QQQ Trust (QQQ), its fund score has dropped nearly 1.5 points from its peak in May. That said, the index continues to hold long-term market relative strength, and QQQ’s fund score of 4.36 is still in very solid territory.

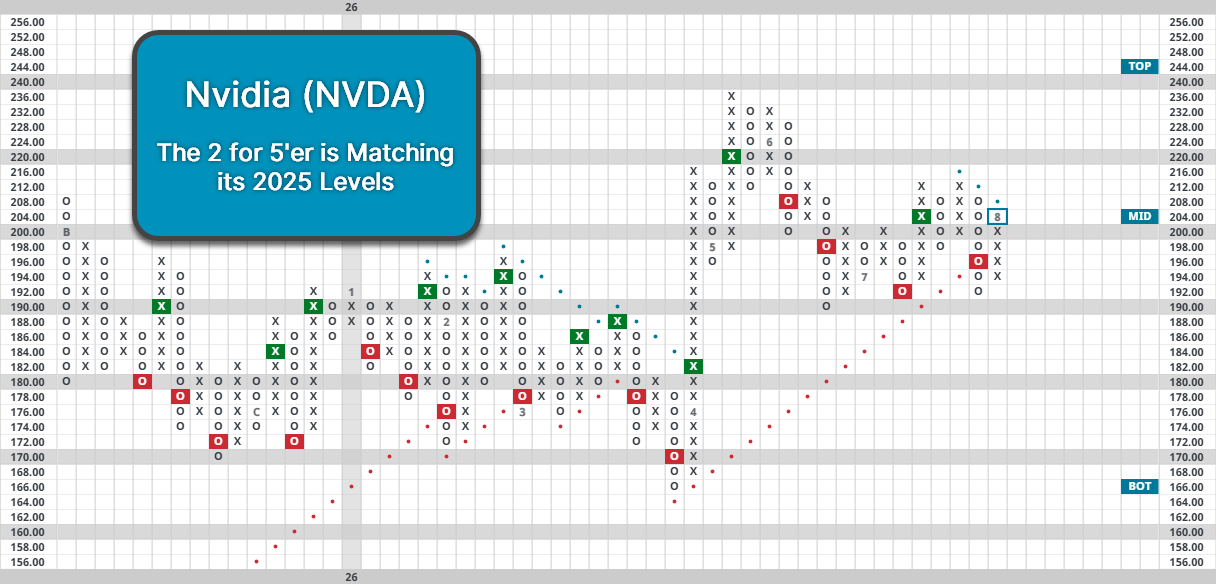
One stock that is reminiscent of the broader mega cap space is Nvidia (NVDA), as it has somewhat mirrored the movement of XLG over the last two years. The stock is essentially flat over the last year after pulling back from May highs. The rangebound trading of the stock has seen it move to technically unfavorable territory as a 2 for 5’er. The stock currently faces resistance at $212, but movement above that level would return it to a positive trend. NVDA also lacks some peer and market relative strength, and it certainly doesn’t have the steam behind it that it once did.

Average Level
-6.62
| < - -100 | -100 - -80 | -80 - -60 | -60 - -40 | -40 - -20 | -20 - 0 | 0 - 20 | 20 - 40 | 40 - 60 | 60 - 80 | 80 - 100 | 100 - > |
|---|---|---|---|---|---|---|---|---|---|---|---|
|
Buy signalgcc
|
|||||||||||
|
Buy signaldia
|
|||||||||||
|
Sell signalfxe
|
|||||||||||
|
Sell signalQQQ
|
Buy signalefa
|
||||||||||
|
Sell signalgld
|
Buy signaluso
|
||||||||||
|
Sell signalEEM
|
Buy signalxlg
|
Sell signalshy
|
Buy signalVOOV
|
||||||||
|
Buy signalhyg
|
Buy signaliwm
|
Buy signalicf
|
Buy signalrsp
|
||||||||
|
Sell signaltlt
|
Sell signalagg
|
Buy signaldx/y
|
Sell signalVOOG
|
Buy signalSPY
|
Buy signaldvy
|
||||||
|
Sell signallqd
|
Sell signalief
|
Sell signalONEQ
|
Buy signalIJH
|
Buy signalijr
|
Sell signalgsg
|
||||||
| < - -100 | -100 - -80 | -80 - -60 | -60 - -40 | -40 - -20 | -20 - 0 | 0 - 20 | 20 - 40 | 40 - 60 | 60 - 80 | 80 - 100 | 100 - > |
| AGG | iShares US Core Bond ETF |
| USO | United States Oil Fund |
| DIA | SPDR Dow Jones Industrial Average ETF |
| DVY | iShares Dow Jones Select Dividend Index ETF |
| DX/Y | NYCE U.S.Dollar Index Spot |
| EFA | iShares MSCI EAFE ETF |
| FXE | Invesco CurrencyShares Euro Trust |
| GLD | SPDR Gold Trust |
| GSG | iShares S&P GSCI Commodity-Indexed Trust |
| HYG | iShares iBoxx $ High Yield Corporate Bond ETF |
| ICF | iShares Cohen & Steers Realty ETF |
| IEF | iShares Barclays 7-10 Yr. Tres. Bond ETF |
| LQD | iShares iBoxx $ Investment Grade Corp. Bond ETF |
| IJH | iShares S&P 400 MidCap Index Fund |
| ONEQ | Fidelity Nasdaq Composite Index Track |
| QQQ | Invesco QQQ Trust |
| RSP | Invesco S&P 500 Equal Weight ETF |
| IWM | iShares Russell 2000 Index ETF |
| SHY | iShares Barclays 1-3 Year Tres. Bond ETF |
| IJR | iShares S&P 600 SmallCap Index Fund |
| SPY | SPDR S&P 500 Index ETF Trust |
| TLT | iShares Barclays 20+ Year Treasury Bond ETF |
| GCC | WisdomTree Continuous Commodity Index Fund |
| VOOG | Vanguard S&P 500 Growth ETF |
| VOOV | Vanguard S&P 500 Value ETF |
| EEM | iShares MSCI Emerging Markets ETF |
| XLG | Invesco S&P 500 Top 50 ETF |
| Symbol | Company | Sector | Current Price | Action Price | Target | Stop | Notes |
|---|---|---|---|---|---|---|---|
| CM | Canadian Imperial Bank of Commerce | Banks | $118.55 | 100s | 165 | 90 | 5 for 5'er, top 10% of favored BANK sector matrix, LT pos peer RS, bearish signal reversal, R-R>3.0, 2.9% yield, Earn. 8/27 |
| HEI | Heico Corporation | Aerospace Airline | $356.36 | 330s - 350s | 480 | 284 | 4 for 5'er, top third of AERO sector matrix, LT pos mkt RS, bullish triangle, buy on pullback, good R-R, Earn. 8/25 |
| DLTR | Dollar Tree, Inc. | Retailing | $127.21 | hi 110s - 120s | 186 | 104 | 4 for 5'er, top half RETA sector matrix, spread quad top, buy on pullback R-R>2.5 |
| VSXY | Victoria's Secret & Company | Retailing | $88.68 | 81 - 87 | 109 | 71 | 5 for 5'er, 3rd in Retailing matrix, pos. trend, 2nd buy on 7/20, ATH on 7/21, Earn. 8/26 |
| ZION | Zions Bancorporation | Banks | $69.70 | mid-to-hi 60s | 87 | 55 | 4 for 5'er, top half of favored BANK sector matrix, new RS buy signal, buy on pullback, R-R~2.0, 2.5% yield |
| PM | Philip Morris International Inc. | Food Beverages/Soap | $190.82 | hi 180s - lo 200s | 232 | 160 | 5 TA rating, top 20% of FOOD sector matrix, LT RS buy, yield > 3%, buy-on-pullback |
| FR | First Industrial Realty Trust | Real Estate | $65.84 | mid-to-hi 60s | 86 | 59 | 4 for 5'er, top 25% of REAL sector matrix, LT pos peer RS, spread sextuple top, R-R>2.0, 2.9% yield |
| CB | Chubb Ltd | Insurance | $350.68 | mid 340s - mid 360s | 456 | 308 | 4 for 5'er, pos. trend since 2023, LT Mkt RS buy since May '24, Reward to Risk > 4. |
| BFH | Bread Financial Holdings Inc. | Business Products | $108.07 | 100 - 110 | 129 | 89 | 5 for 5'er, top 20% of favored BUSI sector matrix, LT pos peer & mkt RS |
| FITB | Fifth Third Bancorp | Banks | $56.50 | mid to upper 50s | 84 | 46 | 4 for 5'er since March '24, pos. LT Peer RS since March '09, LT pos. trend since Dec. '23. |
| HIG | Hartford Insurance Group Inc/The | Insurance | $141.91 | hi 130s - 140s | 164 | 126 | 5 for 5'er, LT pos peer & mkt RS, bullish catapult, good R-R, 1.65% yield |
| NIC | Nicolet Bankshares Inc | Banks | $170.92 | mid 160s - mid 170s | 196 | 148 | 5 for 5'er, top third of favored BANK sector matrix, LT pos peer RS, shakeout to triple top |
| Symbol | Company | Sector | Current Price | Action Price | Target | Stop | Notes |
|---|
| Comment | |||||||
|---|---|---|---|---|---|---|---|
|
|
|||||||
NIC Nicolet Bankshares Inc R ($173.04) - Banks - NIC is a 5 for 5'er that ranks in the top third of the favored banks sector matrix and has been on a peer RS buy signal since 2019. On its default chart, NIC completed a shakeout pattern in last week's trading when it broke a triple top at $174. Long exposure may be added in the mid $160s to mid $170s and we will set our initial stop at $148, which would violate NIC's trend line. We will use the bullish price objective, $196, as our target price. Note that if NIC continues higher in the current column of Xs, its bullish price objective will increase.
| 174.00 | X | 174.00 | |||||||||||||||||||||||||||
| 172.00 | X | X | X | 172.00 | |||||||||||||||||||||||||
| 170.00 | X | X | O | X | O | X | 170.00 | ||||||||||||||||||||||
| 168.00 | X | O | X | O | X | O | X | 168.00 | |||||||||||||||||||||
| 166.00 | 7 | O | X | O | O | X | 166.00 | ||||||||||||||||||||||
| 164.00 | • | X | O | X | O | 164.00 | |||||||||||||||||||||||
| 162.00 | X | X | • | • | X | O | 162.00 | ||||||||||||||||||||||
| 160.00 | X | O | X | O | • | X | • | X | 160.00 | ||||||||||||||||||||
| 158.00 | X | X | O | X | O | • | X | O | • | X | 158.00 | ||||||||||||||||||
| 156.00 | X | O | X | O | O | X | O | • | X | Mid | 156.00 | ||||||||||||||||||
| 154.00 | X | O | X | O | X | X | O | • | X | 154.00 | |||||||||||||||||||
| 152.00 | X | O | 3 | X | O | X | O | • | X | X | 152.00 | ||||||||||||||||||
| 150.00 | X | O | X | O | 4 | O | X | X | O | X | 150.00 | ||||||||||||||||||
| 148.00 | X | 2 | O | X | O | X | O | X | O | X | O | X | • | 148.00 | |||||||||||||||
| 146.00 | X | O | X | O | X | O | X | O | X | O | X | X | O | X | • | 146.00 | |||||||||||||
| 144.00 | X | O | X | O | O | X | O | • | O | X | O | X | O | • | 144.00 | ||||||||||||||
| 142.00 | X | O | O | X | • | 5 | X | O | X | • | 142.00 | ||||||||||||||||||
| 140.00 | X | • | O | • | O | X | O | X | • | 140.00 | |||||||||||||||||||
| 138.00 | X | • | • | O | 6 | X | • | 138.00 | |||||||||||||||||||||
| 136.00 | X | • | O | X | • | 136.00 | |||||||||||||||||||||||
| 134.00 | X | • | O | X | • | 134.00 | |||||||||||||||||||||||
| 132.00 | O | X | • | O | • | Bot | 132.00 | ||||||||||||||||||||||
| 130.00 | O | X | • | • | 130.00 | ||||||||||||||||||||||||
| 128.00 | O | • | 128.00 |

| ARM ARM Holdings PLC ADR ($238.37) - Semiconductors - ARM broke another double bottom at $220 for its fourth consecutive sell signal. ARM has lost significant relative strength over the last several weeks, losing all of its peer and market relative strength, pushing it down to sell territory as a 1 for 5'er. Those with exposure could look to cut the name loose here. From here, initial support lies from $204 to $194, with the bullish support line at $186. |
| AU AngloGold Ashanti Limited (South Africa) ADR ($81.88) - Precious Metals - AU returned to a buy signal and a positive trend Monday when it broke a spread quadruple top at $83, where it now sits against resistance. The positive trend change will promote AU to an acceptable 3 for 5'er. From here, the first level of support sits at $74. |
| CHD Church & Dwight Company ($100.13) - Household Goods - CHD completed a spread septuple top break at $102. The 4 for 5'er moved up from a 3 after reversing back into a positive trend with its latest move. Long exposure can be made here given the weight of the evidence. Initial strong support can be seen between $93-$95. |
| DAL Delta Air Lines Inc. ($91.06) - Aerospace Airline - DAL broke a double top at $90 to return to a buy signal as shares rallied to $91. DAL maintains a 5 technical attribute rating and ranks 2nd (out of 63) in the Aerospace Airline sector matrix. Okay to consider here on the breakout. Note prior highs at $95. Initial support lies at $81, while the bullish support line sits at $78. |
| DASH DoorDash, Inc. Class A ($201.86) - Restaurants - DASH broke a spread triple top at $200 for a second buy signal and to bring the chart to levels not seen since February. The stock improved to a 5 for 5'er after seeing the trend flip to positive during the closing days of July. Okay to consider here on the breakout. From here, note resistance in the $230 range. Initial support lies at $190, while the bullish support line lies at $172. |
| DINO HF Sinclair Corporation ($87.83) - Oil Service - DINO gave an initial sell signal Monday when it broke a double bottom at $88. The outlook for the stock remains favorable, however, as DINO is a 5 for 5'er that ranks in the top decile of the oil service sector matrix. From here, the next level of support sits at $86. |
| EMN Eastman Chemical Company ($71.92) - Chemicals - EMN gave a second consecutive buy signal and moved into a positive trend Monday when it broke a double top at $72. The outlook for the stock remains negative, however, as even with the positive trend change EMN is a 1 for 5'er. From here, support can be found at $68 while the next level of overhead resistance sits at $77. |
| GE GE Aerospace ($369.05) - Aerospace Airline -GE sits off recent highs established during our last comment on 7/2. Since that point, this 5/5'er has journeyed nicely off its bullish support line below current levels, sitting just within earshot of its highs above current levels at $380. GE ranks 5th out of 63 within the aerospace matrix and remains a featured leader within the group- it is up nearly 20% so far this year. |
| IFF International Flavors & Fragrances Inc. ($80.30) - Chemicals - IFF gave an initial buy signal and returned to a positive trend Monday when it broke a double top at $81. The positive trend change will elevate the stock to a 4 for 5'er. From here, the next level of overhead resistance sits at $83. Meanwhile, support can be found at $73. |
| MAR Marriott International, Inc. ($347.52) - Leisure - MAR broke a double bottom at $360 to return to a sell signal as shares fell to $348. This brings the chart down to test support at current prices and will flip the trend back to negative, dropping the stock down to a 4 for 5'er. Also note the market RS chart is within one box of reversing down into Os with this breakdown. Beyond current support, additional can be found in the $312 to $320 range. |
|
SAP SAP AG (Germany) ADR ($190.39) - Software - Shares of SAP pushed higher on Monday, moving to its second consecutive buy signal. Today's movement also saw the stock reverse back into Xs on its market RS chart. SAP has rebounded sharply off lows, moving back into a positive trend last week as well, placing it in buy territory as a 4 for 5'er. Initial support lies at $178 while initial resistance is at $196. |
| TXN Texas Instruments Incorporated ($269.04) - Semiconductors - TXN reversed down into a column of Os and broke a double bottom at $268, marking its third consecutive sell signal. This 3 for 5'er was demoted from a 4 for 5'er last week and now trades just above its bullish support line. Relative strength is mixed here, as the stock reversed into a column of Os against the market last week. The weight of the technical evidence is beginning to deteriorate, and traders should watch the bullish support line closely for signs of a trend violation. Initial support lies at $268, in addition to $256 at the bullish support line. |
The option suggestions featured here are pulled from the NDW Options Ideas tool. These are just a sample of the ideas that can be found there. The Options Idea tool contains numerous additional income and speculative plays. It also offers relative strength-based screens targeting the highest (and lowest) relative strength stocks and ETFs that have recently moved counter to their longer-term trend. To access or subscribe to the Options Ideas tool, click here.
Call
Novartis AG (NVS) Oct 16 $150 Call

| Additional Data: | |
| Bid/Ask Spread | 15.18% |
| Delta | 66.77 |
| Gamma | 1.79 |
| Implied Volatility | 26.13% |
| Expiry Date | 76 |
| Earnings Date | 10/27/2026 |
Put
Generac Holdings Inc (GNRC) Nov 20 $200 Put

| Additional Data: | |
| Bid/Ask Spread | 14.34% |
| Delta | -43.71 |
| Gamma | 0.59 |
| Implied Volatility | 61.22% |
| Expiry Date | 111 |
| Earnings Date | 10/28/2026 |
Income (Short Put)
Delta Air Lines Inc (DAL) Sept 04 $85 Short Put

| Additional Data: | |
| Ann. Static Return | 24.64% |
| Bid/Ask Spread | 36.84% |
| Delta | 24.96 |
| Gamma | -2.8 |
| Implied Volatility | 40.02% |
| Expiry Date | 32 |
| Earnings Date | 10/8/2026 |
Daily Equity & Market Analysis
Loading, Please Wait...

